
 Login Sign Up


| |||||
 |  | ||||

| 12Stocks.com Market Intelligence |
Best SmallCap Stocks
|
| In a hurry? Small Cap Stock Lists: Performance Trends Table, Stock Charts
Sort Small Cap stocks: Daily, Weekly, Year-to-Date, Market Cap & Trends. Filter Small Cap stocks list by sector: Show all, Tech, Finance, Energy, Staples, Retail, Industrial, Materials, Utilities and HealthCare Filter Small Cap stocks list by size: All Large Medium Small and MicroCap |
| 12Stocks.com Small Cap Stocks Performances & Trends Daily | |||||||||
|
|  The overall Smart Investing & Trading Score is 69 (0-bearish to 100-bullish) which puts Small Cap index in short term neutral to bullish trend. The Smart Investing & Trading Score from previous trading session is 49 and hence an improvement of trend.
| ||||||||
Here are the Smart Investing & Trading Scores of the most requested small cap stocks at 12Stocks.com (click stock name for detailed review):
|


| 12Stocks.com: Investing in Smallcap Index with Stocks | |
|
The following table helps investors and traders sort through current performance and trends (as measured by Smart Investing & Trading Score) of various
stocks in the Smallcap Index. Quick View: Move mouse or cursor over stock symbol (ticker) to view short-term technical chart and over stock name to view long term chart. Click on  to add stock symbol to your watchlist and to add stock symbol to your watchlist and  to view watchlist. Click on any ticker or stock name for detailed market intelligence report for that stock. to view watchlist. Click on any ticker or stock name for detailed market intelligence report for that stock. |
12Stocks.com Performance of Stocks in Smallcap Index
| Ticker | Stock Name | Watchlist | Category | Recent Price | Smart Investing & Trading Score | Change % | YTD Change% |
| RLJ | RLJ Lodging |   | Financials | 10.72 | 0 | 0.19 | -8.53% |
| HGV | Hilton Grand | | Services & Goods | 43.20 | 42 | 0.19 | 7.52% |
| AUPH | Aurinia | | Health Care | 5.18 | 69 | 0.19 | -42.38% |
| CRGY | Crescent Energy | | Energy | 10.49 | 17 | 0.19 | -20.47% |
| IOSP | Innospec | | Materials | 121.93 | 40 | 0.18 | -1.07% |
| SFM | Sprouts Farmers | | Services & Goods | 72.12 | 100 | 0.17 | 49.91% |
| ENS | EnerSys | | Industrials | 92.50 | 77 | 0.16 | -8.37% |
| AMN | AMN Healthcare | | Industrials | 60.31 | 88 | 0.16 | -19.46% |
| CERE | Cerevel | | Health Care | 42.66 | 71 | 0.16 | 0.64% |
| BOH | Bank of Hawaii | | Financials | 58.58 | 57 | 0.15 | -19.16% |
| AMK | AssetMark Financial | | Financials | 34.00 | 25 | 0.15 | 13.52% |
| SIX | Six Flags | | Services & Goods | 24.02 | 49 | 0.13 | -4.23% |
| HAE | Haemonetics | | Health Care | 93.44 | 95 | 0.12 | 9.27% |
| IBOC | Bancshares | | Financials | 58.45 | 100 | 0.12 | 7.60% |
| SBGI | Slair Broadcast | | Services & Goods | 13.32 | 74 | 0.11 | 2.19% |
| FCFS | FirstCash | | Financials | 114.99 | 45 | 0.11 | 6.09% |
| ENFN | Enfusion | | Technology | 9.53 | 88 | 0.11 | -3.33% |
| AIT | Applied Industrial | | Services & Goods | 184.80 | 39 | 0.09 | 7.01% |
| ASGN | ASGN | | Services & Goods | 96.15 | 22 | 0.09 | -0.02% |
| ALRM | Alarm.com | | Technology | 67.81 | 57 | 0.09 | 4.94% |
| ONEW | OneWater Marine | | Services & Goods | 23.01 | 42 | 0.09 | -31.90% |
| ESE | ESCO | | Technology | 105.57 | 90 | 0.08 | -9.80% |
| GT | Goodyear Tire | | Consumer Staples | 12.35 | 83 | 0.08 | -13.76% |
| KTB | Kontoor Brands | | Consumer Staples | 67.42 | 100 | 0.08 | 8.02% |
| JAMF | Jamf Holding | | Technology | 19.92 | 90 | 0.05 | 10.24% |
| For chart view version of above stock list: Chart View ➞ 0 - 25 , 25 - 50 , 50 - 75 , 75 - 100 , 100 - 125 , 125 - 150 , 150 - 175 , 175 - 200 , 200 - 225 , 225 - 250 , 250 - 275 , 275 - 300 , 300 - 325 , 325 - 350 , 350 - 375 , 375 - 400 , 400 - 425 , 425 - 450 , 450 - 475 , 475 - 500 , 500 - 525 , 525 - 550 , 550 - 575 , 575 - 600 , 600 - 625 , 625 - 650 , 650 - 675 , 675 - 700 | ||
 | Click To Change The Sort Order: By Market Cap or Company Size Performance: Year-to-date, Week and Day |  |
| Too many stocks? View smallcap stocks filtered by marketcap & sector |
| Marketcap: All SmallCap Stocks (default-no microcap), Large, Mid-Range, Small |
| Smallcap Sector: Tech, Finance, Energy, Staples, Retail, Industrial, Materials, & Medical |
|
Get the most comprehensive stock market coverage daily at 12Stocks.com ➞ Best Stocks Today ➞ Best Stocks Weekly ➞ Best Stocks Year-to-Date ➞ Best Stocks Trends ➞  Best Stocks Today 12Stocks.com Best Nasdaq Stocks ➞ Best S&P 500 Stocks ➞ Best Tech Stocks ➞ Best Biotech Stocks ➞ |
| Detailed Overview of SmallCap Stocks |
| SmallCap Technical Overview, Leaders & Laggards, Top SmallCap ETF Funds & Detailed SmallCap Stocks List, Charts, Trends & More |
| Smallcap: Technical Analysis, Trends & YTD Performance | |
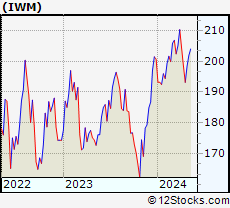
| SmallCap segment as represented by
IWM, an exchange-traded fund [ETF], holds basket of thousands of smallcap stocks from across all major sectors of the US stock market. The smallcap index (contains stocks like Riverbed & Sotheby's) is up by 0.22% and is currently underperforming the overall market by -6.27% year-to-date. Below is a quick view of technical charts and trends: | |
 IWM Weekly Chart |
|
| Long Term Trend: Not Good | |
| Medium Term Trend: Very Good | |
 IWM Daily Chart |
|
| Short Term Trend: Very Good | |
| Overall Trend Score: 69 | |
| YTD Performance: 0.22% | |
| **Trend Scores & Views Are Only For Educational Purposes And Not For Investing | |
| 12Stocks.com: Top Performing Small Cap Index Stocks | ||||||||||||||||||||||||||||||||||||||||||||||||
 The top performing Small Cap Index stocks year to date are
Now, more recently, over last week, the top performing Small Cap Index stocks on the move are


|
||||||||||||||||||||||||||||||||||||||||||||||||
| 12Stocks.com: Investing in Smallcap Index using Exchange Traded Funds | |
|
The following table shows list of key exchange traded funds (ETF) that
help investors track Smallcap index. The following list also includes leveraged ETF funds that track twice or thrice the daily returns of Smallcap indices. Short or inverse ETF funds move in the opposite direction to the index they track and are useful during market pullbacks or during bear markets. Quick View: Move mouse or cursor over ETF symbol (ticker) to view short-term technical chart and over ETF name to view long term chart. Click on ticker or stock name for detailed view. Click on to add stock symbol to your watchlist and to view watchlist. |
12Stocks.com List of ETFs that track Smallcap Index
| Ticker | ETF Name | Watchlist | Recent Price | Smart Investing & Trading Score | Change % | Week % | Year-to-date % |
| IWM | iShares Russell 2000 | | 201.15 | 69 | 0.61 | 1.39 | 0.22% |
| IJR | iShares Core S&P Small-Cap | | 106.83 | 82 | 0.47 | 1.12 | -1.31% |
| SDD | ProShares UltraShort SmallCap600 | | 18.35 | 10 | -4.97 | -5.17 | -0.42% |
| SBB | ProShares Short SmallCap600 | | 16.33 | 41 | -0.25 | -0.34 | 2.51% |
| SAA | ProShares Ultra SmallCap600 | | 23.93 | 82 | 4.36 | 3.88 | -4.07% |
| 12Stocks.com: Charts, Trends, Fundamental Data and Performances of SmallCap Stocks | |
|
We now take in-depth look at all SmallCap stocks including charts, multi-period performances and overall trends (as measured by Smart Investing & Trading Score). One can sort SmallCap stocks (click link to choose) by Daily, Weekly and by Year-to-Date performances. Also, one can sort by size of the company or by market capitalization. |
| Select Your Default Chart Type: | |||||
| |||||
| Click on stock symbol or name for detailed view. Click on to add stock symbol to your watchlist and to view watchlist. Quick View: Move mouse or cursor over "Daily" to quickly view daily technical stock chart and over "Weekly" to view weekly technical stock chart. | |||||

 | RLJ RLJ Lodging Trust |
| Sector: Financials | |
| SubSector: REIT - Hotel/Motel | |
| MarketCap: 1019.34 Millions | |
| Recent Price: 10.72 Smart Investing & Trading Score: 0 | |
| Day Percent Change: 0.19% Day Change: 0.02 | |
| Week Change: -3.51% Year-to-date Change: -8.5% | |
| RLJ Links: Profile News Message Board | |
| Charts:- Daily , Weekly | |
| Add RLJ to Watchlist: View: Get Complete RLJ Trend Analysis ➞ | |
 | HGV Hilton Grand Vacations Inc. |
| Sector: Services & Goods | |
| SubSector: Resorts & Casinos | |
| MarketCap: 1333.04 Millions | |
| Recent Price: 43.20 Smart Investing & Trading Score: 42 | |
| Day Percent Change: 0.19% Day Change: 0.08 | |
| Week Change: -2.57% Year-to-date Change: 7.5% | |
| HGV Links: Profile News Message Board | |
| Charts:- Daily , Weekly | |
| Add HGV to Watchlist: View: Get Complete HGV Trend Analysis ➞ | |
 | AUPH Aurinia Pharmaceuticals Inc. |
| Sector: Health Care | |
| SubSector: Biotechnology | |
| MarketCap: 1319.75 Millions | |
| Recent Price: 5.18 Smart Investing & Trading Score: 69 | |
| Day Percent Change: 0.19% Day Change: 0.01 | |
| Week Change: 5.5% Year-to-date Change: -42.4% | |
| AUPH Links: Profile News Message Board | |
| Charts:- Daily , Weekly | |
| Add AUPH to Watchlist: View: Get Complete AUPH Trend Analysis ➞ | |
 | CRGY Crescent Energy Company |
| Sector: Energy | |
| SubSector: Oil & Gas E&P | |
| MarketCap: 1700 Millions | |
| Recent Price: 10.49 Smart Investing & Trading Score: 17 | |
| Day Percent Change: 0.19% Day Change: 0.02 | |
| Week Change: -3.14% Year-to-date Change: -20.5% | |
| CRGY Links: Profile News Message Board | |
| Charts:- Daily , Weekly | |
| Add CRGY to Watchlist: View: Get Complete CRGY Trend Analysis ➞ | |
 | IOSP Innospec Inc. |
| Sector: Materials | |
| SubSector: Specialty Chemicals | |
| MarketCap: 1665.57 Millions | |
| Recent Price: 121.93 Smart Investing & Trading Score: 40 | |
| Day Percent Change: 0.18% Day Change: 0.22 | |
| Week Change: 0.66% Year-to-date Change: -1.1% | |
| IOSP Links: Profile News Message Board | |
| Charts:- Daily , Weekly | |
| Add IOSP to Watchlist: View: Get Complete IOSP Trend Analysis ➞ | |
 | SFM Sprouts Farmers Market, Inc. |
| Sector: Services & Goods | |
| SubSector: Grocery Stores | |
| MarketCap: 2495.85 Millions | |
| Recent Price: 72.12 Smart Investing & Trading Score: 100 | |
| Day Percent Change: 0.17% Day Change: 0.12 | |
| Week Change: 7.67% Year-to-date Change: 49.9% | |
| SFM Links: Profile News Message Board | |
| Charts:- Daily , Weekly | |
| Add SFM to Watchlist: View: Get Complete SFM Trend Analysis ➞ | |
 | ENS EnerSys |
| Sector: Industrials | |
| SubSector: Industrial Electrical Equipment | |
| MarketCap: 2068.79 Millions | |
| Recent Price: 92.50 Smart Investing & Trading Score: 77 | |
| Day Percent Change: 0.16% Day Change: 0.14 | |
| Week Change: 1.34% Year-to-date Change: -8.4% | |
| ENS Links: Profile News Message Board | |
| Charts:- Daily , Weekly | |
| Add ENS to Watchlist: View: Get Complete ENS Trend Analysis ➞ | |
 | AMN AMN Healthcare Services, Inc. |
| Sector: Industrials | |
| SubSector: General Building Materials | |
| MarketCap: 3064.03 Millions | |
| Recent Price: 60.31 Smart Investing & Trading Score: 88 | |
| Day Percent Change: 0.16% Day Change: 0.09 | |
| Week Change: 5.58% Year-to-date Change: -19.5% | |
| AMN Links: Profile News Message Board | |
| Charts:- Daily , Weekly | |
| Add AMN to Watchlist: View: Get Complete AMN Trend Analysis ➞ | |
 | CERE Cerevel Therapeutics Holdings, Inc. |
| Sector: Health Care | |
| SubSector: Biotechnology | |
| MarketCap: 21587 Millions | |
| Recent Price: 42.66 Smart Investing & Trading Score: 71 | |
| Day Percent Change: 0.16% Day Change: 0.07 | |
| Week Change: 0.45% Year-to-date Change: 0.6% | |
| CERE Links: Profile News Message Board | |
| Charts:- Daily , Weekly | |
| Add CERE to Watchlist: View: Get Complete CERE Trend Analysis ➞ | |
 | BOH Bank of Hawaii Corporation |
| Sector: Financials | |
| SubSector: Regional - Pacific Banks | |
| MarketCap: 2305.19 Millions | |
| Recent Price: 58.58 Smart Investing & Trading Score: 57 | |
| Day Percent Change: 0.15% Day Change: 0.09 | |
| Week Change: -0.09% Year-to-date Change: -19.2% | |
| BOH Links: Profile News Message Board | |
| Charts:- Daily , Weekly | |
| Add BOH to Watchlist: View: Get Complete BOH Trend Analysis ➞ | |
 | AMK AssetMark Financial Holdings, Inc. |
| Sector: Financials | |
| SubSector: Asset Management | |
| MarketCap: 1296.33 Millions | |
| Recent Price: 34.00 Smart Investing & Trading Score: 25 | |
| Day Percent Change: 0.15% Day Change: 0.05 | |
| Week Change: 0.21% Year-to-date Change: 13.5% | |
| AMK Links: Profile News Message Board | |
| Charts:- Daily , Weekly | |
| Add AMK to Watchlist: View: Get Complete AMK Trend Analysis ➞ | |
 | SIX Six Flags Entertainment Corporation |
| Sector: Services & Goods | |
| SubSector: General Entertainment | |
| MarketCap: 1282.69 Millions | |
| Recent Price: 24.02 Smart Investing & Trading Score: 49 | |
| Day Percent Change: 0.13% Day Change: 0.03 | |
| Week Change: 1.22% Year-to-date Change: -4.2% | |
| SIX Links: Profile News Message Board | |
| Charts:- Daily , Weekly | |
| Add SIX to Watchlist: View: Get Complete SIX Trend Analysis ➞ | |
 | HAE Haemonetics Corporation |
| Sector: Health Care | |
| SubSector: Medical Instruments & Supplies | |
| MarketCap: 4500.7 Millions | |
| Recent Price: 93.44 Smart Investing & Trading Score: 95 | |
| Day Percent Change: 0.12% Day Change: 0.11 | |
| Week Change: 2.69% Year-to-date Change: 9.3% | |
| HAE Links: Profile News Message Board | |
| Charts:- Daily , Weekly | |
| Add HAE to Watchlist: View: Get Complete HAE Trend Analysis ➞ | |
 | IBOC International Bancshares Corporation |
| Sector: Financials | |
| SubSector: Regional - Southwest Banks | |
| MarketCap: 1159.45 Millions | |
| Recent Price: 58.45 Smart Investing & Trading Score: 100 | |
| Day Percent Change: 0.12% Day Change: 0.07 | |
| Week Change: 4.1% Year-to-date Change: 7.6% | |
| IBOC Links: Profile News Message Board | |
| Charts:- Daily , Weekly | |
| Add IBOC to Watchlist: View: Get Complete IBOC Trend Analysis ➞ | |
 | SBGI Sinclair Broadcast Group, Inc. |
| Sector: Services & Goods | |
| SubSector: Broadcasting - TV | |
| MarketCap: 1461.73 Millions | |
| Recent Price: 13.32 Smart Investing & Trading Score: 74 | |
| Day Percent Change: 0.11% Day Change: 0.01 | |
| Week Change: 9.86% Year-to-date Change: 2.2% | |
| SBGI Links: Profile News Message Board | |
| Charts:- Daily , Weekly | |
| Add SBGI to Watchlist: View: Get Complete SBGI Trend Analysis ➞ | |
 | FCFS FirstCash, Inc. |
| Sector: Financials | |
| SubSector: Credit Services | |
| MarketCap: 2795.48 Millions | |
| Recent Price: 114.99 Smart Investing & Trading Score: 45 | |
| Day Percent Change: 0.11% Day Change: 0.13 | |
| Week Change: -0.62% Year-to-date Change: 6.1% | |
| FCFS Links: Profile News Message Board | |
| Charts:- Daily , Weekly | |
| Add FCFS to Watchlist: View: Get Complete FCFS Trend Analysis ➞ | |
 | ENFN Enfusion, Inc. |
| Sector: Technology | |
| SubSector: Software - Application | |
| MarketCap: 1290 Millions | |
| Recent Price: 9.53 Smart Investing & Trading Score: 88 | |
| Day Percent Change: 0.11% Day Change: 0.01 | |
| Week Change: 1.17% Year-to-date Change: -3.3% | |
| ENFN Links: Profile News Message Board | |
| Charts:- Daily , Weekly | |
| Add ENFN to Watchlist: View: Get Complete ENFN Trend Analysis ➞ | |
 | AIT Applied Industrial Technologies, Inc. |
| Sector: Services & Goods | |
| SubSector: Industrial Equipment Wholesale | |
| MarketCap: 1531.58 Millions | |
| Recent Price: 184.80 Smart Investing & Trading Score: 39 | |
| Day Percent Change: 0.09% Day Change: 0.17 | |
| Week Change: 2.16% Year-to-date Change: 7.0% | |
| AIT Links: Profile News Message Board | |
| Charts:- Daily , Weekly | |
| Add AIT to Watchlist: View: Get Complete AIT Trend Analysis ➞ | |
 | ASGN ASGN Incorporated |
| Sector: Services & Goods | |
| SubSector: Staffing & Outsourcing Services | |
| MarketCap: 2035.88 Millions | |
| Recent Price: 96.15 Smart Investing & Trading Score: 22 | |
| Day Percent Change: 0.09% Day Change: 0.09 | |
| Week Change: -1.39% Year-to-date Change: 0.0% | |
| ASGN Links: Profile News Message Board | |
| Charts:- Daily , Weekly | |
| Add ASGN to Watchlist: View: Get Complete ASGN Trend Analysis ➞ | |
 | ALRM Alarm.com Holdings, Inc. |
| Sector: Technology | |
| SubSector: Application Software | |
| MarketCap: 2035.62 Millions | |
| Recent Price: 67.81 Smart Investing & Trading Score: 57 | |
| Day Percent Change: 0.09% Day Change: 0.06 | |
| Week Change: 2.79% Year-to-date Change: 4.9% | |
| ALRM Links: Profile News Message Board | |
| Charts:- Daily , Weekly | |
| Add ALRM to Watchlist: View: Get Complete ALRM Trend Analysis ➞ | |
 | ONEW OneWater Marine Inc. |
| Sector: Services & Goods | |
| SubSector: Recreational Vehicles | |
| MarketCap: 42027 Millions | |
| Recent Price: 23.01 Smart Investing & Trading Score: 42 | |
| Day Percent Change: 0.09% Day Change: 0.02 | |
| Week Change: 4.73% Year-to-date Change: -31.9% | |
| ONEW Links: Profile News Message Board | |
| Charts:- Daily , Weekly | |
| Add ONEW to Watchlist: View: Get Complete ONEW Trend Analysis ➞ | |
 | ESE ESCO Technologies Inc. |
| Sector: Technology | |
| SubSector: Scientific & Technical Instruments | |
| MarketCap: 1968.03 Millions | |
| Recent Price: 105.57 Smart Investing & Trading Score: 90 | |
| Day Percent Change: 0.08% Day Change: 0.08 | |
| Week Change: 0.21% Year-to-date Change: -9.8% | |
| ESE Links: Profile News Message Board | |
| Charts:- Daily , Weekly | |
| Add ESE to Watchlist: View: Get Complete ESE Trend Analysis ➞ | |
 | GT The Goodyear Tire & Rubber Company |
| Sector: Consumer Staples | |
| SubSector: Rubber & Plastics | |
| MarketCap: 1483.7 Millions | |
| Recent Price: 12.35 Smart Investing & Trading Score: 83 | |
| Day Percent Change: 0.08% Day Change: 0.01 | |
| Week Change: 4.31% Year-to-date Change: -13.8% | |
| GT Links: Profile News Message Board | |
| Charts:- Daily , Weekly | |
| Add GT to Watchlist: View: Get Complete GT Trend Analysis ➞ | |
 | KTB Kontoor Brands, Inc. |
| Sector: Consumer Staples | |
| SubSector: Textile - Apparel Clothing | |
| MarketCap: 1668.65 Millions | |
| Recent Price: 67.42 Smart Investing & Trading Score: 100 | |
| Day Percent Change: 0.08% Day Change: 0.05 | |
| Week Change: 8.4% Year-to-date Change: 8.0% | |
| KTB Links: Profile News Message Board | |
| Charts:- Daily , Weekly | |
| Add KTB to Watchlist: View: Get Complete KTB Trend Analysis ➞ | |
 | JAMF Jamf Holding Corp. |
| Sector: Technology | |
| SubSector: Software Application | |
| MarketCap: 36987 Millions | |
| Recent Price: 19.92 Smart Investing & Trading Score: 90 | |
| Day Percent Change: 0.05% Day Change: 0.01 | |
| Week Change: 1.89% Year-to-date Change: 10.2% | |
| JAMF Links: Profile News Message Board | |
| Charts:- Daily , Weekly | |
| Add JAMF to Watchlist: View: Get Complete JAMF Trend Analysis ➞ | |
| For tabular summary view of above stock list: Summary View ➞ 0 - 25 , 25 - 50 , 50 - 75 , 75 - 100 , 100 - 125 , 125 - 150 , 150 - 175 , 175 - 200 , 200 - 225 , 225 - 250 , 250 - 275 , 275 - 300 , 300 - 325 , 325 - 350 , 350 - 375 , 375 - 400 , 400 - 425 , 425 - 450 , 450 - 475 , 475 - 500 , 500 - 525 , 525 - 550 , 550 - 575 , 575 - 600 , 600 - 625 , 625 - 650 , 650 - 675 , 675 - 700 | ||
| Click To Change The Sort Order: By Market Cap or Company Size Performance: Year-to-date, Week and Day | |
| Select Chart Type: | ||
| Too many stocks? View smallcap stocks filtered by marketcap & sector |
| Marketcap: All SmallCap Stocks (default-no microcap), Large, Mid-Range, Small & MicroCap |
| Sector: Tech, Finance, Energy, Staples, Retail, Industrial, Materials, Utilities & Medical |
|
Best Stocks Today 12Stocks.com |
© 2024 12Stocks.com Terms & Conditions Privacy Contact Us
All Information Provided Only For Education And Not To Be Used For Investing or Trading. See Terms & Conditions


One More Thing ... Get Best Stocks Delivered Daily!
Never Ever Miss A Move With Our Top Ten Stocks Lists
Find Best Stocks In Any Market - Bull or Bear Market
Take A Peek At Our Top Ten Stocks Lists: Daily, Weekly, Year-to-Date & Top Trends
Find Best Stocks In Any Market - Bull or Bear Market
Take A Peek At Our Top Ten Stocks Lists: Daily, Weekly, Year-to-Date & Top Trends
Smallcap Stocks With Best Up Trends [0-bearish to 100-bullish]: WideOpenWest [100], FTC Solar[100], IES [100], Origin Materials[100], Alignment Healthcare[100], Joint [100], Emergent BioSolutions[100], Adtalem Global[100], El Pollo[100], Enovix [100], Clearfield [100]
Best Smallcap Stocks Year-to-Date:
Janux [482.74%], Viking [306.72%], Longboard [272.5%], Alpine Immune[239.34%], Bakkt [199.55%], Avidity Biosciences[195.24%], Vera [189.47%], Cullinan Oncology[176.9%], Super Micro[173.85%], Arcutis Bio[169.66%], Y-mAbs [154.69%] Best Smallcap Stocks This Week:
Emergent BioSolutions[102.34%], Deciphera [73.28%], Eyenovia [68.74%], Origin Materials[66.52%], Aspen Aerogels[54.66%], Enovix [51.85%], TPI Composites[41.91%], Codexis [41.73%], Cue Biopharma[41.39%], WideOpenWest [41.07%], Carvana Co[39.19%] Best Smallcap Stocks Daily:
WideOpenWest [29.16%], Ardelyx [28.65%], FTC Solar[25.09%], IES [23.96%], Twist Bioscience[23.18%], Origin Materials[22.23%], Alignment Healthcare[21.97%], Joint [18.43%], Emergent BioSolutions[17.73%], Butterfly [17.42%], Vaxxinity [17.27%]