
 Login Sign Up


| |||||
 |  | ||||

| 12Stocks.com Market Intelligence |
Best S&P 500 Stocks
|
On this page, you will find the most comprehensive analysis of S&P 500 stocks and ETFs - from latest trends to performances to charts ➞. First, here are the year-to-date (YTD) performances of the most requested S&P 500 stocks at 12Stocks.com (click stock for review):
| NVIDIA 73% | ||
| Amazon.com 22% | ||
| Google 19% | ||
| Merck 18% | ||
| Walmart 14% | ||
| Caterpillar 13% | ||
| JPMorgan Chase 13% | ||
| Goldman Sachs 12% | ||
| Chevron 8% | ||
| Microsoft 6% | ||
| Johnson & Johnson -4% | ||
| McDonald s -8% | ||
| Apple -10% | ||
| Gilead -19% | ||
| Starbucks -22% | ||
| Boeing -31% | ||
| Intel -39% | ||
| Quick: S&P 500 Stocks Lists: Performances & Trends, S&P 500 Stock Charts
Sort S&P 500 stocks: Daily, Weekly, Year-to-Date, Market Cap & Trends. Filter S&P 500 stocks list by sector: Show all, Tech, Finance, Energy, Staples, Retail, Industrial, Materials, Utilities and HealthCare |
| 12Stocks.com S&P 500 Stocks Performances & Trends Daily Report | |||||||||
|
| 
The overall Smart Investing & Trading Score is 30 (0-bearish to 100-bullish) which puts S&P 500 index in short term bearish to neutral trend. The Smart Investing & Trading Score from previous trading session is 7 and hence an improvement of trend. | ||||||||
Here are the Smart Investing & Trading Scores of the most requested S&P 500 stocks at 12Stocks.com (click stock name for detailed review):
|


| 12Stocks.com: Top Performing S&P 500 Index Stocks | ||||||||||||||||||||||||||||||||||||||||||||||||
 The top performing S&P 500 Index stocks year to date are
Now, more recently, over last week, the top performing S&P 500 Index stocks on the move are


|
||||||||||||||||||||||||||||||||||||||||||||||||
| 12Stocks.com: Investing in S&P 500 Index with Stocks | |
|
The following table helps investors and traders sort through current performance and trends (as measured by Smart Investing & Trading Score) of various
stocks in the S&P 500 Index. Quick View: Move mouse or cursor over stock symbol (ticker) to view short-term technical chart and over stock name to view long term chart. Click on  to add stock symbol to your watchlist and to add stock symbol to your watchlist and  to view watchlist. Click on any ticker or stock name for detailed market intelligence report for that stock. to view watchlist. Click on any ticker or stock name for detailed market intelligence report for that stock. |
12Stocks.com Performance of Stocks in S&P 500 Index
| Ticker | Stock Name | Watchlist | Category | Recent Price | Smart Investing & Trading Score | Change % | YTD Change% |
| LMT | Lockheed Martin |   | Industrials | 463.20 | 63 | 0.32% | 2.20% |
| DHR | Danaher | | Industrials | 246.84 | 42 | -0.02% | 6.70% |
| HON | Honeywell | | Industrials | 193.64 | 27 | -0.85% | -7.66% |
| MMM | 3M | | Industrials | 96.81 | 88 | -1.66% | -11.44% |
| BA | Boeing | | Industrials | 178.85 | 64 | 4.31% | -31.39% |
| GE | General Electric | | Industrials | 162.64 | 53 | 1.84% | 27.43% |
| CAT | Caterpillar | | Industrials | 335.44 | 23 | 1.32% | 13.45% |
| NOC | Northrop Grumman | | Industrials | 475.00 | 68 | -2.34% | 1.47% |
| WM | Waste Management | | Industrials | 207.16 | 28 | 0.19% | 15.67% |
| ITW | Illinois Tool | | Industrials | 242.04 | 10 | -0.09% | -7.60% |
| DE | Deere & | | Industrials | 395.96 | 61 | 2.18% | -0.98% |
| GD | General Dynamics | | Industrials | 287.36 | 56 | 0.29% | 10.66% |
| ROP | Roper Technologies | | Industrials | 510.82 | 8 | -0.77% | -6.30% |
| CARR | Carrier Global | | Industrials | 60.94 | 63 | -0.29% | 6.07% |
| EMR | Emerson Electric | | Industrials | 106.41 | 13 | -0.04% | 9.33% |
| ETN | Eaton | | Industrials | 315.27 | 38 | 1.04% | 30.92% |
| OTIS | Otis Worldwide | | Industrials | 91.77 | 10 | 0.37% | 2.57% |
| RSG | Republic Services | | Industrials | 186.44 | 41 | 0.24% | 13.06% |
| CMI | Cummins | | Industrials | 280.29 | 31 | -1.26% | 17.00% |
| TDG | TransDigm | | Industrials | 1271.78 | 95 | 1.80% | 25.72% |
| AME | AMETEK | | Industrials | 163.34 | 0 | -6.12% | -0.94% |
| ROK | Rockwell Automation | | Industrials | 270.04 | 0 | 0.11% | -13.02% |
| PH | Parker-Hannifin | | Industrials | 530.68 | 0 | -2.26% | 15.19% |
| SWK | Stanley Black | | Industrials | 84.99 | 0 | -7.52% | -13.36% |
| DHI | D.R. Horton | | Industrials | 145.46 | 18 | 2.09% | -4.29% |
| For chart view version of above stock list: Chart View ➞ 0 - 25 , 25 - 50 | ||
 | Click To Change The Sort Order: By Market Cap or Company Size Performance: Year-to-date, Week and Day |  |
|
Get the most comprehensive stock market coverage daily at 12Stocks.com ➞ Best Stocks Today ➞ Best Stocks Weekly ➞ Best Stocks Year-to-Date ➞ Best Stocks Trends ➞  Best Stocks Today 12Stocks.com Best Nasdaq Stocks ➞ Best S&P 500 Stocks ➞ Best Tech Stocks ➞ Best Biotech Stocks ➞ |
| Detailed Overview of S&P 500 Stocks |
| S&P 500 Technical Overview, Leaders & Laggards, Top S&P 500 ETF Funds & Detailed S&P 500 Stocks List, Charts, Trends & More |
| S&P 500: Technical Analysis, Trends & YTD Performance | |
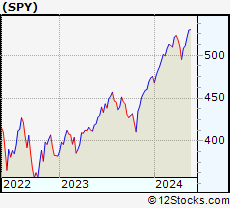
| S&P 500 index as represented by
SPY, an exchange-traded fund [ETF], holds basket of five hundred (mostly largecap) stocks from across all major sectors of the US stock market. The S&P 500 index (contains stocks like Apple and Exxon) is up by 6.25% and is currently outperforming the overall market by 0.63% year-to-date. Below is a quick view of technical charts and trends: | |
 SPY Weekly Chart |
|
| Long Term Trend: Not Good | |
| Medium Term Trend: Not Good | |
 SPY Daily Chart |
|
| Short Term Trend: Deteriorating | |
| Overall Trend Score: 30 | |
| YTD Performance: 6.25% | |
| **Trend Scores & Views Are Only For Educational Purposes And Not For Investing | |
| 12Stocks.com: Investing in S&P 500 Index using Exchange Traded Funds | |
|
The following table shows list of key exchange traded funds (ETF) that
help investors track S&P 500 index. The following list also includes leveraged ETF funds that track twice or thrice the daily returns of S&P 500 indices. Short or inverse ETF funds move in the opposite direction to the index they track and are useful during market pullbacks or during bear markets. Quick View: Move mouse or cursor over ETF symbol (ticker) to view short-term technical chart and over ETF name to view long term chart. Click on ticker or stock name for detailed view. Click on to add stock symbol to your watchlist and to view watchlist. |
12Stocks.com List of ETFs that track S&P 500 Index
| Ticker | ETF Name | Watchlist | Recent Price | Smart Investing & Trading Score | Change % | Week % | Year-to-date % |
| SPY | SPDR S&P 500 ETF | | 505.03 | 30 | 0.94 | -0.64 | 6.25% |
| IVV | iShares Core S&P 500 ETF | | 507.46 | 17 | 0.91 | -0.65 | 6.25% |
| VOO | Vanguard 500 ETF | | 464.22 | 17 | 0.93 | -0.64 | 6.28% |
| OEF | iShares S&P 100 | | 240.23 | 30 | 1.16 | -0.55 | 7.54% |
| SSO | ProShares Ultra S&P500 | | 71.66 | 17 | 1.80 | -1.44 | 10.13% |
| UPRO | ProShares UltraPro S&P500 | | 62.37 | 17 | 2.75 | -2.27 | 13.94% |
| SPXL | Direxion Daily S&P500 Bull 3X ETF | | 118.44 | 17 | 2.68 | -2.23 | 13.9% |
| SH | ProShares Short S&P500 | | 12.38 | 70 | -0.88 | 0.81 | -4.7% |
| SDS | ProShares UltraShort S&P500 | | 26.90 | 83 | -1.82 | 1.39 | -10.09% |
| SPXU | ProShares UltraPro Short S&P500 | | 36.26 | 78 | -2.55 | 2.14 | -15.67% |
| SPXS | Direxion Daily S&P 500 Bear 3X ETF | | 9.81 | 78 | -2.58 | 2.08 | -15.06% |
| 12Stocks.com: Charts, Trends, Fundamental Data and Performances of S&P 500 Stocks | |
|
We now take in-depth look at all S&P 500 stocks including charts, multi-period performances and overall trends (as measured by Smart Investing & Trading Score). One can sort S&P 500 stocks (click link to choose) by Daily, Weekly and by Year-to-Date performances. Also, one can sort by size of the company or by market capitalization. |
| Select Your Default Chart Type: | |||||
| |||||
| Click on stock symbol or name for detailed view. Click on to add stock symbol to your watchlist and to view watchlist. Quick View: Move mouse or cursor over "Daily" to quickly view daily technical stock chart and over "Weekly" to view weekly technical stock chart. | |||||

 | LMT Lockheed Martin Corporation |
| Sector: Industrials | |
| SubSector: Aerospace/Defense Products & Services | |
| MarketCap: 94116.4 Millions | |
| Recent Price: 463.20 Smart Investing & Trading Score: 63 | |
| Day Percent Change: 0.32% Day Change: 1.47 | |
| Week Change: 0.41% Year-to-date Change: 2.2% | |
| LMT Links: Profile News Message Board | |
| Charts:- Daily , Weekly | |
| Add LMT to Watchlist: View: Get LMT Trend Analysis ➞ | |
 | DHR Danaher Corporation |
| Sector: Industrials | |
| SubSector: Diversified Machinery | |
| MarketCap: 93210.3 Millions | |
| Recent Price: 246.84 Smart Investing & Trading Score: 42 | |
| Day Percent Change: -0.02% Day Change: -0.05 | |
| Week Change: 0.11% Year-to-date Change: 6.7% | |
| DHR Links: Profile News Message Board | |
| Charts:- Daily , Weekly | |
| Add DHR to Watchlist: View: Get DHR Trend Analysis ➞ | |
 | HON Honeywell International Inc. |
| Sector: Industrials | |
| SubSector: Diversified Machinery | |
| MarketCap: 91189.1 Millions | |
| Recent Price: 193.64 Smart Investing & Trading Score: 27 | |
| Day Percent Change: -0.85% Day Change: -1.66 | |
| Week Change: 0.1% Year-to-date Change: -7.7% | |
| HON Links: Profile News Message Board | |
| Charts:- Daily , Weekly | |
| Add HON to Watchlist: View: Get HON Trend Analysis ➞ | |
 | MMM 3M Company |
| Sector: Industrials | |
| SubSector: Diversified Machinery | |
| MarketCap: 79237.7 Millions | |
| Recent Price: 96.81 Smart Investing & Trading Score: 88 | |
| Day Percent Change: -1.66% Day Change: -1.63 | |
| Week Change: 5.42% Year-to-date Change: -11.4% | |
| MMM Links: Profile News Message Board | |
| Charts:- Daily , Weekly | |
| Add MMM to Watchlist: View: Get MMM Trend Analysis ➞ | |
 | BA The Boeing Company |
| Sector: Industrials | |
| SubSector: Aerospace/Defense Products & Services | |
| MarketCap: 65336.4 Millions | |
| Recent Price: 178.85 Smart Investing & Trading Score: 64 | |
| Day Percent Change: 4.31% Day Change: 7.39 | |
| Week Change: 6.95% Year-to-date Change: -31.4% | |
| BA Links: Profile News Message Board | |
| Charts:- Daily , Weekly | |
| Add BA to Watchlist: View: Get BA Trend Analysis ➞ | |
 | GE General Electric Company |
| Sector: Industrials | |
| SubSector: Diversified Machinery | |
| MarketCap: 64710.6 Millions | |
| Recent Price: 162.64 Smart Investing & Trading Score: 53 | |
| Day Percent Change: 1.84% Day Change: 2.94 | |
| Week Change: 0.18% Year-to-date Change: 27.4% | |
| GE Links: Profile News Message Board | |
| Charts:- Daily , Weekly | |
| Add GE to Watchlist: View: Get GE Trend Analysis ➞ | |
 | CAT Caterpillar Inc. |
| Sector: Industrials | |
| SubSector: Farm & Construction Machinery | |
| MarketCap: 58636 Millions | |
| Recent Price: 335.44 Smart Investing & Trading Score: 23 | |
| Day Percent Change: 1.32% Day Change: 4.37 | |
| Week Change: -2.31% Year-to-date Change: 13.5% | |
| CAT Links: Profile News Message Board | |
| Charts:- Daily , Weekly | |
| Add CAT to Watchlist: View: Get CAT Trend Analysis ➞ | |
 | NOC Northrop Grumman Corporation |
| Sector: Industrials | |
| SubSector: Aerospace/Defense - Major Diversified | |
| MarketCap: 52094.9 Millions | |
| Recent Price: 475.00 Smart Investing & Trading Score: 68 | |
| Day Percent Change: -2.34% Day Change: -11.37 | |
| Week Change: -1.13% Year-to-date Change: 1.5% | |
| NOC Links: Profile News Message Board | |
| Charts:- Daily , Weekly | |
| Add NOC to Watchlist: View: Get NOC Trend Analysis ➞ | |
 | WM Waste Management, Inc. |
| Sector: Industrials | |
| SubSector: Waste Management | |
| MarketCap: 46977.4 Millions | |
| Recent Price: 207.16 Smart Investing & Trading Score: 28 | |
| Day Percent Change: 0.19% Day Change: 0.40 | |
| Week Change: -1.4% Year-to-date Change: 15.7% | |
| WM Links: Profile News Message Board | |
| Charts:- Daily , Weekly | |
| Add WM to Watchlist: View: Get WM Trend Analysis ➞ | |
 | ITW Illinois Tool Works Inc. |
| Sector: Industrials | |
| SubSector: Diversified Machinery | |
| MarketCap: 45324.8 Millions | |
| Recent Price: 242.04 Smart Investing & Trading Score: 10 | |
| Day Percent Change: -0.09% Day Change: -0.23 | |
| Week Change: -2.51% Year-to-date Change: -7.6% | |
| ITW Links: Profile News Message Board | |
| Charts:- Daily , Weekly | |
| Add ITW to Watchlist: View: Get ITW Trend Analysis ➞ | |
 | DE Deere & Company |
| Sector: Industrials | |
| SubSector: Farm & Construction Machinery | |
| MarketCap: 39168.7 Millions | |
| Recent Price: 395.96 Smart Investing & Trading Score: 61 | |
| Day Percent Change: 2.18% Day Change: 8.46 | |
| Week Change: 0.67% Year-to-date Change: -1.0% | |
| DE Links: Profile News Message Board | |
| Charts:- Daily , Weekly | |
| Add DE to Watchlist: View: Get DE Trend Analysis ➞ | |
 | GD General Dynamics Corporation |
| Sector: Industrials | |
| SubSector: Aerospace/Defense Products & Services | |
| MarketCap: 37063.8 Millions | |
| Recent Price: 287.36 Smart Investing & Trading Score: 56 | |
| Day Percent Change: 0.29% Day Change: 0.83 | |
| Week Change: 1.04% Year-to-date Change: 10.7% | |
| GD Links: Profile News Message Board | |
| Charts:- Daily , Weekly | |
| Add GD to Watchlist: View: Get GD Trend Analysis ➞ | |
 | ROP Roper Technologies, Inc. |
| Sector: Industrials | |
| SubSector: Diversified Machinery | |
| MarketCap: 33366.2 Millions | |
| Recent Price: 510.82 Smart Investing & Trading Score: 8 | |
| Day Percent Change: -0.77% Day Change: -3.94 | |
| Week Change: -3.03% Year-to-date Change: -6.3% | |
| ROP Links: Profile News Message Board | |
| Charts:- Daily , Weekly | |
| Add ROP to Watchlist: View: Get ROP Trend Analysis ➞ | |
 | CARR Carrier Global Corporation |
| Sector: Industrials | |
| SubSector: Building Products & Equipment | |
| MarketCap: 32547 Millions | |
| Recent Price: 60.94 Smart Investing & Trading Score: 63 | |
| Day Percent Change: -0.29% Day Change: -0.18 | |
| Week Change: 0.73% Year-to-date Change: 6.1% | |
| CARR Links: Profile News Message Board | |
| Charts:- Daily , Weekly | |
| Add CARR to Watchlist: View: Get CARR Trend Analysis ➞ | |
 | EMR Emerson Electric Co. |
| Sector: Industrials | |
| SubSector: Industrial Electrical Equipment | |
| MarketCap: 30457.9 Millions | |
| Recent Price: 106.41 Smart Investing & Trading Score: 13 | |
| Day Percent Change: -0.04% Day Change: -0.04 | |
| Week Change: -3.17% Year-to-date Change: 9.3% | |
| EMR Links: Profile News Message Board | |
| Charts:- Daily , Weekly | |
| Add EMR to Watchlist: View: Get EMR Trend Analysis ➞ | |
 | ETN Eaton Corporation plc |
| Sector: Industrials | |
| SubSector: Diversified Machinery | |
| MarketCap: 29829.4 Millions | |
| Recent Price: 315.27 Smart Investing & Trading Score: 38 | |
| Day Percent Change: 1.04% Day Change: 3.24 | |
| Week Change: -2.78% Year-to-date Change: 30.9% | |
| ETN Links: Profile News Message Board | |
| Charts:- Daily , Weekly | |
| Add ETN to Watchlist: View: Get ETN Trend Analysis ➞ | |
 | OTIS Otis Worldwide Corporation |
| Sector: Industrials | |
| SubSector: Specialty Industrial Machinery | |
| MarketCap: 27727 Millions | |
| Recent Price: 91.77 Smart Investing & Trading Score: 10 | |
| Day Percent Change: 0.37% Day Change: 0.34 | |
| Week Change: -0.47% Year-to-date Change: 2.6% | |
| OTIS Links: Profile News Message Board | |
| Charts:- Daily , Weekly | |
| Add OTIS to Watchlist: View: Get OTIS Trend Analysis ➞ | |
 | RSG Republic Services, Inc. |
| Sector: Industrials | |
| SubSector: Waste Management | |
| MarketCap: 26178.6 Millions | |
| Recent Price: 186.44 Smart Investing & Trading Score: 41 | |
| Day Percent Change: 0.24% Day Change: 0.44 | |
| Week Change: -2.86% Year-to-date Change: 13.1% | |
| RSG Links: Profile News Message Board | |
| Charts:- Daily , Weekly | |
| Add RSG to Watchlist: View: Get RSG Trend Analysis ➞ | |
 | CMI Cummins Inc. |
| Sector: Industrials | |
| SubSector: Diversified Machinery | |
| MarketCap: 19127.1 Millions | |
| Recent Price: 280.29 Smart Investing & Trading Score: 31 | |
| Day Percent Change: -1.26% Day Change: -3.58 | |
| Week Change: -3.73% Year-to-date Change: 17.0% | |
| CMI Links: Profile News Message Board | |
| Charts:- Daily , Weekly | |
| Add CMI to Watchlist: View: Get CMI Trend Analysis ➞ | |
 | TDG TransDigm Group Incorporated |
| Sector: Industrials | |
| SubSector: Aerospace/Defense Products & Services | |
| MarketCap: 18441 Millions | |
| Recent Price: 1271.78 Smart Investing & Trading Score: 95 | |
| Day Percent Change: 1.80% Day Change: 22.46 | |
| Week Change: 1% Year-to-date Change: 25.7% | |
| TDG Links: Profile News Message Board | |
| Charts:- Daily , Weekly | |
| Add TDG to Watchlist: View: Get TDG Trend Analysis ➞ | |
 | AME AMETEK, Inc. |
| Sector: Industrials | |
| SubSector: Diversified Machinery | |
| MarketCap: 16611.8 Millions | |
| Recent Price: 163.34 Smart Investing & Trading Score: 0 | |
| Day Percent Change: -6.12% Day Change: -10.64 | |
| Week Change: -7.98% Year-to-date Change: -0.9% | |
| AME Links: Profile News Message Board | |
| Charts:- Daily , Weekly | |
| Add AME to Watchlist: View: Get AME Trend Analysis ➞ | |
 | ROK Rockwell Automation, Inc. |
| Sector: Industrials | |
| SubSector: Diversified Machinery | |
| MarketCap: 15666.1 Millions | |
| Recent Price: 270.04 Smart Investing & Trading Score: 0 | |
| Day Percent Change: 0.11% Day Change: 0.29 | |
| Week Change: -3.6% Year-to-date Change: -13.0% | |
| ROK Links: Profile News Message Board | |
| Charts:- Daily , Weekly | |
| Add ROK to Watchlist: View: Get ROK Trend Analysis ➞ | |
 | PH Parker-Hannifin Corporation |
| Sector: Industrials | |
| SubSector: Industrial Equipment & Components | |
| MarketCap: 14888.9 Millions | |
| Recent Price: 530.68 Smart Investing & Trading Score: 0 | |
| Day Percent Change: -2.26% Day Change: -12.28 | |
| Week Change: -4.15% Year-to-date Change: 15.2% | |
| PH Links: Profile News Message Board | |
| Charts:- Daily , Weekly | |
| Add PH to Watchlist: View: Get PH Trend Analysis ➞ | |
 | SWK Stanley Black & Decker, Inc. |
| Sector: Industrials | |
| SubSector: Machine Tools & Accessories | |
| MarketCap: 14274.8 Millions | |
| Recent Price: 84.99 Smart Investing & Trading Score: 0 | |
| Day Percent Change: -7.52% Day Change: -6.91 | |
| Week Change: -5.26% Year-to-date Change: -13.4% | |
| SWK Links: Profile News Message Board | |
| Charts:- Daily , Weekly | |
| Add SWK to Watchlist: View: Get SWK Trend Analysis ➞ | |
 | DHI D.R. Horton, Inc. |
| Sector: Industrials | |
| SubSector: Residential Construction | |
| MarketCap: 13372.6 Millions | |
| Recent Price: 145.46 Smart Investing & Trading Score: 18 | |
| Day Percent Change: 2.09% Day Change: 2.98 | |
| Week Change: 0.09% Year-to-date Change: -4.3% | |
| DHI Links: Profile News Message Board | |
| Charts:- Daily , Weekly | |
| Add DHI to Watchlist: View: Get DHI Trend Analysis ➞ | |
| For tabular summary view of above stock list: Summary View ➞ 0 - 25 , 25 - 50 | ||
| Click To Change The Sort Order: By Market Cap or Company Size Performance: Year-to-date, Week and Day | |
| Select Chart Type: | ||
|
Best Stocks Today 12Stocks.com |
© 2024 12Stocks.com Terms & Conditions Privacy Contact Us
All Information Provided Only For Education And Not To Be Used For Investing or Trading. See Terms & Conditions


One More Thing ... Get Best Stocks Delivered Daily!
Never Ever Miss A Move With Our Top Ten Stocks Lists
Find Best Stocks In Any Market - Bull or Bear Market
Take A Peek At Our Top Ten Stocks Lists: Daily, Weekly, Year-to-Date & Top Trends
Find Best Stocks In Any Market - Bull or Bear Market
Take A Peek At Our Top Ten Stocks Lists: Daily, Weekly, Year-to-Date & Top Trends
S&P 500 Stocks With Best Up Trends [0-bearish to 100-bullish]: C.H. Robinson[100], QUALCOMM [100], BorgWarner [100], Kellogg [100], WestRock [100], Ventas [100], AES [100], Xylem [100], Flavors[100], Bio-Techne [100], Becton Dickinson[100]
Best S&P 500 Stocks Year-to-Date:
NVIDIA [73.29%], Constellation [58.62%], NRG [45.32%], Chipotle Mexican[37.39%], DaVita [35.78%], Western Digital[33.13%], Leidos Holdings[31.8%], Micron [31.63%], Progressive [31.23%], Eaton [30.92%], Targa Resources[30.07%] Best S&P 500 Stocks This Week:
Bio-Techne [18.01%], Moderna [16.32%], C.H. Robinson[15.25%], Garmin [15.25%], Amcor [10.03%], AES [9.99%], Leidos Holdings[9.44%], Aptiv [9.24%], Pfizer [9.06%], QUALCOMM [8.72%], WestRock [8.17%] Best S&P 500 Stocks Daily:
Moderna [12.68%], C.H. Robinson[12.26%], Aptiv [11.53%], QUALCOMM [9.74%], Monolithic Power[9.24%], BorgWarner [8.40%], Kellogg [7.55%], WestRock [6.70%], Estee Lauder[5.94%], Corteva [5.69%], Zoetis [5.51%]