
 Login Sign Up


| |||||
 |  | ||||

| 12Stocks.com Market Intelligence |
Best Healthcare Stocks
 | "Discover best trending healthcare stocks with 12Stocks.com." |
| - Subu Vdaygiri, Founder, 12Stocks.com |
| In a hurry? Healthcare Stocks Lists: Performance Trends Table, Stock Charts
Sort Healthcare stocks: Daily, Weekly, Year-to-Date, Market Cap & Trends. Filter Healthcare stocks list by size:All Healthcare Large Mid-Range Small |
| 12Stocks.com Healthcare Stocks Performances & Trends Daily | |||||||||
|
|  The overall Smart Investing & Trading Score is 38 (0-bearish to 100-bullish) which puts Healthcare sector in short term bearish to neutral trend. The Smart Investing & Trading Score from previous trading session is 52 and hence a deterioration of trend.
| ||||||||
Here are the Smart Investing & Trading Scores of the most requested Healthcare stocks at 12Stocks.com (click stock name for detailed review):
|


| 12Stocks.com: Investing in Healthcare sector with Stocks | |
|
The following table helps investors and traders sort through current performance and trends (as measured by Smart Investing & Trading Score) of various
stocks in the Healthcare sector. Quick View: Move mouse or cursor over stock symbol (ticker) to view short-term Technical chart and over stock name to view long term chart. Click on  to add stock symbol to your watchlist and to add stock symbol to your watchlist and  to view watchlist. Click on any ticker or stock name for detailed market intelligence report for that stock. to view watchlist. Click on any ticker or stock name for detailed market intelligence report for that stock. |
12Stocks.com Performance of Stocks in Healthcare Sector
| Ticker | Stock Name | Watchlist | Category | Recent Price | Smart Investing & Trading Score | Change % | YTD Change% |
| ABBV | AbbVie |   | Pharmaceutical | 167.29 | 51 | -0.30 | 7.95% |
| ADMA | ADMA Biologics | | Biotechnology | 6.44 | 83 | -0.31 | 42.48% |
| PEN | Penumbra | | Instruments | 205.50 | 25 | -0.32 | -18.30% |
| OVID | Ovid | | Biotechnology | 3.14 | 17 | -0.32 | -2.48% |
| TBPH | Theravance Biopharma | | Biotechnology | 9.14 | 7 | -0.33 | -18.68% |
| HLTH | Nobilis Health | | Hospitals | 0.15 | 35 | -0.34 | -10.46% |
| INO | Inovio | | Biotechnology | 10.13 | 61 | -0.34 | NA |
| BTMD | biote | | Medical Care Facilities | 5.58 | 61 | -0.36 | 12.50% |
| NHC | National | | Long-Term | 90.77 | 19 | -0.40 | -1.79% |
| CLLS | Cellectis S.A | | Biotechnology | 2.49 | 15 | -0.40 | -19.16% |
| IPHA | Innate Pharma | | Biotechnology | 2.46 | 10 | -0.40 | -12.14% |
| AMPH | Amphastar | | Pharmaceutical | 40.83 | 42 | -0.41 | -33.99% |
| OCS | Oculis Holding | | Biotechnology | 11.95 | 47 | -0.42 | 7.65% |
| UTHR | United | | Biotechnology | 235.95 | 73 | -0.44 | 7.30% |
| QURE | uniQure N.V | | Biotechnology | 4.54 | 20 | -0.44 | -32.94% |
| BHVN | Biohaven | | Biotechnology | 38.54 | 10 | -0.46 | -9.95% |
| UHS | Universal Health | | Hospitals | 165.10 | 65 | -0.48 | 8.30% |
| GLPG | Galapagos NV | | Biotechnology | 28.63 | 20 | -0.49 | -29.57% |
| IRON | Disc Medicine | | Biotechnology | 26.52 | 10 | -0.49 | -54.28% |
| ISRG | Intuitive Surgical | | Instruments | 373.12 | 25 | -0.50 | 10.60% |
| MASI | Masimo | | Instruments | 135.24 | 61 | -0.50 | 15.38% |
| TGTX | TG | | Biotechnology | 13.91 | 35 | -0.50 | -18.56% |
| NATR | Nature s | | Pharmaceutical | 19.42 | 63 | -0.51 | 12.32% |
| CGEN | Compugen | | Biotechnology | 1.90 | 25 | -0.52 | -4.04% |
| NVCT | Nuvectis Pharma | | Biotechnology | 6.68 | 17 | -0.52 | -19.23% |
| For chart view version of above stock list: Chart View ➞ 0 - 25 , 25 - 50 , 50 - 75 , 75 - 100 , 100 - 125 , 125 - 150 , 150 - 175 , 175 - 200 , 200 - 225 , 225 - 250 , 250 - 275 , 275 - 300 , 300 - 325 , 325 - 350 , 350 - 375 , 375 - 400 , 400 - 425 , 425 - 450 , 450 - 475 , 475 - 500 , 500 - 525 , 525 - 550 , 550 - 575 , 575 - 600 , 600 - 625 , 625 - 650 , 650 - 675 , 675 - 700 , 700 - 725 | ||
 | Click To Change The Sort Order: By Market Cap or Company Size Performance: Year-to-date, Week and Day |  |
|
Get the most comprehensive stock market coverage daily at 12Stocks.com ➞ Best Stocks Today ➞ Best Stocks Weekly ➞ Best Stocks Year-to-Date ➞ Best Stocks Trends ➞  Best Stocks Today 12Stocks.com Best Nasdaq Stocks ➞ Best S&P 500 Stocks ➞ Best Tech Stocks ➞ Best Biotech Stocks ➞ |
| Detailed Overview of Healthcare Stocks |
| Healthcare Technical Overview, Leaders & Laggards, Top Healthcare ETF Funds & Detailed Healthcare Stocks List, Charts, Trends & More |
| Healthcare Sector: Technical Analysis, Trends & YTD Performance | |
| Healthcare sector is composed of stocks
from pharmaceutical, biotech, diagnostics labs, insurance providers
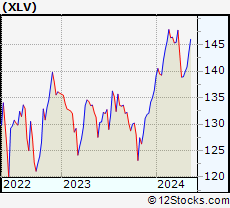
and healthcare services. Healthcare sector, as represented by XLV, an exchange-traded fund [ETF] that holds basket of Healthcare stocks (e.g, Merck, Amgen) is up by 2.6% and is currently underperforming the overall market by -2.56% year-to-date. Below is a quick view of Technical charts and trends: |
|
 XLV Weekly Chart |
|
| Long Term Trend: Not Good | |
| Medium Term Trend: Not Good | |
 XLV Daily Chart |
|
| Short Term Trend: Very Good | |
| Overall Trend Score: 38 | |
| YTD Performance: 2.6% | |
| **Trend Scores & Views Are Only For Educational Purposes And Not For Investing | |
| 12Stocks.com: Top Performing Healthcare Sector Stocks | ||||||||||||||||||||||||||||||||||||||||||||||||
 The top performing Healthcare sector stocks year to date are
Now, more recently, over last week, the top performing Healthcare sector stocks on the move are


|
||||||||||||||||||||||||||||||||||||||||||||||||
| 12Stocks.com: Investing in Healthcare Sector using Exchange Traded Funds | |
|
The following table shows list of key exchange traded funds (ETF) that
help investors track Healthcare Index. For detailed view, check out our ETF Funds section of our website. Quick View: Move mouse or cursor over ETF symbol (ticker) to view short-term Technical chart and over ETF name to view long term chart. Click on ticker or stock name for detailed view. Click on to add stock symbol to your watchlist and to view watchlist. |
12Stocks.com List of ETFs that track Healthcare Index
| Ticker | ETF Name | Watchlist | Recent Price | Smart Investing & Trading Score | Change % | Week % | Year-to-date % |
| XLV | Health Care | | 139.92 | 38 | -0.67 | 0.7 | 2.6% |
| XBI | Biotech | | 82.22 | 25 | -2.05 | -0.74 | -7.92% |
| IBB | Biotechnology | | 125.67 | 18 | -1.64 | 0.76 | -7.49% |
| BBH | Biotech | | 154.61 | 49 | -1.73 | 1.48 | -6.47% |
| VHT | Health Care | | 255.24 | 45 | -0.79 | 0.75 | 1.81% |
| IYH | Healthcare | | 58.68 | 45 | -0.69 | 0.89 | 2.5% |
| IHF | Healthcare Providers | | 52.11 | 55 | -0.29 | -0.19 | -0.76% |
| IHI | Medical Devices | | 55.27 | 43 | -0.66 | 1.67 | 2.41% |
| BIB | Biotechnology | | 48.83 | 32 | -2.69 | 1.31 | -14.41% |
| BIS | Short Biotech | | 20.59 | 61 | 2.49 | -1.46 | 13.95% |
| XHE | Health Care Equipment | | 81.77 | 28 | -1.73 | 0.62 | -2.96% |
| CURE | Healthcare Bull 3X | | 105.32 | 25 | -2.35 | 1.92 | 3.52% |
| LABU | Biotech Bull 3X | | 83.72 | 25 | -6.35 | -2.71 | -31.36% |
| LABD | Biotech Bear 3X | | 11.03 | 75 | 6.36 | 2.13 | 13.83% |
| PSCH | SmallCap Health Care | | 40.31 | 35 | -1.98 | 0.32 | -5.82% |
| XHS | Health Care Services | | 87.68 | 68 | -1.15 | 0.68 | -1.43% |
| PTH | DWA Healthcare Momentum | | 39.60 | 46 | -0.08 | 0.18 | 1.18% |
| BTEC | Principal Healthcare Innovators | | 34.21 | 32 | 0.02 | 1.04 | -5.83% |
| RXL | Health Care | | 94.52 | 17 | -1.55 | 1.39 | 3.41% |
| RXD | Short Health Care | | 11.46 | 71 | 0.98 | -1.59 | -3.94% |
| 12Stocks.com: Charts, Trends, Fundamental Data and Performances of Healthcare Stocks | |
|
We now take in-depth look at all Healthcare stocks including charts, multi-period performances and overall trends (as measured by Smart Investing & Trading Score). One can sort Healthcare stocks (click link to choose) by Daily, Weekly and by Year-to-Date performances. Also, one can sort by size of the company or by market capitalization. |
| Select Your Default Chart Type: | |||||
| |||||
| Click on stock symbol or name for detailed view. Click on to add stock symbol to your watchlist and to view watchlist. Quick View: Move mouse or cursor over "Daily" to quickly view daily Technical stock chart and over "Weekly" to view weekly Technical stock chart. | |||||

 | ABBV AbbVie Inc. |
| Sector: Health Care | |
| SubSector: Drug Manufacturers - Major | |
| MarketCap: 110080 Millions | |
| Recent Price: 167.29 Smart Investing & Trading Score: 51 | |
| Day Percent Change: -0.30% Day Change: -0.51 | |
| Week Change: 0.53% Year-to-date Change: 8.0% | |
| ABBV Links: Profile News Message Board | |
| Charts:- Daily , Weekly | |
| Add ABBV to Watchlist: View: Get Complete ABBV Trend Analysis ➞ | |
 | ADMA ADMA Biologics, Inc. |
| Sector: Health Care | |
| SubSector: Biotechnology | |
| MarketCap: 204.985 Millions | |
| Recent Price: 6.44 Smart Investing & Trading Score: 83 | |
| Day Percent Change: -0.31% Day Change: -0.02 | |
| Week Change: 2.71% Year-to-date Change: 42.5% | |
| ADMA Links: Profile News Message Board | |
| Charts:- Daily , Weekly | |
| Add ADMA to Watchlist: View: Get Complete ADMA Trend Analysis ➞ | |
 | PEN Penumbra, Inc. |
| Sector: Health Care | |
| SubSector: Medical Instruments & Supplies | |
| MarketCap: 4854.1 Millions | |
| Recent Price: 205.50 Smart Investing & Trading Score: 25 | |
| Day Percent Change: -0.32% Day Change: -0.65 | |
| Week Change: 1.37% Year-to-date Change: -18.3% | |
| PEN Links: Profile News Message Board | |
| Charts:- Daily , Weekly | |
| Add PEN to Watchlist: View: Get Complete PEN Trend Analysis ➞ | |
 | OVID Ovid Therapeutics Inc. |
| Sector: Health Care | |
| SubSector: Biotechnology | |
| MarketCap: 130.385 Millions | |
| Recent Price: 3.14 Smart Investing & Trading Score: 17 | |
| Day Percent Change: -0.32% Day Change: -0.01 | |
| Week Change: -3.24% Year-to-date Change: -2.5% | |
| OVID Links: Profile News Message Board | |
| Charts:- Daily , Weekly | |
| Add OVID to Watchlist: View: Get Complete OVID Trend Analysis ➞ | |
 | TBPH Theravance Biopharma, Inc. |
| Sector: Health Care | |
| SubSector: Biotechnology | |
| MarketCap: 1404.55 Millions | |
| Recent Price: 9.14 Smart Investing & Trading Score: 7 | |
| Day Percent Change: -0.33% Day Change: -0.03 | |
| Week Change: -2.14% Year-to-date Change: -18.7% | |
| TBPH Links: Profile News Message Board | |
| Charts:- Daily , Weekly | |
| Add TBPH to Watchlist: View: Get Complete TBPH Trend Analysis ➞ | |
 | HLTH Nobilis Health Corp. |
| Sector: Health Care | |
| SubSector: Hospitals | |
| MarketCap: 124.22 Millions | |
| Recent Price: 0.15 Smart Investing & Trading Score: 35 | |
| Day Percent Change: -0.34% Day Change: 0.00 | |
| Week Change: 0.28% Year-to-date Change: -10.5% | |
| HLTH Links: Profile News Message Board | |
| Charts:- Daily , Weekly | |
| Add HLTH to Watchlist: View: Get Complete HLTH Trend Analysis ➞ | |
 | INO Inovio Pharmaceuticals, Inc. |
| Sector: Health Care | |
| SubSector: Biotechnology | |
| MarketCap: 876.385 Millions | |
| Recent Price: 10.13 Smart Investing & Trading Score: 61 | |
| Day Percent Change: -0.34% Day Change: -0.04 | |
| Week Change: 4.6% Year-to-date Change: 1,885.3% | |
| INO Links: Profile News Message Board | |
| Charts:- Daily , Weekly | |
| Add INO to Watchlist: View: Get Complete INO Trend Analysis ➞ | |
 | BTMD biote Corp. |
| Sector: Health Care | |
| SubSector: Medical Care Facilities | |
| MarketCap: 468 Millions | |
| Recent Price: 5.58 Smart Investing & Trading Score: 61 | |
| Day Percent Change: -0.36% Day Change: -0.02 | |
| Week Change: 0.72% Year-to-date Change: 12.5% | |
| BTMD Links: Profile News Message Board | |
| Charts:- Daily , Weekly | |
| Add BTMD to Watchlist: View: Get Complete BTMD Trend Analysis ➞ | |
 | NHC National HealthCare Corporation |
| Sector: Health Care | |
| SubSector: Long-Term Care Facilities | |
| MarketCap: 1164.86 Millions | |
| Recent Price: 90.77 Smart Investing & Trading Score: 19 | |
| Day Percent Change: -0.40% Day Change: -0.36 | |
| Week Change: 0.17% Year-to-date Change: -1.8% | |
| NHC Links: Profile News Message Board | |
| Charts:- Daily , Weekly | |
| Add NHC to Watchlist: View: Get Complete NHC Trend Analysis ➞ | |
 | CLLS Cellectis S.A. |
| Sector: Health Care | |
| SubSector: Biotechnology | |
| MarketCap: 398.685 Millions | |
| Recent Price: 2.49 Smart Investing & Trading Score: 15 | |
| Day Percent Change: -0.40% Day Change: -0.01 | |
| Week Change: -2.35% Year-to-date Change: -19.2% | |
| CLLS Links: Profile News Message Board | |
| Charts:- Daily , Weekly | |
| Add CLLS to Watchlist: View: Get Complete CLLS Trend Analysis ➞ | |
 | IPHA Innate Pharma S.A. |
| Sector: Health Care | |
| SubSector: Biotechnology | |
| MarketCap: 309.485 Millions | |
| Recent Price: 2.46 Smart Investing & Trading Score: 10 | |
| Day Percent Change: -0.40% Day Change: -0.01 | |
| Week Change: -0.81% Year-to-date Change: -12.1% | |
| IPHA Links: Profile News Message Board | |
| Charts:- Daily , Weekly | |
| Add IPHA to Watchlist: View: Get Complete IPHA Trend Analysis ➞ | |
 | AMPH Amphastar Pharmaceuticals, Inc. |
| Sector: Health Care | |
| SubSector: Drug Manufacturers - Other | |
| MarketCap: 655.533 Millions | |
| Recent Price: 40.83 Smart Investing & Trading Score: 42 | |
| Day Percent Change: -0.41% Day Change: -0.17 | |
| Week Change: 2.05% Year-to-date Change: -34.0% | |
| AMPH Links: Profile News Message Board | |
| Charts:- Daily , Weekly | |
| Add AMPH to Watchlist: View: Get Complete AMPH Trend Analysis ➞ | |
 | OCS Oculis Holding AG |
| Sector: Health Care | |
| SubSector: Biotechnology | |
| MarketCap: 460 Millions | |
| Recent Price: 11.95 Smart Investing & Trading Score: 47 | |
| Day Percent Change: -0.42% Day Change: -0.05 | |
| Week Change: 1.44% Year-to-date Change: 7.7% | |
| OCS Links: Profile News Message Board | |
| Charts:- Daily , Weekly | |
| Add OCS to Watchlist: View: Get Complete OCS Trend Analysis ➞ | |
 | UTHR United Therapeutics Corporation |
| Sector: Health Care | |
| SubSector: Biotechnology | |
| MarketCap: 3980.75 Millions | |
| Recent Price: 235.95 Smart Investing & Trading Score: 73 | |
| Day Percent Change: -0.44% Day Change: -1.05 | |
| Week Change: -0.83% Year-to-date Change: 7.3% | |
| UTHR Links: Profile News Message Board | |
| Charts:- Daily , Weekly | |
| Add UTHR to Watchlist: View: Get Complete UTHR Trend Analysis ➞ | |
 | QURE uniQure N.V. |
| Sector: Health Care | |
| SubSector: Biotechnology | |
| MarketCap: 2267.25 Millions | |
| Recent Price: 4.54 Smart Investing & Trading Score: 20 | |
| Day Percent Change: -0.44% Day Change: -0.02 | |
| Week Change: -2.78% Year-to-date Change: -32.9% | |
| QURE Links: Profile News Message Board | |
| Charts:- Daily , Weekly | |
| Add QURE to Watchlist: View: Get Complete QURE Trend Analysis ➞ | |
 | BHVN Biohaven Pharmaceutical Holding Company Ltd. |
| Sector: Health Care | |
| SubSector: Biotechnology | |
| MarketCap: 2024.25 Millions | |
| Recent Price: 38.54 Smart Investing & Trading Score: 10 | |
| Day Percent Change: -0.46% Day Change: -0.18 | |
| Week Change: -1.15% Year-to-date Change: -10.0% | |
| BHVN Links: Profile News Message Board | |
| Charts:- Daily , Weekly | |
| Add BHVN to Watchlist: View: Get Complete BHVN Trend Analysis ➞ | |
 | UHS Universal Health Services, Inc. |
| Sector: Health Care | |
| SubSector: Hospitals | |
| MarketCap: 7217.66 Millions | |
| Recent Price: 165.10 Smart Investing & Trading Score: 65 | |
| Day Percent Change: -0.48% Day Change: -0.80 | |
| Week Change: 4.85% Year-to-date Change: 8.3% | |
| UHS Links: Profile News Message Board | |
| Charts:- Daily , Weekly | |
| Add UHS to Watchlist: View: Get Complete UHS Trend Analysis ➞ | |
 | GLPG Galapagos NV |
| Sector: Health Care | |
| SubSector: Biotechnology | |
| MarketCap: 9541.55 Millions | |
| Recent Price: 28.63 Smart Investing & Trading Score: 20 | |
| Day Percent Change: -0.49% Day Change: -0.14 | |
| Week Change: -1.55% Year-to-date Change: -29.6% | |
| GLPG Links: Profile News Message Board | |
| Charts:- Daily , Weekly | |
| Add GLPG to Watchlist: View: Get Complete GLPG Trend Analysis ➞ | |
 | IRON Disc Medicine Opco Inc |
| Sector: Health Care | |
| SubSector: Biotechnology | |
| MarketCap: 1100 Millions | |
| Recent Price: 26.52 Smart Investing & Trading Score: 10 | |
| Day Percent Change: -0.49% Day Change: -0.13 | |
| Week Change: -7.56% Year-to-date Change: -54.3% | |
| IRON Links: Profile News Message Board | |
| Charts:- Daily , Weekly | |
| Add IRON to Watchlist: View: Get Complete IRON Trend Analysis ➞ | |
 | ISRG Intuitive Surgical, Inc. |
| Sector: Health Care | |
| SubSector: Medical Instruments & Supplies | |
| MarketCap: 50917.5 Millions | |
| Recent Price: 373.12 Smart Investing & Trading Score: 25 | |
| Day Percent Change: -0.50% Day Change: -1.89 | |
| Week Change: 1.85% Year-to-date Change: 10.6% | |
| ISRG Links: Profile News Message Board | |
| Charts:- Daily , Weekly | |
| Add ISRG to Watchlist: View: Get Complete ISRG Trend Analysis ➞ | |
 | MASI Masimo Corporation |
| Sector: Health Care | |
| SubSector: Medical Instruments & Supplies | |
| MarketCap: 8493.2 Millions | |
| Recent Price: 135.24 Smart Investing & Trading Score: 61 | |
| Day Percent Change: -0.50% Day Change: -0.68 | |
| Week Change: 0.35% Year-to-date Change: 15.4% | |
| MASI Links: Profile News Message Board | |
| Charts:- Daily , Weekly | |
| Add MASI to Watchlist: View: Get Complete MASI Trend Analysis ➞ | |
 | TGTX TG Therapeutics, Inc. |
| Sector: Health Care | |
| SubSector: Biotechnology | |
| MarketCap: 1022.85 Millions | |
| Recent Price: 13.91 Smart Investing & Trading Score: 35 | |
| Day Percent Change: -0.50% Day Change: -0.07 | |
| Week Change: 0.94% Year-to-date Change: -18.6% | |
| TGTX Links: Profile News Message Board | |
| Charts:- Daily , Weekly | |
| Add TGTX to Watchlist: View: Get Complete TGTX Trend Analysis ➞ | |
 | NATR Nature s Sunshine Products, Inc. |
| Sector: Health Care | |
| SubSector: Drugs - Generic | |
| MarketCap: 153.285 Millions | |
| Recent Price: 19.42 Smart Investing & Trading Score: 63 | |
| Day Percent Change: -0.51% Day Change: -0.10 | |
| Week Change: 0.67% Year-to-date Change: 12.3% | |
| NATR Links: Profile News Message Board | |
| Charts:- Daily , Weekly | |
| Add NATR to Watchlist: View: Get Complete NATR Trend Analysis ➞ | |
 | CGEN Compugen Ltd. |
| Sector: Health Care | |
| SubSector: Biotechnology | |
| MarketCap: 634.285 Millions | |
| Recent Price: 1.90 Smart Investing & Trading Score: 25 | |
| Day Percent Change: -0.52% Day Change: -0.01 | |
| Week Change: 0% Year-to-date Change: -4.0% | |
| CGEN Links: Profile News Message Board | |
| Charts:- Daily , Weekly | |
| Add CGEN to Watchlist: View: Get Complete CGEN Trend Analysis ➞ | |
 | NVCT Nuvectis Pharma, Inc. |
| Sector: Health Care | |
| SubSector: Biotechnology | |
| MarketCap: 258 Millions | |
| Recent Price: 6.68 Smart Investing & Trading Score: 17 | |
| Day Percent Change: -0.52% Day Change: -0.04 | |
| Week Change: -2.05% Year-to-date Change: -19.2% | |
| NVCT Links: Profile News Message Board | |
| Charts:- Daily , Weekly | |
| Add NVCT to Watchlist: View: Get Complete NVCT Trend Analysis ➞ | |
| For tabular summary view of above stock list: Summary View ➞ 0 - 25 , 25 - 50 , 50 - 75 , 75 - 100 , 100 - 125 , 125 - 150 , 150 - 175 , 175 - 200 , 200 - 225 , 225 - 250 , 250 - 275 , 275 - 300 , 300 - 325 , 325 - 350 , 350 - 375 , 375 - 400 , 400 - 425 , 425 - 450 , 450 - 475 , 475 - 500 , 500 - 525 , 525 - 550 , 550 - 575 , 575 - 600 , 600 - 625 , 625 - 650 , 650 - 675 , 675 - 700 , 700 - 725 | ||
| Click To Change The Sort Order: By Market Cap or Company Size Performance: Year-to-date, Week and Day | |
| Select Chart Type: | ||
|
Best Stocks Today 12Stocks.com |
© 2024 12Stocks.com Terms & Conditions Privacy Contact Us
All Information Provided Only For Education And Not To Be Used For Investing or Trading. See Terms & Conditions


One More Thing ... Get Best Stocks Delivered Daily!
Never Ever Miss A Move With Our Top Ten Stocks Lists
Find Best Stocks In Any Market - Bull or Bear Market
Take A Peek At Our Top Ten Stocks Lists: Daily, Weekly, Year-to-Date & Top Trends
Find Best Stocks In Any Market - Bull or Bear Market
Take A Peek At Our Top Ten Stocks Lists: Daily, Weekly, Year-to-Date & Top Trends
Healthcare Stocks With Best Up Trends [0-bearish to 100-bullish]: AstraZeneca [100], Merck [100], Annovis Bio[100], Haemonetics [100], Tandem Diabetes[100], Boston Scientific[100], Agios [100], Agenus [95], Mesoblast [95], Cullinan Oncology[93], Avadel [93]
Best Healthcare Stocks Year-to-Date:
Pieris [6273.63%], Precision BioSciences[2590.41%], Inovio [1885.29%], Assembly Biosciences[1529.07%], Aurora Cannabis[1311.17%], NuCana [1198.17%], Adverum Biotechnologies[1147.34%], Agenus [902.54%], Affimed N.V[680.8%], CareMax [490.72%], Mesoblast [459.09%] Best Healthcare Stocks This Week:
Pieris [7900%], Agenus [56.31%], VolitionRx [44.5%], ProKidney [32.84%], Seres [32.65%], Annovis Bio[30%], BeyondSpring [26.11%], Cullinan Oncology[22.92%], Pharvaris N.V[18.84%], OptiNose [18.42%], GeneDx [18.15%] Best Healthcare Stocks Daily:
OptiNose [14.56%], Galera [13.74%], Agenus [11.86%], VolitionRx [11.26%], ADiTx [10.57%], Apollomics [9.94%], Pharming [9.06%], Structure [8.13%], Pharvaris N.V[7.91%], ProKidney [7.75%], Community Health[7.26%]