
 Login Sign Up


| |||||
 |  | ||||

| 12Stocks.com Market Intelligence |
Best Healthcare Stocks
 | "Discover best trending healthcare stocks with 12Stocks.com." |
| - Subu Vdaygiri, Founder, 12Stocks.com |
| In a hurry? Healthcare Stocks Lists: Performance Trends Table, Stock Charts
Sort Healthcare stocks: Daily, Weekly, Year-to-Date, Market Cap & Trends. Filter Healthcare stocks list by size:All Healthcare Large Mid-Range Small |
| 12Stocks.com Healthcare Stocks Performances & Trends Daily | |||||||||
|
|  The overall Smart Investing & Trading Score is 52 (0-bearish to 100-bullish) which puts Healthcare sector in short term neutral trend. The Smart Investing & Trading Score from previous trading session is 38 and an improvement of trend continues.
| ||||||||
Here are the Smart Investing & Trading Scores of the most requested Healthcare stocks at 12Stocks.com (click stock name for detailed review):
|


| 12Stocks.com: Investing in Healthcare sector with Stocks | |
|
The following table helps investors and traders sort through current performance and trends (as measured by Smart Investing & Trading Score) of various
stocks in the Healthcare sector. Quick View: Move mouse or cursor over stock symbol (ticker) to view short-term Technical chart and over stock name to view long term chart. Click on  to add stock symbol to your watchlist and to add stock symbol to your watchlist and  to view watchlist. Click on any ticker or stock name for detailed market intelligence report for that stock. to view watchlist. Click on any ticker or stock name for detailed market intelligence report for that stock. |
12Stocks.com Performance of Stocks in Healthcare Sector
| Ticker | Stock Name | Watchlist | Category | Recent Price | Smart Investing & Trading Score | Change % | YTD Change% |
| LIFW | MSP Recovery |   | Health Information | 1.13 | 75 | 0.00 | -51.71% |
| VTYX | Ventyx Biosciences | | Biotechnology | 4.36 | 46 | 0.00 | 76.16% |
| LH | Laboratory | | Laboratories | 207.94 | 49 | -0.01 | -8.51% |
| PODD | Insulet | | Instruments | 167.25 | 60 | -0.01 | -22.92% |
| ARGX | argenx SE | | Biotechnology | 375.00 | 20 | -0.02 | -1.43% |
| BPMC | Blueprint Medicines | | Biotechnology | 92.26 | 95 | -0.03 | 0.02% |
| BCYC | Bicycle | | Biotechnology | 22.67 | 54 | -0.04 | 25.39% |
| NHC | National | | Long-Term | 91.13 | 12 | -0.05 | -1.40% |
| INMD | InMode | | Equipment | 17.36 | 10 | -0.06 | -21.94% |
| TARO | Taro | | Pharmaceutical | 42.20 | 22 | -0.07 | 1.01% |
| INVA | Innoviva | | Biotechnology | 15.16 | 69 | -0.07 | -5.49% |
| REGN | Regeneron | | Biotechnology | 906.54 | 32 | -0.09 | 3.22% |
| FUSN | Fusion | | Biotechnology | 21.40 | 75 | -0.09 | 122.92% |
| CI | Cigna | | Insurance | 352.28 | 61 | -0.10 | 17.64% |
| AMED | Amedisys | | Home Care | 91.05 | 33 | -0.12 | -4.22% |
| ZYME | Zymeworks | | Biotechnology | 8.55 | 10 | -0.12 | -17.71% |
| HCA | HCA | | Hospitals | 319.02 | 68 | -0.13 | 17.86% |
| TNGX | Tango | | Biotechnology | 7.76 | 57 | -0.13 | -21.62% |
| AKYA | Akoya Biosciences | | Instruments | 3.81 | 10 | -0.13 | -21.98% |
| RNA | Avidity Biosciences | | Biotechnology | 25.11 | 90 | -0.14 | 177.71% |
| CTLT | Catalent | | Pharmaceutical | 55.95 | 61 | -0.14 | 24.53% |
| GDRX | GoodRx | | Health Information | 6.96 | 78 | -0.14 | 4.04% |
| GPCR | Structure | | Biotechnology | 36.05 | 20 | -0.14 | -5.32% |
| GKOS | Glaukos | | Instruments | 100.93 | 100 | -0.17 | 26.97% |
| RCKT | Rocket | | Biotechnology | 23.63 | 20 | -0.17 | -21.15% |
| For chart view version of above stock list: Chart View ➞ 0 - 25 , 25 - 50 , 50 - 75 , 75 - 100 , 100 - 125 , 125 - 150 , 150 - 175 , 175 - 200 , 200 - 225 , 225 - 250 , 250 - 275 , 275 - 300 , 300 - 325 , 325 - 350 , 350 - 375 , 375 - 400 , 400 - 425 , 425 - 450 , 450 - 475 , 475 - 500 , 500 - 525 , 525 - 550 , 550 - 575 , 575 - 600 , 600 - 625 , 625 - 650 , 650 - 675 , 675 - 700 , 700 - 725 | ||
 | Click To Change The Sort Order: By Market Cap or Company Size Performance: Year-to-date, Week and Day |  |
|
Get the most comprehensive stock market coverage daily at 12Stocks.com ➞ Best Stocks Today ➞ Best Stocks Weekly ➞ Best Stocks Year-to-Date ➞ Best Stocks Trends ➞  Best Stocks Today 12Stocks.com Best Nasdaq Stocks ➞ Best S&P 500 Stocks ➞ Best Tech Stocks ➞ Best Biotech Stocks ➞ |
| Detailed Overview of Healthcare Stocks |
| Healthcare Technical Overview, Leaders & Laggards, Top Healthcare ETF Funds & Detailed Healthcare Stocks List, Charts, Trends & More |
| Healthcare Sector: Technical Analysis, Trends & YTD Performance | |
| Healthcare sector is composed of stocks
from pharmaceutical, biotech, diagnostics labs, insurance providers
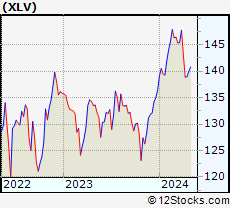
and healthcare services. Healthcare sector, as represented by XLV, an exchange-traded fund [ETF] that holds basket of Healthcare stocks (e.g, Merck, Amgen) is up by 3.28% and is currently underperforming the overall market by -2.38% year-to-date. Below is a quick view of Technical charts and trends: |
|
 XLV Weekly Chart |
|
| Long Term Trend: Good | |
| Medium Term Trend: Not Good | |
 XLV Daily Chart |
|
| Short Term Trend: Very Good | |
| Overall Trend Score: 52 | |
| YTD Performance: 3.28% | |
| **Trend Scores & Views Are Only For Educational Purposes And Not For Investing | |
| 12Stocks.com: Top Performing Healthcare Sector Stocks | ||||||||||||||||||||||||||||||||||||||||||||||||
 The top performing Healthcare sector stocks year to date are
Now, more recently, over last week, the top performing Healthcare sector stocks on the move are


|
||||||||||||||||||||||||||||||||||||||||||||||||
| 12Stocks.com: Investing in Healthcare Sector using Exchange Traded Funds | |
|
The following table shows list of key exchange traded funds (ETF) that
help investors track Healthcare Index. For detailed view, check out our ETF Funds section of our website. Quick View: Move mouse or cursor over ETF symbol (ticker) to view short-term Technical chart and over ETF name to view long term chart. Click on ticker or stock name for detailed view. Click on to add stock symbol to your watchlist and to view watchlist. |
12Stocks.com List of ETFs that track Healthcare Index
| Ticker | ETF Name | Watchlist | Recent Price | Smart Investing & Trading Score | Change % | Week % | Year-to-date % |
| XLV | Health Care | | 140.86 | 52 | -0.31 | 1.37 | 3.28% |
| XBI | Biotech | | 83.94 | 25 | -0.89 | 1.34 | -5.99% |
| IBB | Biotechnology | | 127.76 | 32 | -0.20 | 2.44 | -5.96% |
| BBH | Biotech | | 157.33 | 49 | 0.03 | 3.26 | -4.83% |
| VHT | Health Care | | 257.26 | 30 | -0.22 | 1.55 | 2.62% |
| IYH | Healthcare | | 59.09 | 30 | -0.20 | 1.6 | 3.22% |
| IHF | Healthcare Providers | | 52.26 | 48 | -0.11 | 0.1 | -0.48% |
| IHI | Medical Devices | | 55.64 | 35 | 0.23 | 2.35 | 3.09% |
| BIB | Biotechnology | | 50.18 | 32 | -0.30 | 4.11 | -12.04% |
| BIS | Short Biotech | | 20.09 | 61 | 0.75 | -3.85 | 11.18% |
| XHE | Health Care Equipment | | 83.21 | 35 | 0.24 | 2.39 | -1.25% |
| CURE | Healthcare Bull 3X | | 107.85 | 32 | -0.25 | 4.37 | 6.01% |
| LABU | Biotech Bull 3X | | 89.40 | 25 | -2.80 | 3.89 | -26.7% |
| LABD | Biotech Bear 3X | | 10.37 | 62 | 2.98 | -3.98 | 7.02% |
| PSCH | SmallCap Health Care | | 41.12 | 41 | -0.23 | 2.35 | -3.92% |
| XHS | Health Care Services | | 88.70 | 53 | -0.06 | 1.85 | -0.28% |
| PTH | DWA Healthcare Momentum | | 39.63 | 46 | -1.34 | 0.25 | 1.25% |
| BTEC | Principal Healthcare Innovators | | 34.20 | 18 | -1.73 | 1.02 | -5.85% |
| RXL | Health Care | | 96.00 | 45 | -0.15 | 2.99 | 5.03% |
| RXD | Short Health Care | | 11.34 | 45 | 0.88 | -2.54 | -4.87% |
| 12Stocks.com: Charts, Trends, Fundamental Data and Performances of Healthcare Stocks | |
|
We now take in-depth look at all Healthcare stocks including charts, multi-period performances and overall trends (as measured by Smart Investing & Trading Score). One can sort Healthcare stocks (click link to choose) by Daily, Weekly and by Year-to-Date performances. Also, one can sort by size of the company or by market capitalization. |
| Select Your Default Chart Type: | |||||
| |||||
| Click on stock symbol or name for detailed view. Click on to add stock symbol to your watchlist and to view watchlist. Quick View: Move mouse or cursor over "Daily" to quickly view daily Technical stock chart and over "Weekly" to view weekly Technical stock chart. | |||||

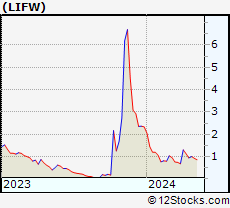 | LIFW MSP Recovery, Inc. |
| Sector: Health Care | |
| SubSector: Health Information Services | |
| MarketCap: 1110 Millions | |
| Recent Price: 1.13 Smart Investing & Trading Score: 75 | |
| Day Percent Change: 0.00% Day Change: 0.00 | |
| Week Change: 19.2% Year-to-date Change: -51.7% | |
| LIFW Links: Profile News Message Board | |
| Charts:- Daily , Weekly | |
| Add LIFW to Watchlist: View: Get Complete LIFW Trend Analysis ➞ | |
 | VTYX Ventyx Biosciences, Inc. |
| Sector: Health Care | |
| SubSector: Biotechnology | |
| MarketCap: 1950 Millions | |
| Recent Price: 4.36 Smart Investing & Trading Score: 46 | |
| Day Percent Change: 0.00% Day Change: 0.00 | |
| Week Change: -2.46% Year-to-date Change: 76.2% | |
| VTYX Links: Profile News Message Board | |
| Charts:- Daily , Weekly | |
| Add VTYX to Watchlist: View: Get Complete VTYX Trend Analysis ➞ | |
 | LH Laboratory Corporation of America Holdings |
| Sector: Health Care | |
| SubSector: Medical Laboratories & Research | |
| MarketCap: 12119.2 Millions | |
| Recent Price: 207.94 Smart Investing & Trading Score: 49 | |
| Day Percent Change: -0.01% Day Change: -0.03 | |
| Week Change: 3.21% Year-to-date Change: -8.5% | |
| LH Links: Profile News Message Board | |
| Charts:- Daily , Weekly | |
| Add LH to Watchlist: View: Get Complete LH Trend Analysis ➞ | |
 | PODD Insulet Corporation |
| Sector: Health Care | |
| SubSector: Medical Instruments & Supplies | |
| MarketCap: 9313.2 Millions | |
| Recent Price: 167.25 Smart Investing & Trading Score: 60 | |
| Day Percent Change: -0.01% Day Change: -0.02 | |
| Week Change: 0.6% Year-to-date Change: -22.9% | |
| PODD Links: Profile News Message Board | |
| Charts:- Daily , Weekly | |
| Add PODD to Watchlist: View: Get Complete PODD Trend Analysis ➞ | |
 | ARGX argenx SE |
| Sector: Health Care | |
| SubSector: Biotechnology | |
| MarketCap: 5077.05 Millions | |
| Recent Price: 375.00 Smart Investing & Trading Score: 20 | |
| Day Percent Change: -0.02% Day Change: -0.08 | |
| Week Change: 4.13% Year-to-date Change: -1.4% | |
| ARGX Links: Profile News Message Board | |
| Charts:- Daily , Weekly | |
| Add ARGX to Watchlist: View: Get Complete ARGX Trend Analysis ➞ | |
 | BPMC Blueprint Medicines Corporation |
| Sector: Health Care | |
| SubSector: Biotechnology | |
| MarketCap: 3113.55 Millions | |
| Recent Price: 92.26 Smart Investing & Trading Score: 95 | |
| Day Percent Change: -0.03% Day Change: -0.03 | |
| Week Change: 6.23% Year-to-date Change: 0.0% | |
| BPMC Links: Profile News Message Board | |
| Charts:- Daily , Weekly | |
| Add BPMC to Watchlist: View: Get Complete BPMC Trend Analysis ➞ | |
 | BCYC Bicycle Therapeutics plc |
| Sector: Health Care | |
| SubSector: Biotechnology | |
| MarketCap: 214.485 Millions | |
| Recent Price: 22.67 Smart Investing & Trading Score: 54 | |
| Day Percent Change: -0.04% Day Change: -0.01 | |
| Week Change: -3.16% Year-to-date Change: 25.4% | |
| BCYC Links: Profile News Message Board | |
| Charts:- Daily , Weekly | |
| Add BCYC to Watchlist: View: Get Complete BCYC Trend Analysis ➞ | |
 | NHC National HealthCare Corporation |
| Sector: Health Care | |
| SubSector: Long-Term Care Facilities | |
| MarketCap: 1164.86 Millions | |
| Recent Price: 91.13 Smart Investing & Trading Score: 12 | |
| Day Percent Change: -0.05% Day Change: -0.05 | |
| Week Change: 0.56% Year-to-date Change: -1.4% | |
| NHC Links: Profile News Message Board | |
| Charts:- Daily , Weekly | |
| Add NHC to Watchlist: View: Get Complete NHC Trend Analysis ➞ | |
 | INMD InMode Ltd. |
| Sector: Health Care | |
| SubSector: Medical Appliances & Equipment | |
| MarketCap: 689.08 Millions | |
| Recent Price: 17.36 Smart Investing & Trading Score: 10 | |
| Day Percent Change: -0.06% Day Change: -0.01 | |
| Week Change: -0.34% Year-to-date Change: -21.9% | |
| INMD Links: Profile News Message Board | |
| Charts:- Daily , Weekly | |
| Add INMD to Watchlist: View: Get Complete INMD Trend Analysis ➞ | |
 | TARO Taro Pharmaceutical Industries Ltd. |
| Sector: Health Care | |
| SubSector: Drug Manufacturers - Other | |
| MarketCap: 2379.33 Millions | |
| Recent Price: 42.20 Smart Investing & Trading Score: 22 | |
| Day Percent Change: -0.07% Day Change: -0.03 | |
| Week Change: -0.12% Year-to-date Change: 1.0% | |
| TARO Links: Profile News Message Board | |
| Charts:- Daily , Weekly | |
| Add TARO to Watchlist: View: Get Complete TARO Trend Analysis ➞ | |
 | INVA Innoviva, Inc. |
| Sector: Health Care | |
| SubSector: Biotechnology | |
| MarketCap: 1023.15 Millions | |
| Recent Price: 15.16 Smart Investing & Trading Score: 69 | |
| Day Percent Change: -0.07% Day Change: -0.01 | |
| Week Change: 1.4% Year-to-date Change: -5.5% | |
| INVA Links: Profile News Message Board | |
| Charts:- Daily , Weekly | |
| Add INVA to Watchlist: View: Get Complete INVA Trend Analysis ➞ | |
 | REGN Regeneron Pharmaceuticals, Inc. |
| Sector: Health Care | |
| SubSector: Biotechnology | |
| MarketCap: 51903.7 Millions | |
| Recent Price: 906.54 Smart Investing & Trading Score: 32 | |
| Day Percent Change: -0.09% Day Change: -0.78 | |
| Week Change: 1.08% Year-to-date Change: 3.2% | |
| REGN Links: Profile News Message Board | |
| Charts:- Daily , Weekly | |
| Add REGN to Watchlist: View: Get Complete REGN Trend Analysis ➞ | |
 | FUSN Fusion Pharmaceuticals Inc. |
| Sector: Health Care | |
| SubSector: Biotechnology | |
| MarketCap: 52487 Millions | |
| Recent Price: 21.40 Smart Investing & Trading Score: 75 | |
| Day Percent Change: -0.09% Day Change: -0.02 | |
| Week Change: 0.85% Year-to-date Change: 122.9% | |
| FUSN Links: Profile News Message Board | |
| Charts:- Daily , Weekly | |
| Add FUSN to Watchlist: View: Get Complete FUSN Trend Analysis ➞ | |
 | CI Cigna Corporation |
| Sector: Health Care | |
| SubSector: Health Care Plans | |
| MarketCap: 60251.8 Millions | |
| Recent Price: 352.28 Smart Investing & Trading Score: 61 | |
| Day Percent Change: -0.10% Day Change: -0.37 | |
| Week Change: -0.03% Year-to-date Change: 17.6% | |
| CI Links: Profile News Message Board | |
| Charts:- Daily , Weekly | |
| Add CI to Watchlist: View: Get Complete CI Trend Analysis ➞ | |
 | AMED Amedisys, Inc. |
| Sector: Health Care | |
| SubSector: Home Health Care | |
| MarketCap: 6058.95 Millions | |
| Recent Price: 91.05 Smart Investing & Trading Score: 33 | |
| Day Percent Change: -0.12% Day Change: -0.11 | |
| Week Change: 0.72% Year-to-date Change: -4.2% | |
| AMED Links: Profile News Message Board | |
| Charts:- Daily , Weekly | |
| Add AMED to Watchlist: View: Get Complete AMED Trend Analysis ➞ | |
 | ZYME Zymeworks Inc. |
| Sector: Health Care | |
| SubSector: Biotechnology | |
| MarketCap: 1373.55 Millions | |
| Recent Price: 8.55 Smart Investing & Trading Score: 10 | |
| Day Percent Change: -0.12% Day Change: -0.01 | |
| Week Change: -3.39% Year-to-date Change: -17.7% | |
| ZYME Links: Profile News Message Board | |
| Charts:- Daily , Weekly | |
| Add ZYME to Watchlist: View: Get Complete ZYME Trend Analysis ➞ | |
 | HCA HCA Healthcare, Inc. |
| Sector: Health Care | |
| SubSector: Hospitals | |
| MarketCap: 29466.6 Millions | |
| Recent Price: 319.02 Smart Investing & Trading Score: 68 | |
| Day Percent Change: -0.13% Day Change: -0.41 | |
| Week Change: 4.56% Year-to-date Change: 17.9% | |
| HCA Links: Profile News Message Board | |
| Charts:- Daily , Weekly | |
| Add HCA to Watchlist: View: Get Complete HCA Trend Analysis ➞ | |
 | TNGX Tango Therapeutics, Inc. |
| Sector: Health Care | |
| SubSector: Biotechnology | |
| MarketCap: 302 Millions | |
| Recent Price: 7.76 Smart Investing & Trading Score: 57 | |
| Day Percent Change: -0.13% Day Change: -0.01 | |
| Week Change: 6.16% Year-to-date Change: -21.6% | |
| TNGX Links: Profile News Message Board | |
| Charts:- Daily , Weekly | |
| Add TNGX to Watchlist: View: Get Complete TNGX Trend Analysis ➞ | |
 | AKYA Akoya Biosciences, Inc. |
| Sector: Health Care | |
| SubSector: Medical Instruments & Supplies | |
| MarketCap: 340 Millions | |
| Recent Price: 3.81 Smart Investing & Trading Score: 10 | |
| Day Percent Change: -0.13% Day Change: 0.00 | |
| Week Change: 0.39% Year-to-date Change: -22.0% | |
| AKYA Links: Profile News Message Board | |
| Charts:- Daily , Weekly | |
| Add AKYA to Watchlist: View: Get Complete AKYA Trend Analysis ➞ | |
 | RNA Avidity Biosciences, Inc. |
| Sector: Health Care | |
| SubSector: Biotechnology | |
| MarketCap: 12287 Millions | |
| Recent Price: 25.11 Smart Investing & Trading Score: 90 | |
| Day Percent Change: -0.14% Day Change: -0.04 | |
| Week Change: 9.49% Year-to-date Change: 177.7% | |
| RNA Links: Profile News Message Board | |
| Charts:- Daily , Weekly | |
| Add RNA to Watchlist: View: Get Complete RNA Trend Analysis ➞ | |
 | CTLT Catalent, Inc. |
| Sector: Health Care | |
| SubSector: Drugs - Generic | |
| MarketCap: 6351.95 Millions | |
| Recent Price: 55.95 Smart Investing & Trading Score: 61 | |
| Day Percent Change: -0.14% Day Change: -0.08 | |
| Week Change: 0.85% Year-to-date Change: 24.5% | |
| CTLT Links: Profile News Message Board | |
| Charts:- Daily , Weekly | |
| Add CTLT to Watchlist: View: Get Complete CTLT Trend Analysis ➞ | |
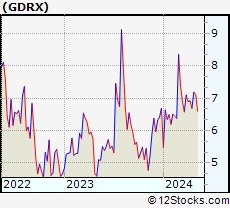 | GDRX GoodRx Holdings, Inc. |
| Sector: Health Care | |
| SubSector: Health Information Services | |
| MarketCap: 15197 Millions | |
| Recent Price: 6.96 Smart Investing & Trading Score: 78 | |
| Day Percent Change: -0.14% Day Change: -0.01 | |
| Week Change: 4.04% Year-to-date Change: 4.0% | |
| GDRX Links: Profile News Message Board | |
| Charts:- Daily , Weekly | |
| Add GDRX to Watchlist: View: Get Complete GDRX Trend Analysis ➞ | |
 | GPCR Structure Therapeutics Inc. |
| Sector: Health Care | |
| SubSector: Biotechnology | |
| MarketCap: 1530 Millions | |
| Recent Price: 36.05 Smart Investing & Trading Score: 20 | |
| Day Percent Change: -0.14% Day Change: -0.05 | |
| Week Change: -0.85% Year-to-date Change: -5.3% | |
| GPCR Links: Profile News Message Board | |
| Charts:- Daily , Weekly | |
| Add GPCR to Watchlist: View: Get Complete GPCR Trend Analysis ➞ | |
 | GKOS Glaukos Corporation |
| Sector: Health Care | |
| SubSector: Medical Instruments & Supplies | |
| MarketCap: 1103.6 Millions | |
| Recent Price: 100.93 Smart Investing & Trading Score: 100 | |
| Day Percent Change: -0.17% Day Change: -0.17 | |
| Week Change: 4.59% Year-to-date Change: 27.0% | |
| GKOS Links: Profile News Message Board | |
| Charts:- Daily , Weekly | |
| Add GKOS to Watchlist: View: Get Complete GKOS Trend Analysis ➞ | |
 | RCKT Rocket Pharmaceuticals, Inc. |
| Sector: Health Care | |
| SubSector: Biotechnology | |
| MarketCap: 899.585 Millions | |
| Recent Price: 23.63 Smart Investing & Trading Score: 20 | |
| Day Percent Change: -0.17% Day Change: -0.04 | |
| Week Change: 3.55% Year-to-date Change: -21.2% | |
| RCKT Links: Profile News Message Board | |
| Charts:- Daily , Weekly | |
| Add RCKT to Watchlist: View: Get Complete RCKT Trend Analysis ➞ | |
| For tabular summary view of above stock list: Summary View ➞ 0 - 25 , 25 - 50 , 50 - 75 , 75 - 100 , 100 - 125 , 125 - 150 , 150 - 175 , 175 - 200 , 200 - 225 , 225 - 250 , 250 - 275 , 275 - 300 , 300 - 325 , 325 - 350 , 350 - 375 , 375 - 400 , 400 - 425 , 425 - 450 , 450 - 475 , 475 - 500 , 500 - 525 , 525 - 550 , 550 - 575 , 575 - 600 , 600 - 625 , 625 - 650 , 650 - 675 , 675 - 700 , 700 - 725 | ||
| Click To Change The Sort Order: By Market Cap or Company Size Performance: Year-to-date, Week and Day | |
| Select Chart Type: | ||
|
Best Stocks Today 12Stocks.com |
© 2024 12Stocks.com Terms & Conditions Privacy Contact Us
All Information Provided Only For Education And Not To Be Used For Investing or Trading. See Terms & Conditions


One More Thing ... Get Best Stocks Delivered Daily!
Never Ever Miss A Move With Our Top Ten Stocks Lists
Find Best Stocks In Any Market - Bull or Bear Market
Take A Peek At Our Top Ten Stocks Lists: Daily, Weekly, Year-to-Date & Top Trends
Find Best Stocks In Any Market - Bull or Bear Market
Take A Peek At Our Top Ten Stocks Lists: Daily, Weekly, Year-to-Date & Top Trends
Healthcare Stocks With Best Up Trends [0-bearish to 100-bullish]: Annovis Bio[100], Boston Scientific[100], Integer [100], Quest Diagnostics[100], AstraZeneca [100], Oscar Health[100], PureTech Health[100], Glaukos [100], Agios [100], Pieris [100], Avadel [100]
Best Healthcare Stocks Year-to-Date:
Pieris [6427.47%], Precision BioSciences[2590.41%], Inovio [1892.16%], Assembly Biosciences[1543.7%], Aurora Cannabis[1411.97%], Adverum Biotechnologies[1253.61%], NuCana [1198.17%], Agenus [796.24%], Affimed N.V[680.8%], CareMax [574.23%], Corbus [488.41%] Best Healthcare Stocks This Week:
Pieris [8093.1%], Aesthetic [53.58%], Agenus [39.74%], BeyondSpring [35%], Seres [30.29%], VolitionRx [29.87%], Annovis Bio[27.4%], CareMax [27.24%], ProKidney [23.28%], GeneDx [22.61%], Cullinan Oncology[20.69%] Best Healthcare Stocks Daily:
Aesthetic [44.75%], Agenus [14.86%], Apyx [13.64%], Cullinan Oncology[13.55%], Amneal [12.04%], HOOKIPA Pharma[11.11%], Gritstone Oncology[10.06%], DURECT [9.75%], Sage [8.11%], Relay [7.46%], Annovis Bio[7.24%]