
 Login Sign Up


| |||||
 |  | ||||

| 12Stocks.com Market Intelligence |
Best Healthcare Stocks
 | "Discover best trending healthcare stocks with 12Stocks.com." |
| - Subu Vdaygiri, Founder, 12Stocks.com |
| In a hurry? Healthcare Stocks Lists: Performance Trends Table, Stock Charts
Sort Healthcare stocks: Daily, Weekly, Year-to-Date, Market Cap & Trends. Filter Healthcare stocks list by size:All Healthcare Large Mid-Range Small |
| 12Stocks.com Healthcare Stocks Performances & Trends Daily | |||||||||
|
|  The overall Smart Investing & Trading Score is 52 (0-bearish to 100-bullish) which puts Healthcare sector in short term neutral trend. The Smart Investing & Trading Score from previous trading session is 38 and an improvement of trend continues.
| ||||||||
Here are the Smart Investing & Trading Scores of the most requested Healthcare stocks at 12Stocks.com (click stock name for detailed review):
|


| 12Stocks.com: Investing in Healthcare sector with Stocks | |
|
The following table helps investors and traders sort through current performance and trends (as measured by Smart Investing & Trading Score) of various
stocks in the Healthcare sector. Quick View: Move mouse or cursor over stock symbol (ticker) to view short-term Technical chart and over stock name to view long term chart. Click on  to add stock symbol to your watchlist and to add stock symbol to your watchlist and  to view watchlist. Click on any ticker or stock name for detailed market intelligence report for that stock. to view watchlist. Click on any ticker or stock name for detailed market intelligence report for that stock. |
12Stocks.com Performance of Stocks in Healthcare Sector
| Ticker | Stock Name | Watchlist | Category | Recent Price | Smart Investing & Trading Score | Change % | YTD Change% |
| CDTX | Cidara |   | Biotechnology | 10.65 | 14 | 1,978.05 | NA |
| IMMP | Immutep | | Biotechnology | 2.95 | 100 | 17.53 | 22.92% |
| AGEN | Agenus | | Biotechnology | 7.12 | 95 | 10.22 | 760.01% |
| CTSO | Cytosorbents | | Laboratories | 0.88 | 27 | 9.55 | -20.81% |
| ENLV | Enlivex | | Biotechnology | 1.44 | 32 | 9.09 | -46.67% |
| CGEM | Cullinan Oncology | | Biotechnology | 18.00 | 53 | 8.11 | 76.51% |
| SAGE | Sage | | Biotechnology | 13.99 | 32 | 8.03 | -35.44% |
| VIGL | Vigil Neuroscience | | Biotechnology | 2.86 | 17 | 7.92 | -16.62% |
| ANNX | Annexon | | Biotechnology | 4.78 | 58 | 7.66 | 4.82% |
| XXII | 22nd Century | | Biotechnology | 1.79 | 60 | 7.19 | 861.33% |
| BYSI | BeyondSpring | | Biotechnology | 2.44 | 70 | 6.55 | 171.11% |
| BSX | Boston Scientific | | Equipment | 73.28 | 100 | 6.22 | 26.76% |
| GLYC | GlycoMimetics | | Biotechnology | 1.88 | 17 | 5.93 | -20.55% |
| STTK | Shattuck Labs | | Biotechnology | 10.00 | 88 | 5.37 | 40.85% |
| APYX | Apyx | | Instruments | 1.39 | 30 | 5.30 | -46.95% |
| GERN | Geron | | Biotechnology | 3.68 | 68 | 5.14 | 74.41% |
| BIIB | Biogen | | Biotechnology | 202.40 | 57 | 4.77 | -21.78% |
| DRRX | DURECT | | Pharmaceutical | 0.84 | 27 | 4.77 | 42.95% |
| TCMD | Tactile Systems | | Instruments | 15.26 | 52 | 4.74 | 6.71% |
| NARI | Inari | | Medical Devices | 38.83 | 35 | 4.63 | -40.21% |
| OM | Outset | | Medical Devices | 2.56 | 74 | 4.27 | -52.59% |
| AIM | AIM ImmunoTech | | Pharmaceutical | 0.44 | 36 | 4.18 | 0.77% |
| KRON | Kronos Bio | | Biotechnology | 0.99 | 15 | 4.07 | -20.90% |
| LAKE | Lakeland Industries | | Instruments | 16.97 | 37 | 4.02 | -8.50% |
| ANVS | Annovis Bio | | Biotechnology | 12.35 | 100 | 3.96 | -33.96% |
| For chart view version of above stock list: Chart View ➞ 0 - 25 , 25 - 50 , 50 - 75 , 75 - 100 , 100 - 125 , 125 - 150 , 150 - 175 , 175 - 200 , 200 - 225 , 225 - 250 , 250 - 275 , 275 - 300 , 300 - 325 , 325 - 350 , 350 - 375 , 375 - 400 , 400 - 425 , 425 - 450 , 450 - 475 , 475 - 500 , 500 - 525 , 525 - 550 , 550 - 575 , 575 - 600 , 600 - 625 , 625 - 650 | ||
 | Click To Change The Sort Order: By Market Cap or Company Size Performance: Year-to-date, Week and Day |  |
|
Get the most comprehensive stock market coverage daily at 12Stocks.com ➞ Best Stocks Today ➞ Best Stocks Weekly ➞ Best Stocks Year-to-Date ➞ Best Stocks Trends ➞  Best Stocks Today 12Stocks.com Best Nasdaq Stocks ➞ Best S&P 500 Stocks ➞ Best Tech Stocks ➞ Best Biotech Stocks ➞ |
| Detailed Overview of Healthcare Stocks |
| Healthcare Technical Overview, Leaders & Laggards, Top Healthcare ETF Funds & Detailed Healthcare Stocks List, Charts, Trends & More |
| Healthcare Sector: Technical Analysis, Trends & YTD Performance | |
| Healthcare sector is composed of stocks
from pharmaceutical, biotech, diagnostics labs, insurance providers
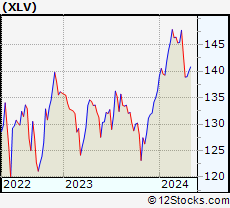
and healthcare services. Healthcare sector, as represented by XLV, an exchange-traded fund [ETF] that holds basket of Healthcare stocks (e.g, Merck, Amgen) is up by 2.84% and is currently underperforming the overall market by -2.5% year-to-date. Below is a quick view of Technical charts and trends: |
|
 XLV Weekly Chart |
|
| Long Term Trend: Not Good | |
| Medium Term Trend: Not Good | |
 XLV Daily Chart |
|
| Short Term Trend: Very Good | |
| Overall Trend Score: 52 | |
| YTD Performance: 2.84% | |
| **Trend Scores & Views Are Only For Educational Purposes And Not For Investing | |
| 12Stocks.com: Top Performing Healthcare Sector Stocks | ||||||||||||||||||||||||||||||||||||||||||||||||
 The top performing Healthcare sector stocks year to date are
Now, more recently, over last week, the top performing Healthcare sector stocks on the move are


|
||||||||||||||||||||||||||||||||||||||||||||||||
| 12Stocks.com: Investing in Healthcare Sector using Exchange Traded Funds | |
|
The following table shows list of key exchange traded funds (ETF) that
help investors track Healthcare Index. For detailed view, check out our ETF Funds section of our website. Quick View: Move mouse or cursor over ETF symbol (ticker) to view short-term Technical chart and over ETF name to view long term chart. Click on ticker or stock name for detailed view. Click on to add stock symbol to your watchlist and to view watchlist. |
12Stocks.com List of ETFs that track Healthcare Index
| Ticker | ETF Name | Watchlist | Recent Price | Smart Investing & Trading Score | Change % | Week % | Year-to-date % |
| XLV | Health Care | | 140.26 | 52 | -0.74 | 0.94 | 2.84% |
| XBI | Biotech | | 84.96 | 32 | 0.32 | 2.57 | -4.85% |
| IBB | Biotechnology | | 127.76 | 32 | -0.20 | 2.44 | -5.96% |
| BBH | Biotech | | 157.97 | 49 | 0.43 | 3.68 | -4.44% |
| IHF | Healthcare Providers | | 51.93 | 45 | -0.75 | -0.54 | -1.11% |
| LABU | Biotech Bull 3X | | 92.49 | 32 | 0.55 | 7.48 | -24.17% |
| LABD | Biotech Bear 3X | | 9.98 | 55 | -0.89 | -7.59 | 2.99% |
| RXL | Health Care | | 95.84 | 39 | -0.32 | 2.81 | 4.86% |
| 12Stocks.com: Charts, Trends, Fundamental Data and Performances of Healthcare Stocks | |
|
We now take in-depth look at all Healthcare stocks including charts, multi-period performances and overall trends (as measured by Smart Investing & Trading Score). One can sort Healthcare stocks (click link to choose) by Daily, Weekly and by Year-to-Date performances. Also, one can sort by size of the company or by market capitalization. |
| Select Your Default Chart Type: | |||||
| |||||
| Click on stock symbol or name for detailed view. Click on to add stock symbol to your watchlist and to view watchlist. Quick View: Move mouse or cursor over "Daily" to quickly view daily Technical stock chart and over "Weekly" to view weekly Technical stock chart. | |||||

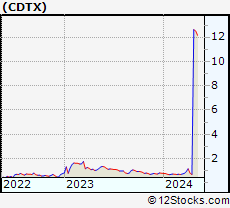 | CDTX Cidara Therapeutics, Inc. |
| Sector: Health Care | |
| SubSector: Biotechnology | |
| MarketCap: 99.0785 Millions | |
| Recent Price: 10.65 Smart Investing & Trading Score: 14 | |
| Day Percent Change: 1978.05% Day Change: 10.14 | |
| Week Change: 1463.88% Year-to-date Change: 1,241.3% | |
| CDTX Links: Profile News Message Board | |
| Charts:- Daily , Weekly | |
| Add CDTX to Watchlist: View: Get Complete CDTX Trend Analysis ➞ | |
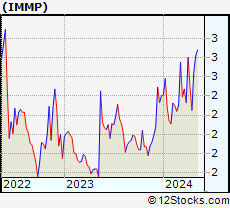 | IMMP Immutep Limited |
| Sector: Health Care | |
| SubSector: Biotechnology | |
| MarketCap: 71.5785 Millions | |
| Recent Price: 2.95 Smart Investing & Trading Score: 100 | |
| Day Percent Change: 17.53% Day Change: 0.44 | |
| Week Change: 31.11% Year-to-date Change: 22.9% | |
| IMMP Links: Profile News Message Board | |
| Charts:- Daily , Weekly | |
| Add IMMP to Watchlist: View: Get Complete IMMP Trend Analysis ➞ | |
 | AGEN Agenus Inc. |
| Sector: Health Care | |
| SubSector: Biotechnology | |
| MarketCap: 274.885 Millions | |
| Recent Price: 7.12 Smart Investing & Trading Score: 95 | |
| Day Percent Change: 10.22% Day Change: 0.66 | |
| Week Change: 34.09% Year-to-date Change: 760.0% | |
| AGEN Links: Profile News Message Board | |
| Charts:- Daily , Weekly | |
| Add AGEN to Watchlist: View: Get Complete AGEN Trend Analysis ➞ | |
 | CTSO Cytosorbents Corporation |
| Sector: Health Care | |
| SubSector: Medical Laboratories & Research | |
| MarketCap: 166.2 Millions | |
| Recent Price: 0.88 Smart Investing & Trading Score: 27 | |
| Day Percent Change: 9.55% Day Change: 0.08 | |
| Week Change: 9.6% Year-to-date Change: -20.8% | |
| CTSO Links: Profile News Message Board | |
| Charts:- Daily , Weekly | |
| Add CTSO to Watchlist: View: Get Complete CTSO Trend Analysis ➞ | |
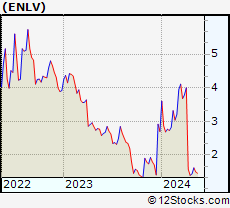 | ENLV Enlivex Therapeutics Ltd. |
| Sector: Health Care | |
| SubSector: Biotechnology | |
| MarketCap: 50.7785 Millions | |
| Recent Price: 1.44 Smart Investing & Trading Score: 32 | |
| Day Percent Change: 9.09% Day Change: 0.12 | |
| Week Change: 2.86% Year-to-date Change: -46.7% | |
| ENLV Links: Profile News Message Board | |
| Charts:- Daily , Weekly | |
| Add ENLV to Watchlist: View: Get Complete ENLV Trend Analysis ➞ | |
 | CGEM Cullinan Oncology, Inc. |
| Sector: Health Care | |
| SubSector: Biotechnology | |
| MarketCap: 433 Millions | |
| Recent Price: 18.00 Smart Investing & Trading Score: 53 | |
| Day Percent Change: 8.11% Day Change: 1.35 | |
| Week Change: 14.91% Year-to-date Change: 76.5% | |
| CGEM Links: Profile News Message Board | |
| Charts:- Daily , Weekly | |
| Add CGEM to Watchlist: View: Get Complete CGEM Trend Analysis ➞ | |
 | SAGE Sage Therapeutics, Inc. |
| Sector: Health Care | |
| SubSector: Biotechnology | |
| MarketCap: 1683.75 Millions | |
| Recent Price: 13.99 Smart Investing & Trading Score: 32 | |
| Day Percent Change: 8.03% Day Change: 1.04 | |
| Week Change: 4.95% Year-to-date Change: -35.4% | |
| SAGE Links: Profile News Message Board | |
| Charts:- Daily , Weekly | |
| Add SAGE to Watchlist: View: Get Complete SAGE Trend Analysis ➞ | |
 | VIGL Vigil Neuroscience, Inc. |
| Sector: Health Care | |
| SubSector: Biotechnology | |
| MarketCap: 339 Millions | |
| Recent Price: 2.86 Smart Investing & Trading Score: 17 | |
| Day Percent Change: 7.92% Day Change: 0.21 | |
| Week Change: 1.42% Year-to-date Change: -16.6% | |
| VIGL Links: Profile News Message Board | |
| Charts:- Daily , Weekly | |
| Add VIGL to Watchlist: View: Get Complete VIGL Trend Analysis ➞ | |
 | ANNX Annexon, Inc. |
| Sector: Health Care | |
| SubSector: Biotechnology | |
| MarketCap: 94487 Millions | |
| Recent Price: 4.78 Smart Investing & Trading Score: 58 | |
| Day Percent Change: 7.66% Day Change: 0.34 | |
| Week Change: 1.81% Year-to-date Change: 4.8% | |
| ANNX Links: Profile News Message Board | |
| Charts:- Daily , Weekly | |
| Add ANNX to Watchlist: View: Get Complete ANNX Trend Analysis ➞ | |
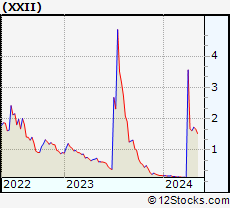 | XXII 22nd Century Group, Inc. |
| Sector: Health Care | |
| SubSector: Biotechnology | |
| MarketCap: 94.7785 Millions | |
| Recent Price: 1.79 Smart Investing & Trading Score: 60 | |
| Day Percent Change: 7.19% Day Change: 0.12 | |
| Week Change: 10.49% Year-to-date Change: 861.3% | |
| XXII Links: Profile News Message Board | |
| Charts:- Daily , Weekly | |
| Add XXII to Watchlist: View: Get Complete XXII Trend Analysis ➞ | |
 | BYSI BeyondSpring Inc. |
| Sector: Health Care | |
| SubSector: Biotechnology | |
| MarketCap: 432.785 Millions | |
| Recent Price: 2.44 Smart Investing & Trading Score: 70 | |
| Day Percent Change: 6.55% Day Change: 0.15 | |
| Week Change: 35.56% Year-to-date Change: 171.1% | |
| BYSI Links: Profile News Message Board | |
| Charts:- Daily , Weekly | |
| Add BYSI to Watchlist: View: Get Complete BYSI Trend Analysis ➞ | |
 | BSX Boston Scientific Corporation |
| Sector: Health Care | |
| SubSector: Medical Appliances & Equipment | |
| MarketCap: 41541.2 Millions | |
| Recent Price: 73.28 Smart Investing & Trading Score: 100 | |
| Day Percent Change: 6.22% Day Change: 4.29 | |
| Week Change: 8.84% Year-to-date Change: 26.8% | |
| BSX Links: Profile News Message Board | |
| Charts:- Daily , Weekly | |
| Add BSX to Watchlist: View: Get Complete BSX Trend Analysis ➞ | |
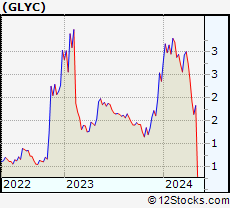 | GLYC GlycoMimetics, Inc. |
| Sector: Health Care | |
| SubSector: Biotechnology | |
| MarketCap: 100.785 Millions | |
| Recent Price: 1.88 Smart Investing & Trading Score: 17 | |
| Day Percent Change: 5.93% Day Change: 0.10 | |
| Week Change: -2.6% Year-to-date Change: -20.6% | |
| GLYC Links: Profile News Message Board | |
| Charts:- Daily , Weekly | |
| Add GLYC to Watchlist: View: Get Complete GLYC Trend Analysis ➞ | |
 | STTK Shattuck Labs, Inc. |
| Sector: Health Care | |
| SubSector: Biotechnology | |
| MarketCap: 16987 Millions | |
| Recent Price: 10.00 Smart Investing & Trading Score: 88 | |
| Day Percent Change: 5.37% Day Change: 0.51 | |
| Week Change: 2.15% Year-to-date Change: 40.9% | |
| STTK Links: Profile News Message Board | |
| Charts:- Daily , Weekly | |
| Add STTK to Watchlist: View: Get Complete STTK Trend Analysis ➞ | |
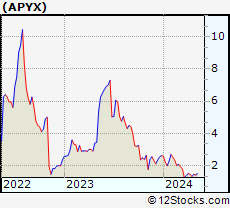 | APYX Apyx Medical Corporation |
| Sector: Health Care | |
| SubSector: Medical Instruments & Supplies | |
| MarketCap: 130.96 Millions | |
| Recent Price: 1.39 Smart Investing & Trading Score: 30 | |
| Day Percent Change: 5.30% Day Change: 0.07 | |
| Week Change: 4.91% Year-to-date Change: -47.0% | |
| APYX Links: Profile News Message Board | |
| Charts:- Daily , Weekly | |
| Add APYX to Watchlist: View: Get Complete APYX Trend Analysis ➞ | |
 | GERN Geron Corporation |
| Sector: Health Care | |
| SubSector: Biotechnology | |
| MarketCap: 228.685 Millions | |
| Recent Price: 3.68 Smart Investing & Trading Score: 68 | |
| Day Percent Change: 5.14% Day Change: 0.18 | |
| Week Change: -0.27% Year-to-date Change: 74.4% | |
| GERN Links: Profile News Message Board | |
| Charts:- Daily , Weekly | |
| Add GERN to Watchlist: View: Get Complete GERN Trend Analysis ➞ | |
 | BIIB Biogen Inc. |
| Sector: Health Care | |
| SubSector: Biotechnology | |
| MarketCap: 53102.6 Millions | |
| Recent Price: 202.40 Smart Investing & Trading Score: 57 | |
| Day Percent Change: 4.77% Day Change: 9.22 | |
| Week Change: 4.13% Year-to-date Change: -21.8% | |
| BIIB Links: Profile News Message Board | |
| Charts:- Daily , Weekly | |
| Add BIIB to Watchlist: View: Get Complete BIIB Trend Analysis ➞ | |
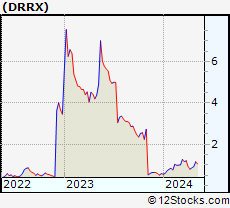 | DRRX DURECT Corporation |
| Sector: Health Care | |
| SubSector: Drug Manufacturers - Other | |
| MarketCap: 256.333 Millions | |
| Recent Price: 0.84 Smart Investing & Trading Score: 27 | |
| Day Percent Change: 4.77% Day Change: 0.04 | |
| Week Change: -3.19% Year-to-date Change: 43.0% | |
| DRRX Links: Profile News Message Board | |
| Charts:- Daily , Weekly | |
| Add DRRX to Watchlist: View: Get Complete DRRX Trend Analysis ➞ | |
 | TCMD Tactile Systems Technology, Inc. |
| Sector: Health Care | |
| SubSector: Medical Instruments & Supplies | |
| MarketCap: 655.96 Millions | |
| Recent Price: 15.26 Smart Investing & Trading Score: 52 | |
| Day Percent Change: 4.74% Day Change: 0.69 | |
| Week Change: 5.97% Year-to-date Change: 6.7% | |
| TCMD Links: Profile News Message Board | |
| Charts:- Daily , Weekly | |
| Add TCMD to Watchlist: View: Get Complete TCMD Trend Analysis ➞ | |
 | NARI Inari Medical, Inc. |
| Sector: Health Care | |
| SubSector: Medical Devices | |
| MarketCap: 33287 Millions | |
| Recent Price: 38.83 Smart Investing & Trading Score: 35 | |
| Day Percent Change: 4.63% Day Change: 1.72 | |
| Week Change: -0.36% Year-to-date Change: -40.2% | |
| NARI Links: Profile News Message Board | |
| Charts:- Daily , Weekly | |
| Add NARI to Watchlist: View: Get Complete NARI Trend Analysis ➞ | |
 | OM Outset Medical, Inc. |
| Sector: Health Care | |
| SubSector: Medical Devices | |
| MarketCap: 21787 Millions | |
| Recent Price: 2.56 Smart Investing & Trading Score: 74 | |
| Day Percent Change: 4.27% Day Change: 0.10 | |
| Week Change: 12.25% Year-to-date Change: -52.6% | |
| OM Links: Profile News Message Board | |
| Charts:- Daily , Weekly | |
| Add OM to Watchlist: View: Get Complete OM Trend Analysis ➞ | |
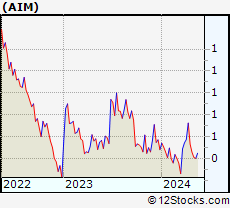 | AIM AIM ImmunoTech Inc. |
| Sector: Health Care | |
| SubSector: Drug Manufacturers - Other | |
| MarketCap: 61.4033 Millions | |
| Recent Price: 0.44 Smart Investing & Trading Score: 36 | |
| Day Percent Change: 4.18% Day Change: 0.02 | |
| Week Change: -4.67% Year-to-date Change: 0.8% | |
| AIM Links: Profile News Message Board | |
| Charts:- Daily , Weekly | |
| Add AIM to Watchlist: View: Get Complete AIM Trend Analysis ➞ | |
 | KRON Kronos Bio, Inc. |
| Sector: Health Care | |
| SubSector: Biotechnology | |
| MarketCap: 17287 Millions | |
| Recent Price: 0.99 Smart Investing & Trading Score: 15 | |
| Day Percent Change: 4.07% Day Change: 0.04 | |
| Week Change: -4.01% Year-to-date Change: -20.9% | |
| KRON Links: Profile News Message Board | |
| Charts:- Daily , Weekly | |
| Add KRON to Watchlist: View: Get Complete KRON Trend Analysis ➞ | |
 | LAKE Lakeland Industries, Inc. |
| Sector: Health Care | |
| SubSector: Medical Instruments & Supplies | |
| MarketCap: 138.16 Millions | |
| Recent Price: 16.97 Smart Investing & Trading Score: 37 | |
| Day Percent Change: 4.02% Day Change: 0.66 | |
| Week Change: 2.94% Year-to-date Change: -8.5% | |
| LAKE Links: Profile News Message Board | |
| Charts:- Daily , Weekly | |
| Add LAKE to Watchlist: View: Get Complete LAKE Trend Analysis ➞ | |
 | ANVS Annovis Bio, Inc. |
| Sector: Health Care | |
| SubSector: Biotechnology | |
| MarketCap: 41487 Millions | |
| Recent Price: 12.35 Smart Investing & Trading Score: 100 | |
| Day Percent Change: 3.96% Day Change: 0.47 | |
| Week Change: 23.5% Year-to-date Change: -34.0% | |
| ANVS Links: Profile News Message Board | |
| Charts:- Daily , Weekly | |
| Add ANVS to Watchlist: View: Get Complete ANVS Trend Analysis ➞ | |
| For tabular summary view of above stock list: Summary View ➞ 0 - 25 , 25 - 50 , 50 - 75 , 75 - 100 , 100 - 125 , 125 - 150 , 150 - 175 , 175 - 200 , 200 - 225 , 225 - 250 , 250 - 275 , 275 - 300 , 300 - 325 , 325 - 350 , 350 - 375 , 375 - 400 , 400 - 425 , 425 - 450 , 450 - 475 , 475 - 500 , 500 - 525 , 525 - 550 , 550 - 575 , 575 - 600 , 600 - 625 , 625 - 650 | ||
| Click To Change The Sort Order: By Market Cap or Company Size Performance: Year-to-date, Week and Day | |
| Select Chart Type: | ||
|
Best Stocks Today 12Stocks.com |
© 2024 12Stocks.com Terms & Conditions Privacy Contact Us
All Information Provided Only For Education And Not To Be Used For Investing or Trading. See Terms & Conditions


One More Thing ... Get Best Stocks Delivered Daily!
Never Ever Miss A Move With Our Top Ten Stocks Lists
Find Best Stocks In Any Market - Bull or Bear Market
Take A Peek At Our Top Ten Stocks Lists: Daily, Weekly, Year-to-Date & Top Trends
Find Best Stocks In Any Market - Bull or Bear Market
Take A Peek At Our Top Ten Stocks Lists: Daily, Weekly, Year-to-Date & Top Trends
Healthcare Stocks With Best Up Trends [0-bearish to 100-bullish]: Boston Scientific[100], Annovis Bio[100], Integer [100], Glaukos [100], BioMarin [100], Oscar Health[100], AstraZeneca [100], Quest Diagnostics[100], PureTech Health[100], Avadel [100], Agios [100]
Best Healthcare Stocks Year-to-Date:
Pieris [6323.08%], Precision BioSciences[2679.45%], Inovio [1931.37%], Assembly Biosciences[1518.1%], Adverum Biotechnologies[1359.88%], NuCana [1252.27%], Agenus [760.01%], Affimed N.V[756%], CareMax [594.85%], Corbus [500.58%], Mesoblast [438.18%] Best Healthcare Stocks This Week:
Pieris [7962.07%], BeyondSpring [35.56%], Agenus [34.09%], CareMax [31.13%], Seres [30.01%], VolitionRx [29.89%], GeneDx [24.74%], Annovis Bio[23.5%], ProKidney [23.28%], MSP Recovery[19.2%], Molecular Partners[16.87%] Best Healthcare Stocks Daily:
Agenus [10.22%], Cytosorbents [9.55%], Cullinan Oncology[8.11%], Sage [8.03%], Vigil Neuroscience[7.92%], Annexon [7.66%], BeyondSpring [6.55%], Boston Scientific[6.22%], GlycoMimetics [5.93%], Shattuck Labs[5.37%], Apyx [5.30%]