
 Login Sign Up


| |||||
 |  | ||||

| 12Stocks.com Market Intelligence |
Best Emerging Markets Stocks
| In a hurry? Emerging Markets Stocks Lists: Trends Table, Stock Charts
Sort Emerging Markets stocks: Daily, Weekly, Year-to-Date, Market Cap & Trends. Filter Emerging Markets stocks list by sector: Show all, Tech, Finance, Energy, Staples, Retail, Industrial, Materials, Utilities and HealthCare Filter Emerging Markets stocks list by size:All Large Medium Small |
| 12Stocks.com Emerging Markets Stocks Performances & Trends Daily | |||||||||
|
|  The overall Smart Investing & Trading Score is 76 (0-bearish to 100-bullish) which puts Emerging Markets index in short term neutral to bullish trend. The Smart Investing & Trading Score from previous trading session is 100 and a deterioration of trend continues.
| ||||||||
Here are the Smart Investing & Trading Scores of the most requested Emerging Markets stocks at 12Stocks.com (click stock name for detailed review):
|


| 12Stocks.com: Top Performing Emerging Markets Index Stocks | ||||||||||||||||||||||||||||||||||||||||||||||||
 The top performing Emerging Markets Index stocks year to date are
Now, more recently, over last week, the top performing Emerging Markets Index stocks on the move are


|
||||||||||||||||||||||||||||||||||||||||||||||||
| 12Stocks.com: Investing in Emerging Markets Index with Stocks | |
|
The following table helps investors and traders sort through current performance and trends (as measured by Smart Investing & Trading Score ) of various
stocks in the Emerging Markets Index. Quick View: Move mouse or cursor over stock symbol (ticker) to view short-term technical chart and over stock name to view long term chart. Click on  to add stock symbol to your watchlist and to add stock symbol to your watchlist and  to view watchlist. Click on any ticker or stock name for detailed market intelligence report for that stock. to view watchlist. Click on any ticker or stock name for detailed market intelligence report for that stock. |
12Stocks.com Performance of Stocks in Emerging Markets Index
| Ticker | Stock Name | Watchlist | Category | Recent Price | Smart Investing & Trading Score | Change % | YTD Change% |
| YQ | 17 Education |   | Consumer Staples | 2.70 | 53 | 0.00% | 32.36% |
| JFIN | Jiayin | | Technology | 6.85 | 93 | -0.29% | 32.24% |
| TOUR | Tuniu | | Consumer Staples | 0.88 | 56 | 0.00% | 31.54% |
| SIMO | Silicon Motion | | Technology | 79.08 | 93 | -0.20% | 29.07% |
| QFIN | 360 Finance | | Financials | 19.94 | 88 | 0.15% | 26.04% |
| HUYA | HUYA | | Services & Goods | 4.56 | 48 | -2.36% | 24.59% |
| MSC | Studio City | | Services & Goods | 8.00 | 80 | 6.10% | 23.46% |
| YMM | Full Truck | | Technology | 8.60 | 56 | -0.81% | 22.94% |
| BZ | Kanzhun | | Industrials | 19.93 | 58 | -1.12% | 20.64% |
| MNSO | MINISO | | Services & Goods | 24.57 | 95 | 1.99% | 20.44% |
| HTHT | Huazhu | | Services & Goods | 40.01 | 58 | -0.40% | 19.65% |
| QD | Qudian | | Technology | 2.40 | 37 | -1.84% | 17.40% |
| WIMI | WiMi Hologram | | Technology | 0.94 | 30 | -1.18% | 16.81% |
| SOHU | Sohu.com | | Technology | 11.55 | 65 | 0.00% | 16.31% |
| ASR | Grupo Aeroportuario | | Transports | 338.46 | 59 | 0.55% | 15.02% |
| EDU | New Oriental | | Services & Goods | 83.86 | 34 | 2.71% | 14.43% |
| BILI | Bilibili | | Technology | 13.76 | 63 | -0.86% | 13.02% |
| IBN | ICICI Bank | | Financials | 26.91 | 46 | -0.77% | 12.88% |
| TWN | Taiwan Fund | | Financials | 39.03 | 48 | 0.29% | 12.84% |
| DDL | Dingdong (Cayman) | | Consumer Staples | 1.72 | 85 | 5.86% | 12.83% |
| CIG | Companhia Energetica | | Utilities | 2.59 | 68 | -0.38% | 11.64% |
| JD | JD.com | | Technology | 32.03 | 68 | -0.31% | 10.87% |
| WDH | Waterdrop | | Financials | 1.16 | 28 | -0.85% | 10.79% |
| ASX | ASE | | Technology | 10.43 | 58 | 0.34% | 10.79% |
| GFI | Gold Fields | | Materials | 16.00 | 46 | 0.63% | 10.65% |
| For chart view version of above stock list: Chart View ➞ 0 - 25 , 25 - 50 , 50 - 75 , 75 - 100 , 100 - 125 , 125 - 150 , 150 - 175 , 175 - 200 | ||
 | Click To Change The Sort Order: By Market Cap or Company Size Performance: Year-to-date, Week and Day |  |
|
Get the most comprehensive stock market coverage daily at 12Stocks.com ➞ Best Stocks Today ➞ Best Stocks Weekly ➞ Best Stocks Year-to-Date ➞ Best Stocks Trends ➞  Best Stocks Today 12Stocks.com Best Nasdaq Stocks ➞ Best S&P 500 Stocks ➞ Best Tech Stocks ➞ Best Biotech Stocks ➞ |
| Detailed Overview of Emerging Markets Stocks |
| Emerging Markets Technical Overview, Leaders & Laggards, Top Emerging Markets ETF Funds & Detailed Emerging Markets Stocks List, Charts, Trends & More |
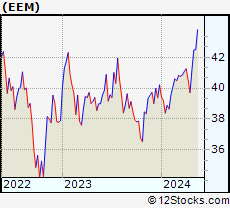
| Emerging Markets: Technical Analysis, Trends & YTD Performance | |
 EEM Weekly Chart |
|
| Long Term Trend: Very Good | |
| Medium Term Trend: Very Good | |
 EEM Daily Chart |
|
| Short Term Trend: Not Good | |
| Overall Trend Score: 76 | |
| YTD Performance: 5.04% | |
| **Trend Scores & Views Are Only For Educational Purposes And Not For Investing | |
| 12Stocks.com: Investing in Emerging Markets Index using Exchange Traded Funds | |
|
The following table shows list of key exchange traded funds (ETF) that
help investors play Emerging Markets stock market. For detailed view, check out our ETF Funds section of our website. Quick View: Move mouse or cursor over ETF symbol (ticker) to view short-term technical chart and over ETF name to view long term chart. Click on ticker or stock name for detailed view. Click on to add stock symbol to your watchlist and to view watchlist. |
12Stocks.com List of ETFs that track Emerging Markets Index
| Ticker | ETF Name | Watchlist | Recent Price | Smart Investing & Trading Score | Change % | Week % | Year-to-date % |
| EEM | Emerging Markets | | 42.23 | 76 | -0.08 | -0.55 | 5.04% |
| VWO | Emerging Markets | | 43.17 | 68 | -0.16 | -1.05 | 5.04% |
| SCHE | Emerging Markets Equity | | 26.10 | 61 | -0.11 | -0.95 | 5.28% |
| EWX | Emerging Markets Small | | 57.52 | 68 | -0.22 | -1.13 | 1.89% |
| EET | Emerging Markets | | 53.85 | 68 | 0.12 | -0.98 | 5.89% |
| EDC | Emrg Mkts Bull | | 32.30 | 68 | -0.05 | -1.69 | 6.13% |
| EEV | Short Emerging | | 18.13 | 25 | -0.04 | 0.18 | -8.07% |
| EUM | Short Emerging | | 13.63 | 25 | 0.00 | 0.48 | -3.67% |
| EDIV | Emerging Markets Dividend | | 34.40 | 71 | -0.24 | -0.06 | 5.77% |
| EMIF | Emerging Markets Infrastructure | | 22.59 | 100 | -0.28 | 0.65 | 5.54% |
| CEW | Emerging Currency Strat | | 17.89 | 78 | 0.15 | 0.04 | -0.66% |
| EBND | Em Mkts Lcl | | 20.18 | 38 | -0.12 | -0.07 | -4.97% |
| EMCB | Emerging Markets Corp | | 64.22 | 75 | -0.47 | 0.04 | 0.51% |
| VWOB | Emerging Mkts Govt | | 63.06 | 63 | -0.37 | 0.12 | -1.07% |
| EEMA | Emerging Markets Asia | | 70.49 | 68 | -0.17 | -0.86 | 6.63% |
| EELV | Em Mkts Low | | 24.01 | 63 | -0.04 | -0.37 | -0.12% |
| DVYE | Emerging Markets Dividend | | 27.93 | 76 | -0.46 | -0.07 | 5.44% |
| SDEM | SuperDividend Em Mkts | | 26.10 | 63 | -0.11 | 0.29 | 5.25% |
| DBEM | Em Mkts Hdgd | | 24.41 | 76 | 0.02 | -0.35 | 5.83% |
| PCY | Emerging Markets Sov | | 20.18 | 68 | -0.32 | 0.27 | -2.11% |
| QEMM | Emerging Mkts StratcFacts | | 58.86 | 88 | 0.14 | 0.14 | 2.98% |
| 12Stocks.com: Charts, Trends, Fundamental Data and Performances of Emerging Markets Stocks | |
|
We now take in-depth look at all Emerging Markets stocks including charts, multi-period performances and overall trends (as measured by Smart Investing & Trading Score ). One can sort Emerging Markets stocks (click link to choose) by Daily, Weekly and by Year-to-Date performances. Also, one can sort by size of the company or by market capitalization. |
| Select Your Default Chart Type: | |||||
| |||||
| Click on stock symbol or name for detailed view. Click on to add stock symbol to your watchlist and to view watchlist. Quick View: Move mouse or cursor over "Daily" to quickly view daily technical stock chart and over "Weekly" to view weekly technical stock chart. | |||||

 | YQ 17 Education & Technology Group Inc. |
| Sector: Consumer Staples | |
| SubSector: Education & Training Services | |
| MarketCap: 32347 Millions | |
| Recent Price: 2.70 Smart Investing & Trading Score : 53 | |
| Day Percent Change: 0.00% Day Change: 0.00 | |
| Week Change: -4.59% Year-to-date Change: 32.4% | |
| YQ Links: Profile News Message Board | |
| Charts:- Daily , Weekly | |
| Add YQ to Watchlist: View: Get Complete YQ Trend Analysis ➞ | |
 | JFIN Jiayin Group Inc. |
| Sector: Technology | |
| SubSector: Internet Information Providers | |
| MarketCap: 131.48 Millions | |
| Recent Price: 6.85 Smart Investing & Trading Score : 93 | |
| Day Percent Change: -0.29% Day Change: -0.02 | |
| Week Change: 8.21% Year-to-date Change: 32.2% | |
| JFIN Links: Profile News Message Board | |
| Charts:- Daily , Weekly | |
| Add JFIN to Watchlist: View: Get Complete JFIN Trend Analysis ➞ | |
 | TOUR Tuniu Corporation |
| Sector: Consumer Staples | |
| SubSector: Recreational Goods, Other | |
| MarketCap: 124.459 Millions | |
| Recent Price: 0.88 Smart Investing & Trading Score : 56 | |
| Day Percent Change: 0.00% Day Change: 0.00 | |
| Week Change: -4.54% Year-to-date Change: 31.5% | |
| TOUR Links: Profile News Message Board | |
| Charts:- Daily , Weekly | |
| Add TOUR to Watchlist: View: Get Complete TOUR Trend Analysis ➞ | |
 | SIMO Silicon Motion Technology Corporation |
| Sector: Technology | |
| SubSector: Diversified Electronics | |
| MarketCap: 1186.66 Millions | |
| Recent Price: 79.08 Smart Investing & Trading Score : 93 | |
| Day Percent Change: -0.20% Day Change: -0.16 | |
| Week Change: 6.93% Year-to-date Change: 29.1% | |
| SIMO Links: Profile News Message Board | |
| Charts:- Daily , Weekly | |
| Add SIMO to Watchlist: View: Get Complete SIMO Trend Analysis ➞ | |
 | QFIN 360 Finance, Inc. |
| Sector: Financials | |
| SubSector: Credit Services | |
| MarketCap: 956.208 Millions | |
| Recent Price: 19.94 Smart Investing & Trading Score : 88 | |
| Day Percent Change: 0.15% Day Change: 0.03 | |
| Week Change: 2.26% Year-to-date Change: 26.0% | |
| QFIN Links: Profile News Message Board | |
| Charts:- Daily , Weekly | |
| Add QFIN to Watchlist: View: Get Complete QFIN Trend Analysis ➞ | |
 | HUYA HUYA Inc. |
| Sector: Services & Goods | |
| SubSector: Entertainment - Diversified | |
| MarketCap: 3358.17 Millions | |
| Recent Price: 4.56 Smart Investing & Trading Score : 48 | |
| Day Percent Change: -2.36% Day Change: -0.11 | |
| Week Change: -4.4% Year-to-date Change: 24.6% | |
| HUYA Links: Profile News Message Board | |
| Charts:- Daily , Weekly | |
| Add HUYA to Watchlist: View: Get Complete HUYA Trend Analysis ➞ | |
 | MSC Studio City International Holdings Limited |
| Sector: Services & Goods | |
| SubSector: Resorts & Casinos | |
| MarketCap: 1420.54 Millions | |
| Recent Price: 8.00 Smart Investing & Trading Score : 80 | |
| Day Percent Change: 6.10% Day Change: 0.46 | |
| Week Change: 0% Year-to-date Change: 23.5% | |
| MSC Links: Profile News Message Board | |
| Charts:- Daily , Weekly | |
| Add MSC to Watchlist: View: Get Complete MSC Trend Analysis ➞ | |
 | YMM Full Truck Alliance Co. Ltd. |
| Sector: Technology | |
| SubSector: Software - Application | |
| MarketCap: 6960 Millions | |
| Recent Price: 8.60 Smart Investing & Trading Score : 56 | |
| Day Percent Change: -0.81% Day Change: -0.07 | |
| Week Change: -3.04% Year-to-date Change: 22.9% | |
| YMM Links: Profile News Message Board | |
| Charts:- Daily , Weekly | |
| Add YMM to Watchlist: View: Get Complete YMM Trend Analysis ➞ | |
 | BZ Kanzhun Limited |
| Sector: Industrials | |
| SubSector: Staffing & Employment Services | |
| MarketCap: 6680 Millions | |
| Recent Price: 19.93 Smart Investing & Trading Score : 58 | |
| Day Percent Change: -1.12% Day Change: -0.23 | |
| Week Change: -2.26% Year-to-date Change: 20.6% | |
| BZ Links: Profile News Message Board | |
| Charts:- Daily , Weekly | |
| Add BZ to Watchlist: View: Get Complete BZ Trend Analysis ➞ | |
 | MNSO MINISO Group Holding Limited |
| Sector: Services & Goods | |
| SubSector: Specialty Retail | |
| MarketCap: 69427 Millions | |
| Recent Price: 24.57 Smart Investing & Trading Score : 95 | |
| Day Percent Change: 1.99% Day Change: 0.48 | |
| Week Change: 2.29% Year-to-date Change: 20.4% | |
| MNSO Links: Profile News Message Board | |
| Charts:- Daily , Weekly | |
| Add MNSO to Watchlist: View: Get Complete MNSO Trend Analysis ➞ | |
 | HTHT Huazhu Group Limited |
| Sector: Services & Goods | |
| SubSector: Lodging | |
| MarketCap: 9164.46 Millions | |
| Recent Price: 40.01 Smart Investing & Trading Score : 58 | |
| Day Percent Change: -0.40% Day Change: -0.16 | |
| Week Change: -2.37% Year-to-date Change: 19.7% | |
| HTHT Links: Profile News Message Board | |
| Charts:- Daily , Weekly | |
| Add HTHT to Watchlist: View: Get Complete HTHT Trend Analysis ➞ | |
 | QD Qudian Inc. |
| Sector: Technology | |
| SubSector: Information Technology Services | |
| MarketCap: 544.968 Millions | |
| Recent Price: 2.40 Smart Investing & Trading Score : 37 | |
| Day Percent Change: -1.84% Day Change: -0.04 | |
| Week Change: -4.2% Year-to-date Change: 17.4% | |
| QD Links: Profile News Message Board | |
| Charts:- Daily , Weekly | |
| Add QD to Watchlist: View: Get Complete QD Trend Analysis ➞ | |
 | WIMI WiMi Hologram Cloud Inc. |
| Sector: Technology | |
| SubSector: Advertising Agencies | |
| MarketCap: 41837 Millions | |
| Recent Price: 0.94 Smart Investing & Trading Score : 30 | |
| Day Percent Change: -1.18% Day Change: -0.01 | |
| Week Change: -2.06% Year-to-date Change: 16.8% | |
| WIMI Links: Profile News Message Board | |
| Charts:- Daily , Weekly | |
| Add WIMI to Watchlist: View: Get Complete WIMI Trend Analysis ➞ | |
 | SOHU Sohu.com Limited |
| Sector: Technology | |
| SubSector: Internet Information Providers | |
| MarketCap: 243.48 Millions | |
| Recent Price: 11.55 Smart Investing & Trading Score : 65 | |
| Day Percent Change: 0.00% Day Change: 0.00 | |
| Week Change: -3.43% Year-to-date Change: 16.3% | |
| SOHU Links: Profile News Message Board | |
| Charts:- Daily , Weekly | |
| Add SOHU to Watchlist: View: Get Complete SOHU Trend Analysis ➞ | |
 | ASR Grupo Aeroportuario del Sureste, S. A. B. de C. V. |
| Sector: Transports | |
| SubSector: Air Services, Other | |
| MarketCap: 2739.98 Millions | |
| Recent Price: 338.46 Smart Investing & Trading Score : 59 | |
| Day Percent Change: 0.55% Day Change: 1.86 | |
| Week Change: -0.64% Year-to-date Change: 15.0% | |
| ASR Links: Profile News Message Board | |
| Charts:- Daily , Weekly | |
| Add ASR to Watchlist: View: Get Complete ASR Trend Analysis ➞ | |
 | EDU New Oriental Education & Technology Group Inc. |
| Sector: Services & Goods | |
| SubSector: Education & Training Services | |
| MarketCap: 18673.7 Millions | |
| Recent Price: 83.86 Smart Investing & Trading Score : 34 | |
| Day Percent Change: 2.71% Day Change: 2.22 | |
| Week Change: -1.06% Year-to-date Change: 14.4% | |
| EDU Links: Profile News Message Board | |
| Charts:- Daily , Weekly | |
| Add EDU to Watchlist: View: Get Complete EDU Trend Analysis ➞ | |
 | BILI Bilibili Inc. |
| Sector: Technology | |
| SubSector: Internet Information Providers | |
| MarketCap: 7043.1 Millions | |
| Recent Price: 13.76 Smart Investing & Trading Score : 63 | |
| Day Percent Change: -0.86% Day Change: -0.12 | |
| Week Change: -7.25% Year-to-date Change: 13.0% | |
| BILI Links: Profile News Message Board | |
| Charts:- Daily , Weekly | |
| Add BILI to Watchlist: View: Get Complete BILI Trend Analysis ➞ | |
 | IBN ICICI Bank Limited |
| Sector: Financials | |
| SubSector: Money Center Banks | |
| MarketCap: 31194.1 Millions | |
| Recent Price: 26.91 Smart Investing & Trading Score : 46 | |
| Day Percent Change: -0.77% Day Change: -0.21 | |
| Week Change: -1.57% Year-to-date Change: 12.9% | |
| IBN Links: Profile News Message Board | |
| Charts:- Daily , Weekly | |
| Add IBN to Watchlist: View: Get Complete IBN Trend Analysis ➞ | |
 | TWN The Taiwan Fund, Inc. |
| Sector: Financials | |
| SubSector: Closed-End Fund - Foreign | |
| MarketCap: 110.547 Millions | |
| Recent Price: 39.03 Smart Investing & Trading Score : 48 | |
| Day Percent Change: 0.29% Day Change: 0.11 | |
| Week Change: -1.06% Year-to-date Change: 12.8% | |
| TWN Links: Profile News Message Board | |
| Charts:- Daily , Weekly | |
| Add TWN to Watchlist: View: Get Complete TWN Trend Analysis ➞ | |
 | DDL Dingdong (Cayman) Limited |
| Sector: Consumer Staples | |
| SubSector: Grocery Stores | |
| MarketCap: 708 Millions | |
| Recent Price: 1.72 Smart Investing & Trading Score : 85 | |
| Day Percent Change: 5.86% Day Change: 0.09 | |
| Week Change: 9.24% Year-to-date Change: 12.8% | |
| DDL Links: Profile News Message Board | |
| Charts:- Daily , Weekly | |
| Add DDL to Watchlist: View: Get Complete DDL Trend Analysis ➞ | |
 | CIG Companhia Energetica de Minas Gerais |
| Sector: Utilities | |
| SubSector: Electric Utilities | |
| MarketCap: 3203.54 Millions | |
| Recent Price: 2.59 Smart Investing & Trading Score : 68 | |
| Day Percent Change: -0.38% Day Change: -0.01 | |
| Week Change: -1.89% Year-to-date Change: 11.6% | |
| CIG Links: Profile News Message Board | |
| Charts:- Daily , Weekly | |
| Add CIG to Watchlist: View: Get Complete CIG Trend Analysis ➞ | |
 | JD JD.com, Inc. |
| Sector: Technology | |
| SubSector: Internet Information Providers | |
| MarketCap: 59907.3 Millions | |
| Recent Price: 32.03 Smart Investing & Trading Score : 68 | |
| Day Percent Change: -0.31% Day Change: -0.10 | |
| Week Change: -2.56% Year-to-date Change: 10.9% | |
| JD Links: Profile News Message Board | |
| Charts:- Daily , Weekly | |
| Add JD to Watchlist: View: Get Complete JD Trend Analysis ➞ | |
 | WDH Waterdrop Inc. |
| Sector: Financials | |
| SubSector: Insurance - Diversified | |
| MarketCap: 874 Millions | |
| Recent Price: 1.16 Smart Investing & Trading Score : 28 | |
| Day Percent Change: -0.85% Day Change: -0.01 | |
| Week Change: 0.87% Year-to-date Change: 10.8% | |
| WDH Links: Profile News Message Board | |
| Charts:- Daily , Weekly | |
| Add WDH to Watchlist: View: Get Complete WDH Trend Analysis ➞ | |
 | ASX ASE Technology Holding Co., Ltd. |
| Sector: Technology | |
| SubSector: Semiconductor Equipment & Materials | |
| MarketCap: 8513.18 Millions | |
| Recent Price: 10.43 Smart Investing & Trading Score : 58 | |
| Day Percent Change: 0.34% Day Change: 0.04 | |
| Week Change: -1% Year-to-date Change: 10.8% | |
| ASX Links: Profile News Message Board | |
| Charts:- Daily , Weekly | |
| Add ASX to Watchlist: View: Get Complete ASX Trend Analysis ➞ | |
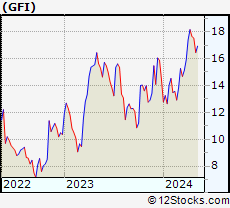 | GFI Gold Fields Limited |
| Sector: Materials | |
| SubSector: Gold | |
| MarketCap: 4908.39 Millions | |
| Recent Price: 16.00 Smart Investing & Trading Score : 46 | |
| Day Percent Change: 0.63% Day Change: 0.10 | |
| Week Change: -2.74% Year-to-date Change: 10.7% | |
| GFI Links: Profile News Message Board | |
| Charts:- Daily , Weekly | |
| Add GFI to Watchlist: View: Get Complete GFI Trend Analysis ➞ | |
| For tabular summary view of above stock list: Summary View ➞ 0 - 25 , 25 - 50 , 50 - 75 , 75 - 100 , 100 - 125 , 125 - 150 , 150 - 175 , 175 - 200 | ||
| Click To Change The Sort Order: By Market Cap or Company Size Performance: Year-to-date, Week and Day | |
| Select Chart Type: | ||
|
Best Stocks Today 12Stocks.com |
© 2024 12Stocks.com Terms & Conditions Privacy Contact Us
All Information Provided Only For Education And Not To Be Used For Investing or Trading. See Terms & Conditions


One More Thing ... Get Best Stocks Delivered Daily!
Never Ever Miss A Move With Our Top Ten Stocks Lists
Find Best Stocks In Any Market - Bull or Bear Market
Take A Peek At Our Top Ten Stocks Lists: Daily, Weekly, Year-to-Date & Top Trends
Find Best Stocks In Any Market - Bull or Bear Market
Take A Peek At Our Top Ten Stocks Lists: Daily, Weekly, Year-to-Date & Top Trends
Emerging Markets Stocks With Best Up Trends [0-bearish to 100-bullish]: BRF S.A[100], Autohome [100], Chunghwa Telecom[100], GreenTree Hospitality[100], ATRenew [100], Grupo Televisa[100], MINISO [95], DouYu [95], 21Vianet [95], Boqii Holding[93], Gogoro [93]
Best Emerging Markets Stocks Year-to-Date:
U Power[3142.19%], DouYu [926.32%], China Liberal[627.07%], Yatsen Holding[497.32%], MicroCloud Hologram[458.27%], Zhongchao [297.15%], Uxin [224.54%], GigaCloud [111.85%], QuantaSing [94.44%], Smart Share[93.98%], Cheetah Mobile[79.39%] Best Emerging Markets Stocks This Week:
China Liberal[18.18%], ATRenew [16.47%], Gogoro [14.94%], Smart Share[14.83%], BRF S.A[12.91%], Uxin [12.62%], Regencell Bioscience[12.2%], Boqii Holding[9.69%], Dingdong (Cayman)[9.24%], MOGU [8.74%], DouYu [7.5%] Best Emerging Markets Stocks Daily:
BRF S.A[11.90%], Hywin [11.14%], 36Kr [9.82%], MOGU [8.74%], Aurora Mobile[7.46%], Uxin [7.31%], Studio City[6.10%], Dingdong (Cayman)[5.86%], Burning Rock[4.66%], Aesthetic Medical[4.66%], Ambipar Emergency[4.58%]