
 Login Sign Up


| |||||
 |  | ||||

| 12Stocks.com Market Intelligence |
Best Emerging Markets Stocks
| In a hurry? Emerging Markets Stocks Lists: Trends Table, Stock Charts
Sort Emerging Markets stocks: Daily, Weekly, Year-to-Date, Market Cap & Trends. Filter Emerging Markets stocks list by sector: Show all, Tech, Finance, Energy, Staples, Retail, Industrial, Materials, Utilities and HealthCare Filter Emerging Markets stocks list by size:All Large Medium Small |
| 12Stocks.com Emerging Markets Stocks Performances & Trends Daily | |||||||||
|
|  The overall Smart Investing & Trading Score is 63 (0-bearish to 100-bullish) which puts Emerging Markets index in short term neutral to bullish trend. The Smart Investing & Trading Score from previous trading session is 49 and hence an improvement of trend.
| ||||||||
Here are the Smart Investing & Trading Scores of the most requested Emerging Markets stocks at 12Stocks.com (click stock name for detailed review):
|


| 12Stocks.com: Top Performing Emerging Markets Index Stocks | ||||||||||||||||||||||||||||||||||||||||||||||||
 The top performing Emerging Markets Index stocks year to date are
Now, more recently, over last week, the top performing Emerging Markets Index stocks on the move are


|
||||||||||||||||||||||||||||||||||||||||||||||||
| 12Stocks.com: Investing in Emerging Markets Index with Stocks | |
|
The following table helps investors and traders sort through current performance and trends (as measured by Smart Investing & Trading Score ) of various
stocks in the Emerging Markets Index. Quick View: Move mouse or cursor over stock symbol (ticker) to view short-term technical chart and over stock name to view long term chart. Click on  to add stock symbol to your watchlist and to add stock symbol to your watchlist and  to view watchlist. Click on any ticker or stock name for detailed market intelligence report for that stock. to view watchlist. Click on any ticker or stock name for detailed market intelligence report for that stock. |
12Stocks.com Performance of Stocks in Emerging Markets Index
| Ticker | Stock Name | Watchlist | Category | Recent Price | Smart Investing & Trading Score | Change % | YTD Change% |
| YJ | Yunji |   | Services & Goods | 0.74 | 41 | -0.34% | 4.52% |
| MNSO | MINISO | | Services & Goods | 21.21 | 76 | 3.44% | 3.97% |
| RDY | Dr. Reddy | | Health Care | 72.15 | 52 | 1.42% | 3.69% |
| SUZ | Suzano S.A | | Consumer Staples | 11.73 | 58 | -0.51% | 3.26% |
| IMOS | ChipMOS | | Technology | 27.88 | 41 | 0.25% | 2.46% |
| NTES | NetEase | | Technology | 94.88 | 49 | 1.47% | 1.85% |
| SY | So-Young | | Technology | 1.31 | 90 | 12.45% | 1.55% |
| EH | EHang | | Industrials | 17.00 | 46 | -2.91% | 1.19% |
| KOF | Coca-Cola FEMSA | | Consumer Staples | 94.96 | 40 | 1.68% | 0.34% |
| SVA | Sinovac Biotech | | Health Care | 6.47 | 27 | 0.00% | 0.00% |
| ATAT | Atour Lifestyle | | Services & Goods | 17.50 | 58 | 1.51% | -0.11% |
| AMX | America Movil | | Technology | 18.46 | 75 | 1.10% | -0.32% |
| DRD | DRDGOLD | | Materials | 7.91 | 36 | -7.49% | -0.50% |
| SIM | Grupo Simec | | Materials | 31.00 | 37 | 0.00% | -0.55% |
| BAK | Braskem S.A | | Materials | 8.76 | 22 | 1.27% | -0.68% |
| XIN | Xinyuan Real | | Financials | 2.70 | 17 | 3.85% | -0.74% |
| WIT | Wipro | | Technology | 5.52 | 49 | 5.14% | -0.90% |
| CHT | Chunghwa Telecom | | Technology | 38.54 | 78 | 1.82% | -1.36% |
| SMI | Semiconductor | | Technology | 45.72 | 43 | 0.00% | -1.57% |
| FINV | FinVolution | | Financials | 4.76 | 45 | 0.42% | -2.86% |
| BILI | Bilibili | | Technology | 11.74 | 100 | 7.61% | -3.53% |
| UGP | Ultrapar Participacoes | | Energy | 5.19 | 32 | 0.78% | -4.24% |
| VINP | Vi Partners | | Financials | 10.49 | 32 | 2.34% | -4.55% |
| ASAI | Sendas Distribuidora | | Consumer Staples | 13.11 | 32 | 1.63% | -4.97% |
| IMAB | I Mab | | Health Care | 1.80 | 48 | -0.55% | -5.26% |
| For chart view version of above stock list: Chart View ➞ 0 - 25 , 25 - 50 , 50 - 75 , 75 - 100 , 100 - 125 , 125 - 150 , 150 - 175 , 175 - 200 | ||
 | Click To Change The Sort Order: By Market Cap or Company Size Performance: Year-to-date, Week and Day |  |
|
Get the most comprehensive stock market coverage daily at 12Stocks.com ➞ Best Stocks Today ➞ Best Stocks Weekly ➞ Best Stocks Year-to-Date ➞ Best Stocks Trends ➞  Best Stocks Today 12Stocks.com Best Nasdaq Stocks ➞ Best S&P 500 Stocks ➞ Best Tech Stocks ➞ Best Biotech Stocks ➞ |
| Detailed Overview of Emerging Markets Stocks |
| Emerging Markets Technical Overview, Leaders & Laggards, Top Emerging Markets ETF Funds & Detailed Emerging Markets Stocks List, Charts, Trends & More |
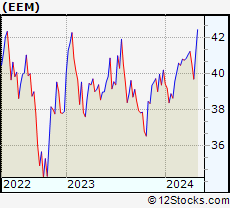
| Emerging Markets: Technical Analysis, Trends & YTD Performance | |
 EEM Weekly Chart |
|
| Long Term Trend: Very Good | |
| Medium Term Trend: Not Good | |
 EEM Daily Chart |
|
| Short Term Trend: Very Good | |
| Overall Trend Score: 63 | |
| YTD Performance: -0.17% | |
| **Trend Scores & Views Are Only For Educational Purposes And Not For Investing | |
| 12Stocks.com: Investing in Emerging Markets Index using Exchange Traded Funds | |
|
The following table shows list of key exchange traded funds (ETF) that
help investors play Emerging Markets stock market. For detailed view, check out our ETF Funds section of our website. Quick View: Move mouse or cursor over ETF symbol (ticker) to view short-term technical chart and over ETF name to view long term chart. Click on ticker or stock name for detailed view. Click on to add stock symbol to your watchlist and to view watchlist. |
12Stocks.com List of ETFs that track Emerging Markets Index
| Ticker | ETF Name | Watchlist | Recent Price | Smart Investing & Trading Score | Change % | Week % | Year-to-date % |
| EEM | Emerging Markets | | 40.14 | 63 | 1.08 | 1.08 | -0.17% |
| VWO | Emerging Markets | | 41.24 | 68 | 0.86 | 0.86 | 0.34% |
| SCHE | Emerging Markets Equity | | 24.91 | 68 | 0.89 | 0.89 | 0.48% |
| EWX | Emerging Markets Small | | 55.33 | 44 | 0.29 | 0.29 | -2% |
| EET | Emerging Markets | | 48.91 | 63 | 2.50 | 2.5 | -3.83% |
| EDC | Emrg Mkts Bull | | 27.98 | 63 | 3.36 | 3.36 | -8.05% |
| EEV | Short Emerging | | 20.10 | 32 | -2.04 | -2.04 | 1.91% |
| EUM | Short Emerging | | 14.34 | 32 | -1.05 | -1.05 | 1.34% |
| EDIV | Emerging Markets Dividend | | 32.97 | 51 | -0.12 | -0.12 | 1.38% |
| EMIF | Emerging Markets Infrastructure | | 21.57 | 68 | 0.89 | 0.89 | 0.79% |
| CEW | Emerging Currency Strat | | 17.61 | 38 | 0.03 | 0.03 | -2.19% |
| EBND | Em Mkts Lcl | | 19.94 | 25 | 0.05 | 0.05 | -6.12% |
| EMCB | Emerging Markets Corp | | 63.80 | 38 | 0.33 | 0.33 | -0.16% |
| VWOB | Emerging Mkts Govt | | 62.66 | 52 | 0.53 | 0.53 | -1.71% |
| EEMA | Emerging Markets Asia | | 66.75 | 68 | 1.01 | 1.01 | 0.98% |
| EELV | Em Mkts Low | | 23.34 | 45 | 0.80 | 0.8 | -2.89% |
| DVYE | Emerging Markets Dividend | | 26.52 | 88 | 0.15 | 0.15 | 0.11% |
| SDEM | SuperDividend Em Mkts | | 25.55 | 34 | -1.20 | -1.2 | 3.04% |
| DBEM | Em Mkts Hdgd | | 23.37 | 63 | 1.17 | 1.17 | 1.3% |
| PCY | Emerging Markets Sov | | 19.86 | 18 | 0.25 | 0.25 | -3.69% |
| QEMM | Emerging Mkts StratcFacts | | 56.42 | 56 | 0.46 | 0.46 | -1.29% |
| 12Stocks.com: Charts, Trends, Fundamental Data and Performances of Emerging Markets Stocks | |
|
We now take in-depth look at all Emerging Markets stocks including charts, multi-period performances and overall trends (as measured by Smart Investing & Trading Score ). One can sort Emerging Markets stocks (click link to choose) by Daily, Weekly and by Year-to-Date performances. Also, one can sort by size of the company or by market capitalization. |
| Select Your Default Chart Type: | |||||
| |||||
| Click on stock symbol or name for detailed view. Click on to add stock symbol to your watchlist and to view watchlist. Quick View: Move mouse or cursor over "Daily" to quickly view daily technical stock chart and over "Weekly" to view weekly technical stock chart. | |||||

 | YJ Yunji Inc. |
| Sector: Services & Goods | |
| SubSector: Specialty Retail, Other | |
| MarketCap: 770.644 Millions | |
| Recent Price: 0.74 Smart Investing & Trading Score : 41 | |
| Day Percent Change: -0.34% Day Change: 0.00 | |
| Week Change: -0.34% Year-to-date Change: 4.5% | |
| YJ Links: Profile News Message Board | |
| Charts:- Daily , Weekly | |
| Add YJ to Watchlist: View: Get Complete YJ Trend Analysis ➞ | |
 | MNSO MINISO Group Holding Limited |
| Sector: Services & Goods | |
| SubSector: Specialty Retail | |
| MarketCap: 69427 Millions | |
| Recent Price: 21.21 Smart Investing & Trading Score : 76 | |
| Day Percent Change: 3.44% Day Change: 0.71 | |
| Week Change: 3.44% Year-to-date Change: 4.0% | |
| MNSO Links: Profile News Message Board | |
| Charts:- Daily , Weekly | |
| Add MNSO to Watchlist: View: Get Complete MNSO Trend Analysis ➞ | |
 | RDY Dr. Reddy s Laboratories Limited |
| Sector: Health Care | |
| SubSector: Drug Manufacturers - Other | |
| MarketCap: 6590.23 Millions | |
| Recent Price: 72.15 Smart Investing & Trading Score : 52 | |
| Day Percent Change: 1.42% Day Change: 1.01 | |
| Week Change: 1.42% Year-to-date Change: 3.7% | |
| RDY Links: Profile News Message Board | |
| Charts:- Daily , Weekly | |
| Add RDY to Watchlist: View: Get Complete RDY Trend Analysis ➞ | |
 | SUZ Suzano S.A. |
| Sector: Consumer Staples | |
| SubSector: Paper & Paper Products | |
| MarketCap: 7042.93 Millions | |
| Recent Price: 11.73 Smart Investing & Trading Score : 58 | |
| Day Percent Change: -0.51% Day Change: -0.06 | |
| Week Change: -0.51% Year-to-date Change: 3.3% | |
| SUZ Links: Profile News Message Board | |
| Charts:- Daily , Weekly | |
| Add SUZ to Watchlist: View: Get Complete SUZ Trend Analysis ➞ | |
 | IMOS ChipMOS TECHNOLOGIES INC. |
| Sector: Technology | |
| SubSector: Semiconductor Equipment & Materials | |
| MarketCap: 658.918 Millions | |
| Recent Price: 27.88 Smart Investing & Trading Score : 41 | |
| Day Percent Change: 0.25% Day Change: 0.07 | |
| Week Change: 0.25% Year-to-date Change: 2.5% | |
| IMOS Links: Profile News Message Board | |
| Charts:- Daily , Weekly | |
| Add IMOS to Watchlist: View: Get Complete IMOS Trend Analysis ➞ | |
 | NTES NetEase, Inc. |
| Sector: Technology | |
| SubSector: Internet Software & Services | |
| MarketCap: 40105.1 Millions | |
| Recent Price: 94.88 Smart Investing & Trading Score : 49 | |
| Day Percent Change: 1.47% Day Change: 1.37 | |
| Week Change: 1.47% Year-to-date Change: 1.9% | |
| NTES Links: Profile News Message Board | |
| Charts:- Daily , Weekly | |
| Add NTES to Watchlist: View: Get Complete NTES Trend Analysis ➞ | |
 | SY So-Young International Inc. |
| Sector: Technology | |
| SubSector: Healthcare Information Services | |
| MarketCap: 1000.55 Millions | |
| Recent Price: 1.31 Smart Investing & Trading Score : 90 | |
| Day Percent Change: 12.45% Day Change: 0.15 | |
| Week Change: 12.45% Year-to-date Change: 1.6% | |
| SY Links: Profile News Message Board | |
| Charts:- Daily , Weekly | |
| Add SY to Watchlist: View: Get Complete SY Trend Analysis ➞ | |
 | EH EHang Holdings Limited |
| Sector: Industrials | |
| SubSector: Aerospace/Defense Products & Services | |
| MarketCap: 513.401 Millions | |
| Recent Price: 17.00 Smart Investing & Trading Score : 46 | |
| Day Percent Change: -2.91% Day Change: -0.51 | |
| Week Change: -2.91% Year-to-date Change: 1.2% | |
| EH Links: Profile News Message Board | |
| Charts:- Daily , Weekly | |
| Add EH to Watchlist: View: Get Complete EH Trend Analysis ➞ | |
 | KOF Coca-Cola FEMSA, S.A.B. de C.V. |
| Sector: Consumer Staples | |
| SubSector: Beverages - Soft Drinks | |
| MarketCap: 2258.9 Millions | |
| Recent Price: 94.96 Smart Investing & Trading Score : 40 | |
| Day Percent Change: 1.68% Day Change: 1.57 | |
| Week Change: 1.68% Year-to-date Change: 0.3% | |
| KOF Links: Profile News Message Board | |
| Charts:- Daily , Weekly | |
| Add KOF to Watchlist: View: Get Complete KOF Trend Analysis ➞ | |
 | SVA Sinovac Biotech Ltd. |
| Sector: Health Care | |
| SubSector: Biotechnology | |
| MarketCap: 336.88 Millions | |
| Recent Price: 6.47 Smart Investing & Trading Score : 27 | |
| Day Percent Change: 0.00% Day Change: 0.00 | |
| Week Change: 0% Year-to-date Change: 0.0% | |
| SVA Links: Profile News Message Board | |
| Charts:- Daily , Weekly | |
| Add SVA to Watchlist: View: Get Complete SVA Trend Analysis ➞ | |
 | ATAT Atour Lifestyle Holdings Limited |
| Sector: Services & Goods | |
| SubSector: Lodging | |
| MarketCap: 2120 Millions | |
| Recent Price: 17.50 Smart Investing & Trading Score : 58 | |
| Day Percent Change: 1.51% Day Change: 0.26 | |
| Week Change: 1.51% Year-to-date Change: -0.1% | |
| ATAT Links: Profile News Message Board | |
| Charts:- Daily , Weekly | |
| Add ATAT to Watchlist: View: Get Complete ATAT Trend Analysis ➞ | |
 | AMX America Movil, S.A.B. de C.V. |
| Sector: Technology | |
| SubSector: Wireless Communications | |
| MarketCap: 44726.6 Millions | |
| Recent Price: 18.46 Smart Investing & Trading Score : 75 | |
| Day Percent Change: 1.10% Day Change: 0.20 | |
| Week Change: 1.1% Year-to-date Change: -0.3% | |
| AMX Links: Profile News Message Board | |
| Charts:- Daily , Weekly | |
| Add AMX to Watchlist: View: Get Complete AMX Trend Analysis ➞ | |
 | DRD DRDGOLD Limited |
| Sector: Materials | |
| SubSector: Gold | |
| MarketCap: 556.919 Millions | |
| Recent Price: 7.91 Smart Investing & Trading Score : 36 | |
| Day Percent Change: -7.49% Day Change: -0.64 | |
| Week Change: -7.49% Year-to-date Change: -0.5% | |
| DRD Links: Profile News Message Board | |
| Charts:- Daily , Weekly | |
| Add DRD to Watchlist: View: Get Complete DRD Trend Analysis ➞ | |
 | SIM Grupo Simec, S.A.B. de C.V. |
| Sector: Materials | |
| SubSector: Steel & Iron | |
| MarketCap: 1418.28 Millions | |
| Recent Price: 31.00 Smart Investing & Trading Score : 37 | |
| Day Percent Change: 0.00% Day Change: 0.00 | |
| Week Change: 0% Year-to-date Change: -0.6% | |
| SIM Links: Profile News Message Board | |
| Charts:- Daily , Weekly | |
| Add SIM to Watchlist: View: Get Complete SIM Trend Analysis ➞ | |
 | BAK Braskem S.A. |
| Sector: Materials | |
| SubSector: Chemicals - Major Diversified | |
| MarketCap: 2715.86 Millions | |
| Recent Price: 8.76 Smart Investing & Trading Score : 22 | |
| Day Percent Change: 1.27% Day Change: 0.11 | |
| Week Change: 1.27% Year-to-date Change: -0.7% | |
| BAK Links: Profile News Message Board | |
| Charts:- Daily , Weekly | |
| Add BAK to Watchlist: View: Get Complete BAK Trend Analysis ➞ | |
 | XIN Xinyuan Real Estate Co., Ltd. |
| Sector: Financials | |
| SubSector: Real Estate Development | |
| MarketCap: 136.119 Millions | |
| Recent Price: 2.70 Smart Investing & Trading Score : 17 | |
| Day Percent Change: 3.85% Day Change: 0.10 | |
| Week Change: 3.85% Year-to-date Change: -0.7% | |
| XIN Links: Profile News Message Board | |
| Charts:- Daily , Weekly | |
| Add XIN to Watchlist: View: Get Complete XIN Trend Analysis ➞ | |
 | WIT Wipro Limited |
| Sector: Technology | |
| SubSector: Information Technology Services | |
| MarketCap: 15101.3 Millions | |
| Recent Price: 5.52 Smart Investing & Trading Score : 49 | |
| Day Percent Change: 5.14% Day Change: 0.27 | |
| Week Change: 5.14% Year-to-date Change: -0.9% | |
| WIT Links: Profile News Message Board | |
| Charts:- Daily , Weekly | |
| Add WIT to Watchlist: View: Get Complete WIT Trend Analysis ➞ | |
 | CHT Chunghwa Telecom Co., Ltd. |
| Sector: Technology | |
| SubSector: Telecom Services - Domestic | |
| MarketCap: 28101.3 Millions | |
| Recent Price: 38.54 Smart Investing & Trading Score : 78 | |
| Day Percent Change: 1.82% Day Change: 0.69 | |
| Week Change: 1.82% Year-to-date Change: -1.4% | |
| CHT Links: Profile News Message Board | |
| Charts:- Daily , Weekly | |
| Add CHT to Watchlist: View: Get Complete CHT Trend Analysis ➞ | |
 | SMI Semiconductor Manufacturing International Corporation |
| Sector: Technology | |
| SubSector: Semiconductor - Integrated Circuits | |
| MarketCap: 6287.56 Millions | |
| Recent Price: 45.72 Smart Investing & Trading Score : 43 | |
| Day Percent Change: 0.00% Day Change: 0.00 | |
| Week Change: 0% Year-to-date Change: -1.6% | |
| SMI Links: Profile News Message Board | |
| Charts:- Daily , Weekly | |
| Add SMI to Watchlist: View: Get Complete SMI Trend Analysis ➞ | |
 | FINV FinVolution Group |
| Sector: Financials | |
| SubSector: Credit Services | |
| MarketCap: 476.208 Millions | |
| Recent Price: 4.76 Smart Investing & Trading Score : 45 | |
| Day Percent Change: 0.42% Day Change: 0.02 | |
| Week Change: 0.42% Year-to-date Change: -2.9% | |
| FINV Links: Profile News Message Board | |
| Charts:- Daily , Weekly | |
| Add FINV to Watchlist: View: Get Complete FINV Trend Analysis ➞ | |
 | BILI Bilibili Inc. |
| Sector: Technology | |
| SubSector: Internet Information Providers | |
| MarketCap: 7043.1 Millions | |
| Recent Price: 11.74 Smart Investing & Trading Score : 100 | |
| Day Percent Change: 7.61% Day Change: 0.83 | |
| Week Change: 7.61% Year-to-date Change: -3.5% | |
| BILI Links: Profile News Message Board | |
| Charts:- Daily , Weekly | |
| Add BILI to Watchlist: View: Get Complete BILI Trend Analysis ➞ | |
 | UGP Ultrapar Participacoes S.A. |
| Sector: Energy | |
| SubSector: Oil & Gas Refining & Marketing | |
| MarketCap: 3473.54 Millions | |
| Recent Price: 5.19 Smart Investing & Trading Score : 32 | |
| Day Percent Change: 0.78% Day Change: 0.04 | |
| Week Change: 0.78% Year-to-date Change: -4.2% | |
| UGP Links: Profile News Message Board | |
| Charts:- Daily , Weekly | |
| Add UGP to Watchlist: View: Get Complete UGP Trend Analysis ➞ | |
 | VINP Vinci Partners Investments Ltd. |
| Sector: Financials | |
| SubSector: Asset Management | |
| MarketCap: 537 Millions | |
| Recent Price: 10.49 Smart Investing & Trading Score : 32 | |
| Day Percent Change: 2.34% Day Change: 0.24 | |
| Week Change: 2.34% Year-to-date Change: -4.6% | |
| VINP Links: Profile News Message Board | |
| Charts:- Daily , Weekly | |
| Add VINP to Watchlist: View: Get Complete VINP Trend Analysis ➞ | |
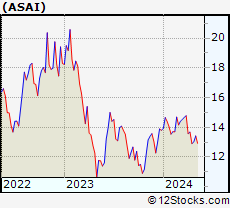 | ASAI Sendas Distribuidora S.A. |
| Sector: Consumer Staples | |
| SubSector: Grocery Stores | |
| MarketCap: 3790 Millions | |
| Recent Price: 13.11 Smart Investing & Trading Score : 32 | |
| Day Percent Change: 1.63% Day Change: 0.21 | |
| Week Change: 1.63% Year-to-date Change: -5.0% | |
| ASAI Links: Profile News Message Board | |
| Charts:- Daily , Weekly | |
| Add ASAI to Watchlist: View: Get Complete ASAI Trend Analysis ➞ | |
 | IMAB I Mab |
| Sector: Health Care | |
| SubSector: Biotechnology | |
| MarketCap: 26187 Millions | |
| Recent Price: 1.80 Smart Investing & Trading Score : 48 | |
| Day Percent Change: -0.55% Day Change: -0.01 | |
| Week Change: -0.55% Year-to-date Change: -5.3% | |
| IMAB Links: Profile News Message Board | |
| Charts:- Daily , Weekly | |
| Add IMAB to Watchlist: View: Get Complete IMAB Trend Analysis ➞ | |
| For tabular summary view of above stock list: Summary View ➞ 0 - 25 , 25 - 50 , 50 - 75 , 75 - 100 , 100 - 125 , 125 - 150 , 150 - 175 , 175 - 200 | ||
| Click To Change The Sort Order: By Market Cap or Company Size Performance: Year-to-date, Week and Day | |
| Select Chart Type: | ||
|
Best Stocks Today 12Stocks.com |
© 2024 12Stocks.com Terms & Conditions Privacy Contact Us
All Information Provided Only For Education And Not To Be Used For Investing or Trading. See Terms & Conditions


One More Thing ... Get Best Stocks Delivered Daily!
Never Ever Miss A Move With Our Top Ten Stocks Lists
Find Best Stocks In Any Market - Bull or Bear Market
Take A Peek At Our Top Ten Stocks Lists: Daily, Weekly, Year-to-Date & Top Trends
Find Best Stocks In Any Market - Bull or Bear Market
Take A Peek At Our Top Ten Stocks Lists: Daily, Weekly, Year-to-Date & Top Trends
Emerging Markets Stocks With Best Up Trends [0-bearish to 100-bullish]: Bilibili [100], JD.com [100], MOGU [100], Controladora Vuela[100], Full Truck[100], So-Young [90], TAL Education[90], Tencent Music[90], New Oriental[90], ICICI Bank[90], Lufax Holding[90]
Best Emerging Markets Stocks Year-to-Date:
U Power[2612.05%], DouYu [772.63%], MicroCloud Hologram[659.71%], China Liberal[509.62%], Yatsen Holding[419.41%], Zhongchao [335.5%], Uxin [116.83%], GigaCloud [102.57%], QuantaSing [102.47%], Cheetah Mobile[63.6%], Bright Scholar[61.6%] Best Emerging Markets Stocks This Week:
Regencell Bioscience[16.04%], So-Young [12.45%], Pinduoduo [9.38%], Hywin [8.88%], Vitru [7.87%], Fangdd Network[7.74%], Bilibili [7.61%], Burning Rock[7.5%], GigaCloud [6.92%], Niu [6.46%], Zai Lab[6.46%] Best Emerging Markets Stocks Daily:
Regencell Bioscience[16.04%], So-Young [12.45%], Pinduoduo [9.38%], Hywin [8.88%], Vitru [7.87%], Fangdd Network[7.74%], Bilibili [7.61%], Burning Rock[7.50%], GigaCloud [6.92%], Niu [6.46%], Zai Lab[6.46%]