
 Login Sign Up


| |||||
 |  | ||||

| 12Stocks.com Market Intelligence |
Best Consumer Services Stocks
| In a hurry? Services & Goods Stocks: Performance Trends Table, Stock Charts
Sort Consumer Services: Daily, Weekly, Year-to-Date, Market Cap & Trends. Filter Services & Goods stocks list by size: All Large Mid-Range Small |
| 12Stocks.com Consumer Services Stocks Performances & Trends Daily | |||||||||
|
|  The overall Smart Investing & Trading Score is 64 (0-bearish to 100-bullish) which puts Consumer Services sector in short term neutral to bullish trend. The Smart Investing & Trading Score from previous trading session is 57 and hence an improvement of trend.
| ||||||||
Here are the Smart Investing & Trading Scores of the most requested Consumer Services stocks at 12Stocks.com (click stock name for detailed review):
|


| Consider signing up for our daily 12Stocks.com "Best Stocks Newsletter". You will never ever miss a big stock move again! |
| 12Stocks.com: Investing in Consumer Services sector with Stocks | |
|
The following table helps investors and traders sort through current performance and trends (as measured by Smart Investing & Trading Score) of various
stocks in the Consumer Services sector. Quick View: Move mouse or cursor over stock symbol (ticker) to view short-term Technical chart and over stock name to view long term chart. Click on  to add stock symbol to your watchlist and to add stock symbol to your watchlist and  to view watchlist. Click on any ticker or stock name for detailed market intelligence report for that stock. to view watchlist. Click on any ticker or stock name for detailed market intelligence report for that stock. |
12Stocks.com Performance of Stocks in Consumer Services Sector
| Ticker | Stock Name | Watchlist | Category | Recent Price | Smart Investing & Trading Score | Change % | YTD Change% |
| GGR | Gogoro |   | Auto Parts | 1.51 | 27 | -1.95% | -41.92% |
| ASPS | Altisource Portfolio | | Services | 2.06 | 64 | 0.49% | -42.13% |
| PENN | Penn National | | Casinos | 14.93 | 10 | -1.32% | -42.64% |
| SIRI | Sirius XM | | Broadcasting | 3.13 | 57 | 0.48% | -42.69% |
| HSAI | Hesai | | Auto Parts | 5.17 | 100 | 0.49% | -43.01% |
| VMAR | Vision Marine | | Leisure | 0.60 | 27 | -2.01% | -44.73% |
| SSP | E.W. Scripps | | Broadcasting | 4.37 | 100 | 2.34% | -45.31% |
| EVGO | EVgo | | Specialty Retail | 1.94 | 67 | -0.26% | -45.89% |
| EVC | Entravision | | Broadcasting | 2.25 | 64 | 0.00% | -46.04% |
| LANV | Lanvin | | Luxury Goods | 1.61 | 27 | 0.63% | -47.39% |
| AMC | AMC Entertainment | | Entertainment | 3.12 | 60 | -5.45% | -49.02% |
| WOOF | Petco Health | | Specialty Retail | 1.58 | 47 | 1.61% | -50.16% |
| BIRD | Allbirds | | Apparel Retail | 0.61 | 50 | -2.41% | -50.33% |
| UONEK | Urban One | | Broadcasting | 1.67 | 59 | 0.00% | -51.45% |
| GDHG | Golden Heaven | | Leisure | 0.35 | 44 | 7.34% | -51.92% |
| BIG | Big Lots | | Retail | 3.66 | 59 | 1.95% | -53.02% |
| CHGG | Chegg | | Education | 5.25 | 27 | 0.10% | -53.83% |
| LL | Lumber Liquidators | | Retail | 1.69 | 59 | 1.81% | -56.67% |
| TCS | Container Store | | Retail | 0.90 | 52 | 0.57% | -60.74% |
| MED | Medifast | | Retail | 26.16 | 17 | -2.00% | -61.09% |
| PLCE | Children s | | Apparel | 7.54 | 50 | -3.08% | -67.53% |
| ICLK | iClick Interactive | | Marketing | 1.24 | 25 | 0.00% | -67.62% |
| DTC | Solo Brands | | Internet Retail | 1.96 | 64 | -2.24% | -68.39% |
| NOVA | Sunnova Energy | | Services | 4.70 | 67 | -1.88% | -69.18% |
| AUVI | Applied UV | | Furnishings, Fixtures & Appliances | 0.60 | 35 | -0.43% | -74.25% |
| For chart view version of above stock list: Chart View ➞ 0 - 25 , 25 - 50 , 50 - 75 , 75 - 100 , 100 - 125 , 125 - 150 , 150 - 175 , 175 - 200 , 200 - 225 , 225 - 250 , 250 - 275 , 275 - 300 , 300 - 325 , 325 - 350 , 350 - 375 , 375 - 400 , 400 - 425 , 425 - 450 | ||
 | Click To Change The Sort Order: By Market Cap or Company Size Performance: Year-to-date, Week and Day |  |
|
Get the most comprehensive stock market coverage daily at 12Stocks.com ➞ Best Stocks Today ➞ Best Stocks Weekly ➞ Best Stocks Year-to-Date ➞ Best Stocks Trends ➞  Best Stocks Today 12Stocks.com Best Nasdaq Stocks ➞ Best S&P 500 Stocks ➞ Best Tech Stocks ➞ Best Biotech Stocks ➞ |
| Detailed Overview of Consumer Services Stocks |
| Consumer Services Technical Overview, Leaders & Laggards, Top Consumer Services ETF Funds & Detailed Consumer Services Stocks List, Charts, Trends & More |
| Consumer Services Sector: Technical Analysis, Trends & YTD Performance | |
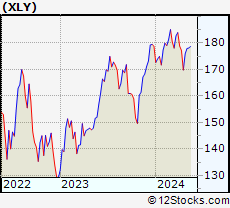
| Consumer Services sector is composed of stocks
from retail, entertainment, media/publishing, consumer goods
and services subsectors. Consumer Services sector, as represented by XLY, an exchange-traded fund [ETF] that holds basket of Consumer Services stocks (e.g, Walmart, Alibaba) is up by 0.25% and is currently underperforming the overall market by -7.28% year-to-date. Below is a quick view of Technical charts and trends: |
|
 XLY Weekly Chart |
|
| Long Term Trend: Not Good | |
| Medium Term Trend: Very Good | |
 XLY Daily Chart |
|
| Short Term Trend: Very Good | |
| Overall Trend Score: 64 | |
| YTD Performance: 0.25% | |
| **Trend Scores & Views Are Only For Educational Purposes And Not For Investing | |
| 12Stocks.com: Top Performing Consumer Services Sector Stocks | ||||||||||||||||||||||||||||||||||||||||||||||||
 The top performing Consumer Services sector stocks year to date are
Now, more recently, over last week, the top performing Consumer Services sector stocks on the move are


|
||||||||||||||||||||||||||||||||||||||||||||||||
| 12Stocks.com: Investing in Consumer Services Sector using Exchange Traded Funds | |
|
The following table shows list of key exchange traded funds (ETF) that
help investors track Consumer Services Index. For detailed view, check out our ETF Funds section of our website. Quick View: Move mouse or cursor over ETF symbol (ticker) to view short-term Technical chart and over ETF name to view long term chart. Click on ticker or stock name for detailed view. Click on to add stock symbol to your watchlist and to view watchlist. |
12Stocks.com List of ETFs that track Consumer Services Index
| Ticker | ETF Name | Watchlist | Recent Price | Smart Investing & Trading Score | Change % | Week % | Year-to-date % |
| XLY | Consumer Discret Sel | | 179.25 | 64 | 0.75 | 0.75 | 0.25% |
| RTH | Retail | | 200.30 | 40 | -0.11 | -0.11 | 6.41% |
| IYC | Consumer Services | | 79.61 | 57 | 0.66 | 0.66 | 5.07% |
| XRT | Retail | | 74.22 | 69 | 1.09 | 1.09 | 2.63% |
| IYK | Consumer Goods | | 66.51 | 71 | -0.12 | -0.12 | 4.08% |
| UCC | Consumer Services | | 34.75 | 64 | 2.01 | 2.01 | -3.22% |
| RETL | Retail Bull 3X | | 9.06 | 59 | 2.60 | 2.6 | -0.66% |
| RXI | Globl Consumer Discretionary | | 163.04 | 64 | -0.04 | -0.04 | 2.5% |
| SCC | Short Consumer Services | | 15.35 | 36 | -0.23 | -0.23 | 0.17% |
| UGE | Consumer Goods | | 17.24 | 90 | -0.17 | -0.17 | 9.52% |
| 12Stocks.com: Charts, Trends, Fundamental Data and Performances of Consumer Services Stocks | |
|
We now take in-depth look at all Consumer Services stocks including charts, multi-period performances and overall trends (as measured by Smart Investing & Trading Score). One can sort Consumer Services stocks (click link to choose) by Daily, Weekly and by Year-to-Date performances. Also, one can sort by size of the company or by market capitalization. |
| Select Your Default Chart Type: | |||||
| |||||
| Click on stock symbol or name for detailed view. Click on to add stock symbol to your watchlist and to view watchlist. Quick View: Move mouse or cursor over "Daily" to quickly view daily Technical stock chart and over "Weekly" to view weekly Technical stock chart. | |||||

 | GGR Gogoro Inc. |
| Sector: Services & Goods | |
| SubSector: Auto Parts | |
| MarketCap: 856 Millions | |
| Recent Price: 1.51 Smart Investing & Trading Score: 27 | |
| Day Percent Change: -1.95% Day Change: -0.03 | |
| Week Change: -1.95% Year-to-date Change: -41.9% | |
| GGR Links: Profile News Message Board | |
| Charts:- Daily , Weekly | |
| Add GGR to Watchlist: View: Get Complete GGR Trend Analysis ➞ | |
 | ASPS Altisource Portfolio Solutions S.A. |
| Sector: Services & Goods | |
| SubSector: Business Services | |
| MarketCap: 120.382 Millions | |
| Recent Price: 2.06 Smart Investing & Trading Score: 64 | |
| Day Percent Change: 0.49% Day Change: 0.01 | |
| Week Change: 0.49% Year-to-date Change: -42.1% | |
| ASPS Links: Profile News Message Board | |
| Charts:- Daily , Weekly | |
| Add ASPS to Watchlist: View: Get Complete ASPS Trend Analysis ➞ | |
 | PENN Penn National Gaming, Inc. |
| Sector: Services & Goods | |
| SubSector: Resorts & Casinos | |
| MarketCap: 1183.84 Millions | |
| Recent Price: 14.93 Smart Investing & Trading Score: 10 | |
| Day Percent Change: -1.32% Day Change: -0.20 | |
| Week Change: -1.32% Year-to-date Change: -42.6% | |
| PENN Links: Profile News Message Board | |
| Charts:- Daily , Weekly | |
| Add PENN to Watchlist: View: Get Complete PENN Trend Analysis ➞ | |
 | SIRI Sirius XM Holdings Inc. |
| Sector: Services & Goods | |
| SubSector: Broadcasting - Radio | |
| MarketCap: 21325.5 Millions | |
| Recent Price: 3.13 Smart Investing & Trading Score: 57 | |
| Day Percent Change: 0.48% Day Change: 0.01 | |
| Week Change: 0.48% Year-to-date Change: -42.7% | |
| SIRI Links: Profile News Message Board | |
| Charts:- Daily , Weekly | |
| Add SIRI to Watchlist: View: Get Complete SIRI Trend Analysis ➞ | |
 | HSAI Hesai Group |
| Sector: Services & Goods | |
| SubSector: Auto Parts | |
| MarketCap: 1330 Millions | |
| Recent Price: 5.17 Smart Investing & Trading Score: 100 | |
| Day Percent Change: 0.49% Day Change: 0.02 | |
| Week Change: 0.49% Year-to-date Change: -43.0% | |
| HSAI Links: Profile News Message Board | |
| Charts:- Daily , Weekly | |
| Add HSAI to Watchlist: View: Get Complete HSAI Trend Analysis ➞ | |
 | VMAR Vision Marine Technologies Inc. |
| Sector: Services & Goods | |
| SubSector: Leisure | |
| MarketCap: 99027 Millions | |
| Recent Price: 0.60 Smart Investing & Trading Score: 27 | |
| Day Percent Change: -2.01% Day Change: -0.01 | |
| Week Change: -2.01% Year-to-date Change: -44.7% | |
| VMAR Links: Profile News Message Board | |
| Charts:- Daily , Weekly | |
| Add VMAR to Watchlist: View: Get Complete VMAR Trend Analysis ➞ | |
 | SSP The E.W. Scripps Company |
| Sector: Services & Goods | |
| SubSector: Broadcasting - TV | |
| MarketCap: 766.163 Millions | |
| Recent Price: 4.37 Smart Investing & Trading Score: 100 | |
| Day Percent Change: 2.34% Day Change: 0.10 | |
| Week Change: 2.34% Year-to-date Change: -45.3% | |
| SSP Links: Profile News Message Board | |
| Charts:- Daily , Weekly | |
| Add SSP to Watchlist: View: Get Complete SSP Trend Analysis ➞ | |
 | EVGO EVgo, Inc. |
| Sector: Services & Goods | |
| SubSector: Specialty Retail | |
| MarketCap: 1140 Millions | |
| Recent Price: 1.94 Smart Investing & Trading Score: 67 | |
| Day Percent Change: -0.26% Day Change: -0.01 | |
| Week Change: -0.26% Year-to-date Change: -45.9% | |
| EVGO Links: Profile News Message Board | |
| Charts:- Daily , Weekly | |
| Add EVGO to Watchlist: View: Get Complete EVGO Trend Analysis ➞ | |
 | EVC Entravision Communications Corporation |
| Sector: Services & Goods | |
| SubSector: Broadcasting - TV | |
| MarketCap: 171.763 Millions | |
| Recent Price: 2.25 Smart Investing & Trading Score: 64 | |
| Day Percent Change: 0.00% Day Change: 0.00 | |
| Week Change: 0% Year-to-date Change: -46.0% | |
| EVC Links: Profile News Message Board | |
| Charts:- Daily , Weekly | |
| Add EVC to Watchlist: View: Get Complete EVC Trend Analysis ➞ | |
 | LANV Lanvin Group Holdings Limited |
| Sector: Services & Goods | |
| SubSector: Luxury Goods | |
| MarketCap: 712 Millions | |
| Recent Price: 1.61 Smart Investing & Trading Score: 27 | |
| Day Percent Change: 0.63% Day Change: 0.01 | |
| Week Change: 0.63% Year-to-date Change: -47.4% | |
| LANV Links: Profile News Message Board | |
| Charts:- Daily , Weekly | |
| Add LANV to Watchlist: View: Get Complete LANV Trend Analysis ➞ | |
 | AMC AMC Entertainment Holdings, Inc. |
| Sector: Services & Goods | |
| SubSector: Movie Production, Theaters | |
| MarketCap: 415.929 Millions | |
| Recent Price: 3.12 Smart Investing & Trading Score: 60 | |
| Day Percent Change: -5.45% Day Change: -0.18 | |
| Week Change: -5.45% Year-to-date Change: -49.0% | |
| AMC Links: Profile News Message Board | |
| Charts:- Daily , Weekly | |
| Add AMC to Watchlist: View: Get Complete AMC Trend Analysis ➞ | |
 | WOOF Petco Health and Wellness Company, Inc. |
| Sector: Services & Goods | |
| SubSector: Specialty Retail | |
| MarketCap: 2030 Millions | |
| Recent Price: 1.58 Smart Investing & Trading Score: 47 | |
| Day Percent Change: 1.61% Day Change: 0.02 | |
| Week Change: 1.61% Year-to-date Change: -50.2% | |
| WOOF Links: Profile News Message Board | |
| Charts:- Daily , Weekly | |
| Add WOOF to Watchlist: View: Get Complete WOOF Trend Analysis ➞ | |
 | BIRD Allbirds, Inc. |
| Sector: Services & Goods | |
| SubSector: Apparel Retail | |
| MarketCap: 184 Millions | |
| Recent Price: 0.61 Smart Investing & Trading Score: 50 | |
| Day Percent Change: -2.41% Day Change: -0.02 | |
| Week Change: -2.41% Year-to-date Change: -50.3% | |
| BIRD Links: Profile News Message Board | |
| Charts:- Daily , Weekly | |
| Add BIRD to Watchlist: View: Get Complete BIRD Trend Analysis ➞ | |
 | UONEK Urban One, Inc. |
| Sector: Services & Goods | |
| SubSector: Broadcasting - Radio | |
| MarketCap: 601.795 Millions | |
| Recent Price: 1.67 Smart Investing & Trading Score: 59 | |
| Day Percent Change: 0.00% Day Change: 0.00 | |
| Week Change: 0% Year-to-date Change: -51.5% | |
| UONEK Links: Profile News Message Board | |
| Charts:- Daily , Weekly | |
| Add UONEK to Watchlist: View: Get Complete UONEK Trend Analysis ➞ | |
 | GDHG Golden Heaven Group Holdings Ltd. |
| Sector: Services & Goods | |
| SubSector: Leisure | |
| MarketCap: 230 Millions | |
| Recent Price: 0.35 Smart Investing & Trading Score: 44 | |
| Day Percent Change: 7.34% Day Change: 0.02 | |
| Week Change: 7.34% Year-to-date Change: -51.9% | |
| GDHG Links: Profile News Message Board | |
| Charts:- Daily , Weekly | |
| Add GDHG to Watchlist: View: Get Complete GDHG Trend Analysis ➞ | |
 | BIG Big Lots, Inc. |
| Sector: Services & Goods | |
| SubSector: Discount, Variety Stores | |
| MarketCap: 603.572 Millions | |
| Recent Price: 3.66 Smart Investing & Trading Score: 59 | |
| Day Percent Change: 1.95% Day Change: 0.07 | |
| Week Change: 1.95% Year-to-date Change: -53.0% | |
| BIG Links: Profile News Message Board | |
| Charts:- Daily , Weekly | |
| Add BIG to Watchlist: View: Get Complete BIG Trend Analysis ➞ | |
 | CHGG Chegg, Inc. |
| Sector: Services & Goods | |
| SubSector: Education & Training Services | |
| MarketCap: 3606.86 Millions | |
| Recent Price: 5.25 Smart Investing & Trading Score: 27 | |
| Day Percent Change: 0.10% Day Change: 0.00 | |
| Week Change: 0.1% Year-to-date Change: -53.8% | |
| CHGG Links: Profile News Message Board | |
| Charts:- Daily , Weekly | |
| Add CHGG to Watchlist: View: Get Complete CHGG Trend Analysis ➞ | |
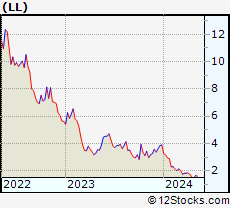 | LL Lumber Liquidators Holdings, Inc. |
| Sector: Services & Goods | |
| SubSector: Home Improvement Stores | |
| MarketCap: 143.352 Millions | |
| Recent Price: 1.69 Smart Investing & Trading Score: 59 | |
| Day Percent Change: 1.81% Day Change: 0.03 | |
| Week Change: 1.81% Year-to-date Change: -56.7% | |
| LL Links: Profile News Message Board | |
| Charts:- Daily , Weekly | |
| Add LL to Watchlist: View: Get Complete LL Trend Analysis ➞ | |
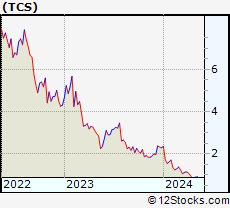 | TCS The Container Store Group, Inc. |
| Sector: Services & Goods | |
| SubSector: Specialty Retail, Other | |
| MarketCap: 142.644 Millions | |
| Recent Price: 0.90 Smart Investing & Trading Score: 52 | |
| Day Percent Change: 0.57% Day Change: 0.01 | |
| Week Change: 0.57% Year-to-date Change: -60.7% | |
| TCS Links: Profile News Message Board | |
| Charts:- Daily , Weekly | |
| Add TCS to Watchlist: View: Get Complete TCS Trend Analysis ➞ | |
 | MED Medifast, Inc. |
| Sector: Services & Goods | |
| SubSector: Specialty Retail, Other | |
| MarketCap: 681.044 Millions | |
| Recent Price: 26.16 Smart Investing & Trading Score: 17 | |
| Day Percent Change: -2.00% Day Change: -0.54 | |
| Week Change: -2% Year-to-date Change: -61.1% | |
| MED Links: Profile News Message Board | |
| Charts:- Daily , Weekly | |
| Add MED to Watchlist: View: Get Complete MED Trend Analysis ➞ | |
 | PLCE The Children s Place, Inc. |
| Sector: Services & Goods | |
| SubSector: Apparel Stores | |
| MarketCap: 303.608 Millions | |
| Recent Price: 7.54 Smart Investing & Trading Score: 50 | |
| Day Percent Change: -3.08% Day Change: -0.24 | |
| Week Change: -3.08% Year-to-date Change: -67.5% | |
| PLCE Links: Profile News Message Board | |
| Charts:- Daily , Weekly | |
| Add PLCE to Watchlist: View: Get Complete PLCE Trend Analysis ➞ | |
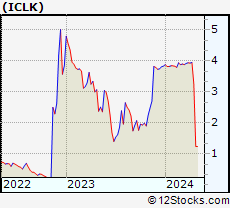 | ICLK iClick Interactive Asia Group Limited |
| Sector: Services & Goods | |
| SubSector: Marketing Services | |
| MarketCap: 258.915 Millions | |
| Recent Price: 1.24 Smart Investing & Trading Score: 25 | |
| Day Percent Change: 0.00% Day Change: 0.00 | |
| Week Change: 0% Year-to-date Change: -67.6% | |
| ICLK Links: Profile News Message Board | |
| Charts:- Daily , Weekly | |
| Add ICLK to Watchlist: View: Get Complete ICLK Trend Analysis ➞ | |
 | DTC Solo Brands, Inc. |
| Sector: Services & Goods | |
| SubSector: Internet Retail | |
| MarketCap: 525 Millions | |
| Recent Price: 1.96 Smart Investing & Trading Score: 64 | |
| Day Percent Change: -2.24% Day Change: -0.04 | |
| Week Change: -2.24% Year-to-date Change: -68.4% | |
| DTC Links: Profile News Message Board | |
| Charts:- Daily , Weekly | |
| Add DTC to Watchlist: View: Get Complete DTC Trend Analysis ➞ | |
 | NOVA Sunnova Energy International Inc. |
| Sector: Services & Goods | |
| SubSector: Management Services | |
| MarketCap: 1180.45 Millions | |
| Recent Price: 4.70 Smart Investing & Trading Score: 67 | |
| Day Percent Change: -1.88% Day Change: -0.09 | |
| Week Change: -1.88% Year-to-date Change: -69.2% | |
| NOVA Links: Profile News Message Board | |
| Charts:- Daily , Weekly | |
| Add NOVA to Watchlist: View: Get Complete NOVA Trend Analysis ➞ | |
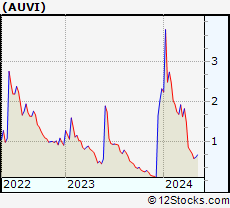 | AUVI Applied UV, Inc. |
| Sector: Services & Goods | |
| SubSector: Furnishings, Fixtures & Appliances | |
| MarketCap: 49027 Millions | |
| Recent Price: 0.60 Smart Investing & Trading Score: 35 | |
| Day Percent Change: -0.43% Day Change: 0.00 | |
| Week Change: -0.43% Year-to-date Change: -74.3% | |
| AUVI Links: Profile News Message Board | |
| Charts:- Daily , Weekly | |
| Add AUVI to Watchlist: View: Get Complete AUVI Trend Analysis ➞ | |
| For tabular summary view of above stock list: Summary View ➞ 0 - 25 , 25 - 50 , 50 - 75 , 75 - 100 , 100 - 125 , 125 - 150 , 150 - 175 , 175 - 200 , 200 - 225 , 225 - 250 , 250 - 275 , 275 - 300 , 300 - 325 , 325 - 350 , 350 - 375 , 375 - 400 , 400 - 425 , 425 - 450 | ||
| Click To Change The Sort Order: By Market Cap or Company Size Performance: Year-to-date, Week and Day | |
| Select Chart Type: | ||
|
Best Stocks Today 12Stocks.com |
© 2024 12Stocks.com Terms & Conditions Privacy Contact Us
All Information Provided Only For Education And Not To Be Used For Investing or Trading. See Terms & Conditions


One More Thing ... Get Best Stocks Delivered Daily!
Never Ever Miss A Move With Our Top Ten Stocks Lists
Find Best Stocks In Any Market - Bull or Bear Market
Take A Peek At Our Top Ten Stocks Lists: Daily, Weekly, Year-to-Date & Top Trends
Find Best Stocks In Any Market - Bull or Bear Market
Take A Peek At Our Top Ten Stocks Lists: Daily, Weekly, Year-to-Date & Top Trends
Consumer Services Stocks With Best Up Trends [0-bearish to 100-bullish]: ATRenew [100], Carvana Co[100], Brinker [100], El Pollo[100], Willdan [100], VSE [100], MercadoLibre [100], E.W. Scripps[100], Sprouts Farmers[100], AECOM [100], Texas Roadhouse[100]
Best Consumer Services Stocks Year-to-Date:
U Power[2997.1%], Vroom [2235.49%], Yatsen Holding[490.49%], Fluent [413.43%], Research[141.9%], Carvana Co[139.89%], Codere Online[136.3%], RealReal [111.19%], Sweetgreen [101.24%], Smart Share[70.87%], PaySign [68.21%] Best Consumer Services Stocks This Week:
ThredUp [15.74%], RealReal [8.85%], ATRenew [8.12%], Vroom [8.05%], MYT Netherlands[7.5%], Golden Heaven[7.34%], Traeger [5.69%], SES AI[5.08%], Jumia Technologies[4.45%], Carvana Co[4.38%], Li Auto[4.36%] Best Consumer Services Stocks Daily:
ThredUp [15.74%], RealReal [8.85%], ATRenew [8.12%], Vroom [8.05%], MYT Netherlands[7.50%], Golden Heaven[7.34%], Traeger [5.69%], SES AI[5.08%], Jumia Technologies[4.45%], Carvana Co[4.38%], Li Auto[4.36%]