
 Login Sign Up


| |||||
 |  | ||||

| 12Stocks.com Market Intelligence |
Best Consumer Services Stocks
| In a hurry? Services & Goods Stocks: Performance Trends Table, Stock Charts
Sort Consumer Services: Daily, Weekly, Year-to-Date, Market Cap & Trends. Filter Services & Goods stocks list by size: All Large Mid-Range Small |
| 12Stocks.com Consumer Services Stocks Performances & Trends Daily | |||||||||
|
|  The overall Smart Investing & Trading Score is 35 (0-bearish to 100-bullish) which puts Consumer Services sector in short term bearish to neutral trend. The Smart Investing & Trading Score from previous trading session is 7 and hence an improvement of trend.
| ||||||||
Here are the Smart Investing & Trading Scores of the most requested Consumer Services stocks at 12Stocks.com (click stock name for detailed review):
|


| Consider signing up for our daily 12Stocks.com "Best Stocks Newsletter". You will never ever miss a big stock move again! |
| 12Stocks.com: Investing in Consumer Services sector with Stocks | |
|
The following table helps investors and traders sort through current performance and trends (as measured by Smart Investing & Trading Score) of various
stocks in the Consumer Services sector. Quick View: Move mouse or cursor over stock symbol (ticker) to view short-term Technical chart and over stock name to view long term chart. Click on  to add stock symbol to your watchlist and to add stock symbol to your watchlist and  to view watchlist. Click on any ticker or stock name for detailed market intelligence report for that stock. to view watchlist. Click on any ticker or stock name for detailed market intelligence report for that stock. |
12Stocks.com Performance of Stocks in Consumer Services Sector
| Ticker | Stock Name | Watchlist | Category | Recent Price | Smart Investing & Trading Score | Change % | YTD Change% |
| CDNA | CareDx |   | Research | 9.27 | 62 | 0.98% | -22.75% |
| CTRN | Citi Trends | | Apparel | 21.82 | 35 | 1.68% | -22.84% |
| VALU | Value Line | | Publishing | 37.29 | 37 | 2.73% | -23.51% |
| FVRR | Fiverr | | Services | 20.80 | 37 | -0.14% | -23.59% |
| LAD | Lithia Motors | | Automobile | 251.20 | 0 | -1.16% | -23.71% |
| CHUY | Chuy s | | Restaurants | 28.95 | 0 | -0.14% | -24.27% |
| COOK | Traeger | | Furnishings, Fixtures & Appliances | 2.12 | 30 | 0.47% | -24.96% |
| CZR | Caesars Entertainment | | Casinos | 35.14 | 10 | -3.41% | -25.04% |
| CBRL | Cracker Barrel | | Restaurants | 57.18 | 0 | 1.45% | -25.82% |
| PTLO | Portillos | | Restaurants | 11.90 | 10 | -1.12% | -25.89% |
| DENN | Denny s | | Restaurants | 8.06 | 27 | 0.25% | -25.92% |
| MATW | Matthews | | Services | 27.12 | 32 | 1.54% | -26.00% |
| CCRN | Cross Country | | Staffing | 16.74 | 40 | -6.48% | -26.06% |
| TDUP | ThredUp | | Internet Retail | 1.67 | 34 | 2.45% | -26.11% |
| ETSY | Etsy | | Retail | 59.24 | 0 | -15.06% | -26.91% |
| GME | GameStop | | Retail | 12.76 | 74 | 16.96% | -27.21% |
| IGT | Game | | Gaming | 19.92 | 30 | 0.10% | -27.33% |
| EVRI | Everi | | Gaming | 8.16 | 20 | 1.49% | -27.60% |
| BQ | Boqii Holding | | Specialty Retail | 0.33 | 90 | 10.40% | -27.62% |
| YI | 111 | | Drug Stores | 1.12 | 34 | 6.67% | -27.74% |
| SHCO | Soho House | | Lodging | 5.25 | 7 | 1.65% | -27.85% |
| GTN | Gray Television | | Broadcasting | 6.44 | 100 | 7.33% | -28.13% |
| GETY | Getty Images | | Internet Content & Information | 3.76 | 17 | 0.53% | -28.24% |
| GCO | Genesco | | Apparel | 25.11 | 30 | -2.49% | -28.69% |
| FIGS | FIGS | | Apparel Manufacturing | 5.03 | 45 | -0.89% | -29.52% |
| For chart view version of above stock list: Chart View ➞ 0 - 25 , 25 - 50 , 50 - 75 , 75 - 100 , 100 - 125 , 125 - 150 , 150 - 175 , 175 - 200 , 200 - 225 , 225 - 250 , 250 - 275 , 275 - 300 , 300 - 325 , 325 - 350 , 350 - 375 , 375 - 400 , 400 - 425 , 425 - 450 , 450 - 475 | ||
 | Click To Change The Sort Order: By Market Cap or Company Size Performance: Year-to-date, Week and Day |  |
|
Get the most comprehensive stock market coverage daily at 12Stocks.com ➞ Best Stocks Today ➞ Best Stocks Weekly ➞ Best Stocks Year-to-Date ➞ Best Stocks Trends ➞  Best Stocks Today 12Stocks.com Best Nasdaq Stocks ➞ Best S&P 500 Stocks ➞ Best Tech Stocks ➞ Best Biotech Stocks ➞ |
| Detailed Overview of Consumer Services Stocks |
| Consumer Services Technical Overview, Leaders & Laggards, Top Consumer Services ETF Funds & Detailed Consumer Services Stocks List, Charts, Trends & More |
| Consumer Services Sector: Technical Analysis, Trends & YTD Performance | |
| Consumer Services sector is composed of stocks
from retail, entertainment, media/publishing, consumer goods
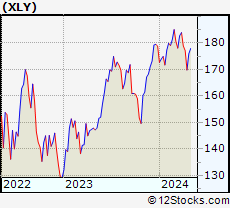
and services subsectors. Consumer Services sector, as represented by XLY, an exchange-traded fund [ETF] that holds basket of Consumer Services stocks (e.g, Walmart, Alibaba) is down by -1.17% and is currently underperforming the overall market by -6.79% year-to-date. Below is a quick view of Technical charts and trends: |
|
 XLY Weekly Chart |
|
| Long Term Trend: Not Good | |
| Medium Term Trend: Deteriorating | |
 XLY Daily Chart |
|
| Short Term Trend: Deteriorating | |
| Overall Trend Score: 35 | |
| YTD Performance: -1.17% | |
| **Trend Scores & Views Are Only For Educational Purposes And Not For Investing | |
| 12Stocks.com: Top Performing Consumer Services Sector Stocks | ||||||||||||||||||||||||||||||||||||||||||||||||
 The top performing Consumer Services sector stocks year to date are
Now, more recently, over last week, the top performing Consumer Services sector stocks on the move are


|
||||||||||||||||||||||||||||||||||||||||||||||||
| 12Stocks.com: Investing in Consumer Services Sector using Exchange Traded Funds | |
|
The following table shows list of key exchange traded funds (ETF) that
help investors track Consumer Services Index. For detailed view, check out our ETF Funds section of our website. Quick View: Move mouse or cursor over ETF symbol (ticker) to view short-term Technical chart and over ETF name to view long term chart. Click on ticker or stock name for detailed view. Click on to add stock symbol to your watchlist and to view watchlist. |
12Stocks.com List of ETFs that track Consumer Services Index
| Ticker | ETF Name | Watchlist | Recent Price | Smart Investing & Trading Score | Change % | Week % | Year-to-date % |
| XLY | Consumer Discret Sel | | 176.72 | 35 | 1.26 | 0.46 | -1.17% |
| RTH | Retail | | 198.79 | 17 | 1.39 | -1.14 | 5.61% |
| IYC | Consumer Services | | 78.43 | 7 | 1.38 | 0.09 | 3.51% |
| XRT | Retail | | 72.49 | 32 | 1.70 | -1 | 0.24% |
| IYK | Consumer Goods | | 66.46 | 63 | 0.51 | -0.45 | 4% |
| UCC | Consumer Services | | 33.96 | 49 | 1.98 | -0.59 | -5.42% |
| RETL | Retail Bull 3X | | 8.53 | 5 | 5.44 | -3.4 | -6.47% |
| RXI | Globl Consumer Discretionary | | 161.47 | 27 | 1.46 | 0.18 | 1.52% |
| SCC | Short Consumer Services | | 15.64 | 88 | -2.13 | -0.89 | 2.06% |
| UGE | Consumer Goods | | 17.16 | 90 | 1.81 | -0.06 | 9.01% |
| 12Stocks.com: Charts, Trends, Fundamental Data and Performances of Consumer Services Stocks | |
|
We now take in-depth look at all Consumer Services stocks including charts, multi-period performances and overall trends (as measured by Smart Investing & Trading Score). One can sort Consumer Services stocks (click link to choose) by Daily, Weekly and by Year-to-Date performances. Also, one can sort by size of the company or by market capitalization. |
| Select Your Default Chart Type: | |||||
| |||||
| Click on stock symbol or name for detailed view. Click on to add stock symbol to your watchlist and to view watchlist. Quick View: Move mouse or cursor over "Daily" to quickly view daily Technical stock chart and over "Weekly" to view weekly Technical stock chart. | |||||

 | CDNA CareDx, Inc |
| Sector: Services & Goods | |
| SubSector: Research Services | |
| MarketCap: 828.194 Millions | |
| Recent Price: 9.27 Smart Investing & Trading Score: 62 | |
| Day Percent Change: 0.98% Day Change: 0.09 | |
| Week Change: 22.62% Year-to-date Change: -22.8% | |
| CDNA Links: Profile News Message Board | |
| Charts:- Daily , Weekly | |
| Add CDNA to Watchlist: View: Get Complete CDNA Trend Analysis ➞ | |
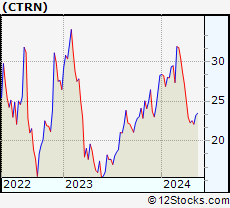 | CTRN Citi Trends, Inc. |
| Sector: Services & Goods | |
| SubSector: Apparel Stores | |
| MarketCap: 117.808 Millions | |
| Recent Price: 21.82 Smart Investing & Trading Score: 35 | |
| Day Percent Change: 1.68% Day Change: 0.36 | |
| Week Change: -3.11% Year-to-date Change: -22.8% | |
| CTRN Links: Profile News Message Board | |
| Charts:- Daily , Weekly | |
| Add CTRN to Watchlist: View: Get Complete CTRN Trend Analysis ➞ | |
 | VALU Value Line, Inc. |
| Sector: Services & Goods | |
| SubSector: Publishing - Periodicals | |
| MarketCap: 254.3 Millions | |
| Recent Price: 37.29 Smart Investing & Trading Score: 37 | |
| Day Percent Change: 2.73% Day Change: 0.99 | |
| Week Change: 2.59% Year-to-date Change: -23.5% | |
| VALU Links: Profile News Message Board | |
| Charts:- Daily , Weekly | |
| Add VALU to Watchlist: View: Get Complete VALU Trend Analysis ➞ | |
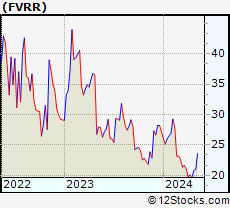 | FVRR Fiverr International Ltd. |
| Sector: Services & Goods | |
| SubSector: Business Services | |
| MarketCap: 766.582 Millions | |
| Recent Price: 20.80 Smart Investing & Trading Score: 37 | |
| Day Percent Change: -0.14% Day Change: -0.03 | |
| Week Change: 0% Year-to-date Change: -23.6% | |
| FVRR Links: Profile News Message Board | |
| Charts:- Daily , Weekly | |
| Add FVRR to Watchlist: View: Get Complete FVRR Trend Analysis ➞ | |
 | LAD Lithia Motors, Inc. |
| Sector: Services & Goods | |
| SubSector: Auto Dealerships | |
| MarketCap: 1727.21 Millions | |
| Recent Price: 251.20 Smart Investing & Trading Score: 0 | |
| Day Percent Change: -1.16% Day Change: -2.96 | |
| Week Change: -4.38% Year-to-date Change: -23.7% | |
| LAD Links: Profile News Message Board | |
| Charts:- Daily , Weekly | |
| Add LAD to Watchlist: View: Get Complete LAD Trend Analysis ➞ | |
 | CHUY Chuy s Holdings, Inc. |
| Sector: Services & Goods | |
| SubSector: Restaurants | |
| MarketCap: 159.17 Millions | |
| Recent Price: 28.95 Smart Investing & Trading Score: 0 | |
| Day Percent Change: -0.14% Day Change: -0.04 | |
| Week Change: -4.55% Year-to-date Change: -24.3% | |
| CHUY Links: Profile News Message Board | |
| Charts:- Daily , Weekly | |
| Add CHUY to Watchlist: View: Get Complete CHUY Trend Analysis ➞ | |
 | COOK Traeger, Inc. |
| Sector: Services & Goods | |
| SubSector: Furnishings, Fixtures & Appliances | |
| MarketCap: 524 Millions | |
| Recent Price: 2.12 Smart Investing & Trading Score: 30 | |
| Day Percent Change: 0.47% Day Change: 0.01 | |
| Week Change: 0% Year-to-date Change: -25.0% | |
| COOK Links: Profile News Message Board | |
| Charts:- Daily , Weekly | |
| Add COOK to Watchlist: View: Get Complete COOK Trend Analysis ➞ | |
 | CZR Caesars Entertainment Corporation |
| Sector: Services & Goods | |
| SubSector: Resorts & Casinos | |
| MarketCap: 4618.44 Millions | |
| Recent Price: 35.14 Smart Investing & Trading Score: 10 | |
| Day Percent Change: -3.41% Day Change: -1.24 | |
| Week Change: -4.02% Year-to-date Change: -25.0% | |
| CZR Links: Profile News Message Board | |
| Charts:- Daily , Weekly | |
| Add CZR to Watchlist: View: Get Complete CZR Trend Analysis ➞ | |
 | CBRL Cracker Barrel Old Country Store, Inc. |
| Sector: Services & Goods | |
| SubSector: Restaurants | |
| MarketCap: 1839.6 Millions | |
| Recent Price: 57.18 Smart Investing & Trading Score: 0 | |
| Day Percent Change: 1.45% Day Change: 0.82 | |
| Week Change: -3.61% Year-to-date Change: -25.8% | |
| CBRL Links: Profile News Message Board | |
| Charts:- Daily , Weekly | |
| Add CBRL to Watchlist: View: Get Complete CBRL Trend Analysis ➞ | |
 | PTLO Portillos Inc. |
| Sector: Services & Goods | |
| SubSector: Restaurants | |
| MarketCap: 1590 Millions | |
| Recent Price: 11.90 Smart Investing & Trading Score: 10 | |
| Day Percent Change: -1.12% Day Change: -0.13 | |
| Week Change: -1.04% Year-to-date Change: -25.9% | |
| PTLO Links: Profile News Message Board | |
| Charts:- Daily , Weekly | |
| Add PTLO to Watchlist: View: Get Complete PTLO Trend Analysis ➞ | |
 | DENN Denny s Corporation |
| Sector: Services & Goods | |
| SubSector: Restaurants | |
| MarketCap: 367.47 Millions | |
| Recent Price: 8.06 Smart Investing & Trading Score: 27 | |
| Day Percent Change: 0.25% Day Change: 0.02 | |
| Week Change: -0.12% Year-to-date Change: -25.9% | |
| DENN Links: Profile News Message Board | |
| Charts:- Daily , Weekly | |
| Add DENN to Watchlist: View: Get Complete DENN Trend Analysis ➞ | |
 | MATW Matthews International Corporation |
| Sector: Services & Goods | |
| SubSector: Personal Services | |
| MarketCap: 803.325 Millions | |
| Recent Price: 27.12 Smart Investing & Trading Score: 32 | |
| Day Percent Change: 1.54% Day Change: 0.41 | |
| Week Change: -0.11% Year-to-date Change: -26.0% | |
| MATW Links: Profile News Message Board | |
| Charts:- Daily , Weekly | |
| Add MATW to Watchlist: View: Get Complete MATW Trend Analysis ➞ | |
 | CCRN Cross Country Healthcare, Inc. |
| Sector: Services & Goods | |
| SubSector: Staffing & Outsourcing Services | |
| MarketCap: 348.328 Millions | |
| Recent Price: 16.74 Smart Investing & Trading Score: 40 | |
| Day Percent Change: -6.48% Day Change: -1.16 | |
| Week Change: -2.33% Year-to-date Change: -26.1% | |
| CCRN Links: Profile News Message Board | |
| Charts:- Daily , Weekly | |
| Add CCRN to Watchlist: View: Get Complete CCRN Trend Analysis ➞ | |
 | TDUP ThredUp Inc. |
| Sector: Services & Goods | |
| SubSector: Internet Retail | |
| MarketCap: 258 Millions | |
| Recent Price: 1.67 Smart Investing & Trading Score: 34 | |
| Day Percent Change: 2.45% Day Change: 0.04 | |
| Week Change: 3.73% Year-to-date Change: -26.1% | |
| TDUP Links: Profile News Message Board | |
| Charts:- Daily , Weekly | |
| Add TDUP to Watchlist: View: Get Complete TDUP Trend Analysis ➞ | |
 | ETSY Etsy, Inc. |
| Sector: Services & Goods | |
| SubSector: Specialty Retail, Other | |
| MarketCap: 4263.24 Millions | |
| Recent Price: 59.24 Smart Investing & Trading Score: 0 | |
| Day Percent Change: -15.06% Day Change: -10.50 | |
| Week Change: -12.15% Year-to-date Change: -26.9% | |
| ETSY Links: Profile News Message Board | |
| Charts:- Daily , Weekly | |
| Add ETSY to Watchlist: View: Get Complete ETSY Trend Analysis ➞ | |
 | GME GameStop Corp. |
| Sector: Services & Goods | |
| SubSector: Electronics Stores | |
| MarketCap: 257.8 Millions | |
| Recent Price: 12.76 Smart Investing & Trading Score: 74 | |
| Day Percent Change: 16.96% Day Change: 1.85 | |
| Week Change: 7.23% Year-to-date Change: -27.2% | |
| GME Links: Profile News Message Board | |
| Charts:- Daily , Weekly | |
| Add GME to Watchlist: View: Get Complete GME Trend Analysis ➞ | |
 | IGT International Game Technology PLC |
| Sector: Services & Goods | |
| SubSector: Gaming Activities | |
| MarketCap: 1030.89 Millions | |
| Recent Price: 19.92 Smart Investing & Trading Score: 30 | |
| Day Percent Change: 0.10% Day Change: 0.02 | |
| Week Change: -1.87% Year-to-date Change: -27.3% | |
| IGT Links: Profile News Message Board | |
| Charts:- Daily , Weekly | |
| Add IGT to Watchlist: View: Get Complete IGT Trend Analysis ➞ | |
 | EVRI Everi Holdings Inc. |
| Sector: Services & Goods | |
| SubSector: Gaming Activities | |
| MarketCap: 273.389 Millions | |
| Recent Price: 8.16 Smart Investing & Trading Score: 20 | |
| Day Percent Change: 1.49% Day Change: 0.12 | |
| Week Change: -2.63% Year-to-date Change: -27.6% | |
| EVRI Links: Profile News Message Board | |
| Charts:- Daily , Weekly | |
| Add EVRI to Watchlist: View: Get Complete EVRI Trend Analysis ➞ | |
 | BQ Boqii Holding Limited |
| Sector: Services & Goods | |
| SubSector: Specialty Retail | |
| MarketCap: 33027 Millions | |
| Recent Price: 0.33 Smart Investing & Trading Score: 90 | |
| Day Percent Change: 10.40% Day Change: 0.03 | |
| Week Change: 8.22% Year-to-date Change: -27.6% | |
| BQ Links: Profile News Message Board | |
| Charts:- Daily , Weekly | |
| Add BQ to Watchlist: View: Get Complete BQ Trend Analysis ➞ | |
 | YI 111, Inc. |
| Sector: Services & Goods | |
| SubSector: Drug Stores | |
| MarketCap: 520.351 Millions | |
| Recent Price: 1.12 Smart Investing & Trading Score: 34 | |
| Day Percent Change: 6.67% Day Change: 0.07 | |
| Week Change: 9.27% Year-to-date Change: -27.7% | |
| YI Links: Profile News Message Board | |
| Charts:- Daily , Weekly | |
| Add YI to Watchlist: View: Get Complete YI Trend Analysis ➞ | |
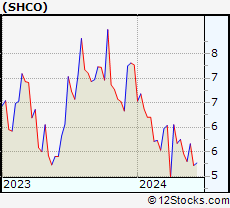 | SHCO Soho House & Co Inc. |
| Sector: Services & Goods | |
| SubSector: Lodging | |
| MarketCap: 1140 Millions | |
| Recent Price: 5.25 Smart Investing & Trading Score: 7 | |
| Day Percent Change: 1.65% Day Change: 0.08 | |
| Week Change: -7.33% Year-to-date Change: -27.9% | |
| SHCO Links: Profile News Message Board | |
| Charts:- Daily , Weekly | |
| Add SHCO to Watchlist: View: Get Complete SHCO Trend Analysis ➞ | |
 | GTN Gray Television, Inc. |
| Sector: Services & Goods | |
| SubSector: Broadcasting - TV | |
| MarketCap: 1144.63 Millions | |
| Recent Price: 6.44 Smart Investing & Trading Score: 100 | |
| Day Percent Change: 7.33% Day Change: 0.44 | |
| Week Change: 14.8% Year-to-date Change: -28.1% | |
| GTN Links: Profile News Message Board | |
| Charts:- Daily , Weekly | |
| Add GTN to Watchlist: View: Get Complete GTN Trend Analysis ➞ | |
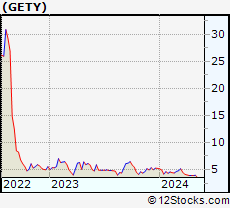 | GETY Getty Images Holdings, Inc. |
| Sector: Services & Goods | |
| SubSector: Internet Content & Information | |
| MarketCap: 1940 Millions | |
| Recent Price: 3.76 Smart Investing & Trading Score: 17 | |
| Day Percent Change: 0.53% Day Change: 0.02 | |
| Week Change: -4.08% Year-to-date Change: -28.2% | |
| GETY Links: Profile News Message Board | |
| Charts:- Daily , Weekly | |
| Add GETY to Watchlist: View: Get Complete GETY Trend Analysis ➞ | |
 | GCO Genesco Inc. |
| Sector: Services & Goods | |
| SubSector: Apparel Stores | |
| MarketCap: 187.508 Millions | |
| Recent Price: 25.11 Smart Investing & Trading Score: 30 | |
| Day Percent Change: -2.49% Day Change: -0.64 | |
| Week Change: -4.16% Year-to-date Change: -28.7% | |
| GCO Links: Profile News Message Board | |
| Charts:- Daily , Weekly | |
| Add GCO to Watchlist: View: Get Complete GCO Trend Analysis ➞ | |
 | FIGS FIGS, Inc. |
| Sector: Services & Goods | |
| SubSector: Apparel Manufacturing | |
| MarketCap: 1370 Millions | |
| Recent Price: 5.03 Smart Investing & Trading Score: 45 | |
| Day Percent Change: -0.89% Day Change: -0.04 | |
| Week Change: 2.13% Year-to-date Change: -29.5% | |
| FIGS Links: Profile News Message Board | |
| Charts:- Daily , Weekly | |
| Add FIGS to Watchlist: View: Get Complete FIGS Trend Analysis ➞ | |
| For tabular summary view of above stock list: Summary View ➞ 0 - 25 , 25 - 50 , 50 - 75 , 75 - 100 , 100 - 125 , 125 - 150 , 150 - 175 , 175 - 200 , 200 - 225 , 225 - 250 , 250 - 275 , 275 - 300 , 300 - 325 , 325 - 350 , 350 - 375 , 375 - 400 , 400 - 425 , 425 - 450 , 450 - 475 | ||
| Click To Change The Sort Order: By Market Cap or Company Size Performance: Year-to-date, Week and Day | |
| Select Chart Type: | ||
|
Best Stocks Today 12Stocks.com |
© 2024 12Stocks.com Terms & Conditions Privacy Contact Us
All Information Provided Only For Education And Not To Be Used For Investing or Trading. See Terms & Conditions


One More Thing ... Get Best Stocks Delivered Daily!
Never Ever Miss A Move With Our Top Ten Stocks Lists
Find Best Stocks In Any Market - Bull or Bear Market
Take A Peek At Our Top Ten Stocks Lists: Daily, Weekly, Year-to-Date & Top Trends
Find Best Stocks In Any Market - Bull or Bear Market
Take A Peek At Our Top Ten Stocks Lists: Daily, Weekly, Year-to-Date & Top Trends
Consumer Services Stocks With Best Up Trends [0-bearish to 100-bullish]: Perdoceo Education[100], Gannett Co[100], Sprouts Farmers[100], MINISO [100], Smart Share[100], Dada Nexus[100], Thomson Reuters[100], Gray Television[100], WESCO [100], Alibaba [100], Tetra Tech[100]
Best Consumer Services Stocks Year-to-Date:
U Power[2974.78%], Vroom [1965.31%], Yatsen Holding[475.45%], Fluent [397.76%], Research[138.8%], Codere Online[132.88%], Carvana Co[120.06%], Sweetgreen [88.85%], RealReal [87.56%], Smart Share[68.74%], PaySign [64.64%] Best Consumer Services Stocks This Week:
Chicken Soup[157.39%], Smart Share[39.89%], Carvana Co[38.18%], Perdoceo Education[27.84%], Olaplex [24.63%], CareDx [22.62%], Polestar Automotive[21.61%], XPeng [19.9%], Gannett Co[18.6%], OneSpaWorld [16.28%], Li Auto[15.79%] Best Consumer Services Stocks Daily:
Carvana Co[33.77%], Perdoceo Education[31.46%], Gannett Co[26.97%], Sunnova Energy[25.21%], Chicken Soup[20.82%], Olaplex [19.29%], GameStop [16.96%], Wayfair [16.05%], XPeng [15.76%], Children s[14.88%], OneWater Marine[14.09%]