
 Login Sign Up


| |||||
 |  | ||||

| 12Stocks.com Market Intelligence |
Best Consumer Services Stocks
| In a hurry? Services & Goods Stocks: Performance Trends Table, Stock Charts
Sort Consumer Services: Daily, Weekly, Year-to-Date, Market Cap & Trends. Filter Services & Goods stocks list by size: All Large Mid-Range Small |
| 12Stocks.com Consumer Services Stocks Performances & Trends Daily | |||||||||
|
|  The overall Smart Investing & Trading Score is 57 (0-bearish to 100-bullish) which puts Consumer Services sector in short term neutral trend. The Smart Investing & Trading Score from previous trading session is 35 and hence an improvement of trend.
| ||||||||
Here are the Smart Investing & Trading Scores of the most requested Consumer Services stocks at 12Stocks.com (click stock name for detailed review):
|


| Consider signing up for our daily 12Stocks.com "Best Stocks Newsletter". You will never ever miss a big stock move again! |
| 12Stocks.com: Investing in Consumer Services sector with Stocks | |
|
The following table helps investors and traders sort through current performance and trends (as measured by Smart Investing & Trading Score) of various
stocks in the Consumer Services sector. Quick View: Move mouse or cursor over stock symbol (ticker) to view short-term Technical chart and over stock name to view long term chart. Click on  to add stock symbol to your watchlist and to add stock symbol to your watchlist and  to view watchlist. Click on any ticker or stock name for detailed market intelligence report for that stock. to view watchlist. Click on any ticker or stock name for detailed market intelligence report for that stock. |
12Stocks.com Performance of Stocks in Consumer Services Sector
| Ticker | Stock Name | Watchlist | Category | Recent Price | Smart Investing & Trading Score | Change % | YTD Change% |
| KELYA | Kelly Services |   | Staffing | 23.63 | 47 | -0.38% | 9.30% |
| LAUR | Laureate Education | | Education | 14.98 | 100 | 5.27% | 9.26% |
| JWN | Nordstrom | | Apparel | 20.10 | 69 | 0.60% | 8.94% |
| MSA | MSA Safety | | Security | 183.93 | 45 | -0.75% | 8.94% |
| REZI | Resideo Technologies | | Security | 20.49 | 44 | 3.85% | 8.87% |
| PSMT | PriceSmart | | Retail | 82.46 | 59 | 0.54% | 8.81% |
| NGVC | Natural Grocers | | Grocery | 17.38 | 95 | 3.33% | 8.63% |
| EEFT | Euronet Worldwide | | Services | 110.24 | 100 | 2.95% | 8.62% |
| WEX | WEX | | Services | 211.30 | 25 | 0.25% | 8.61% |
| SGHC | Super | | Gambling | 3.47 | 100 | 4.83% | 8.61% |
| HLT | Hilton Worldwide | | Lodging | 197.54 | 32 | 0.01% | 8.48% |
| FWONA | Formula One | | Broadcasting | 62.89 | 64 | -0.36% | 8.47% |
| WSO | Watsco | | Retail | 464.55 | 100 | 1.86% | 8.42% |
| DJCO | Daily Journal | | Publishing | 369.00 | 100 | 2.46% | 8.27% |
| FOXA | Fox | | Entertainment | 32.11 | 100 | 1.42% | 8.22% |
| OUT | Outfront Media | | Marketing | 15.09 | 36 | -5.92% | 8.09% |
| FCN | FTI Consulting | | Services | 215.14 | 83 | -0.05% | 8.03% |
| RBA | Ritchie Bros. | | Services | 72.24 | 32 | 1.47% | 8.00% |
| AIT | Applied Industrial | | Equipment | 185.98 | 39 | 0.73% | 7.70% |
| DBI | Designer Brands | | Apparel | 9.53 | 64 | 1.28% | 7.68% |
| DDS | Dillard s | | Department | 434.00 | 55 | 0.63% | 7.52% |
| IHG | InterContinental Hotels | | Lodging | 98.01 | 15 | -1.34% | 7.49% |
| PLYA | Playa Hotels | | Casinos | 9.29 | 66 | 0.92% | 7.46% |
| HGV | Hilton Grand | | Casinos | 43.16 | 42 | 0.09% | 7.42% |
| WPP | WPP | | Advertising | 51.07 | 90 | 1.09% | 7.36% |
| For chart view version of above stock list: Chart View ➞ 0 - 25 , 25 - 50 , 50 - 75 , 75 - 100 , 100 - 125 , 125 - 150 , 150 - 175 , 175 - 200 , 200 - 225 , 225 - 250 , 250 - 275 , 275 - 300 , 300 - 325 , 325 - 350 , 350 - 375 , 375 - 400 , 400 - 425 , 425 - 450 , 450 - 475 | ||
 | Click To Change The Sort Order: By Market Cap or Company Size Performance: Year-to-date, Week and Day |  |
|
Get the most comprehensive stock market coverage daily at 12Stocks.com ➞ Best Stocks Today ➞ Best Stocks Weekly ➞ Best Stocks Year-to-Date ➞ Best Stocks Trends ➞  Best Stocks Today 12Stocks.com Best Nasdaq Stocks ➞ Best S&P 500 Stocks ➞ Best Tech Stocks ➞ Best Biotech Stocks ➞ |
| Detailed Overview of Consumer Services Stocks |
| Consumer Services Technical Overview, Leaders & Laggards, Top Consumer Services ETF Funds & Detailed Consumer Services Stocks List, Charts, Trends & More |
| Consumer Services Sector: Technical Analysis, Trends & YTD Performance | |
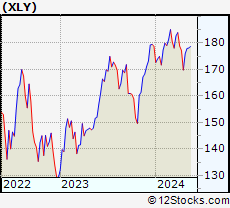
| Consumer Services sector is composed of stocks
from retail, entertainment, media/publishing, consumer goods
and services subsectors. Consumer Services sector, as represented by XLY, an exchange-traded fund [ETF] that holds basket of Consumer Services stocks (e.g, Walmart, Alibaba) is down by -0.5% and is currently underperforming the overall market by -7.38% year-to-date. Below is a quick view of Technical charts and trends: |
|
 XLY Weekly Chart |
|
| Long Term Trend: Not Good | |
| Medium Term Trend: Very Good | |
 XLY Daily Chart |
|
| Short Term Trend: Very Good | |
| Overall Trend Score: 57 | |
| YTD Performance: -0.5% | |
| **Trend Scores & Views Are Only For Educational Purposes And Not For Investing | |
| 12Stocks.com: Top Performing Consumer Services Sector Stocks | ||||||||||||||||||||||||||||||||||||||||||||||||
 The top performing Consumer Services sector stocks year to date are
Now, more recently, over last week, the top performing Consumer Services sector stocks on the move are


|
||||||||||||||||||||||||||||||||||||||||||||||||
| 12Stocks.com: Investing in Consumer Services Sector using Exchange Traded Funds | |
|
The following table shows list of key exchange traded funds (ETF) that
help investors track Consumer Services Index. For detailed view, check out our ETF Funds section of our website. Quick View: Move mouse or cursor over ETF symbol (ticker) to view short-term Technical chart and over ETF name to view long term chart. Click on ticker or stock name for detailed view. Click on to add stock symbol to your watchlist and to view watchlist. |
12Stocks.com List of ETFs that track Consumer Services Index
| Ticker | ETF Name | Watchlist | Recent Price | Smart Investing & Trading Score | Change % | Week % | Year-to-date % |
| XLY | Consumer Discret Sel | | 177.91 | 57 | 0.67 | 1.14 | -0.5% |
| RTH | Retail | | 200.52 | 40 | 0.87 | -0.28 | 6.53% |
| IYC | Consumer Services | | 79.09 | 57 | 0.84 | 0.93 | 4.38% |
| XRT | Retail | | 73.42 | 54 | 1.28 | 0.27 | 1.52% |
| IYK | Consumer Goods | | 66.59 | 64 | 0.20 | -0.25 | 4.2% |
| UCC | Consumer Services | | 34.07 | 54 | 0.31 | -0.27 | -5.13% |
| RETL | Retail Bull 3X | | 8.83 | 52 | 3.52 | 0 | -3.18% |
| RXI | Globl Consumer Discretionary | | 163.11 | 64 | 1.02 | 1.2 | 2.55% |
| SCC | Short Consumer Services | | 15.39 | 36 | -1.63 | -2.5 | 0.4% |
| UGE | Consumer Goods | | 17.27 | 90 | 0.64 | 0.58 | 9.71% |
| 12Stocks.com: Charts, Trends, Fundamental Data and Performances of Consumer Services Stocks | |
|
We now take in-depth look at all Consumer Services stocks including charts, multi-period performances and overall trends (as measured by Smart Investing & Trading Score). One can sort Consumer Services stocks (click link to choose) by Daily, Weekly and by Year-to-Date performances. Also, one can sort by size of the company or by market capitalization. |
| Select Your Default Chart Type: | |||||
| |||||
| Click on stock symbol or name for detailed view. Click on to add stock symbol to your watchlist and to view watchlist. Quick View: Move mouse or cursor over "Daily" to quickly view daily Technical stock chart and over "Weekly" to view weekly Technical stock chart. | |||||

 | KELYA Kelly Services, Inc. |
| Sector: Services & Goods | |
| SubSector: Staffing & Outsourcing Services | |
| MarketCap: 587.228 Millions | |
| Recent Price: 23.63 Smart Investing & Trading Score: 47 | |
| Day Percent Change: -0.38% Day Change: -0.09 | |
| Week Change: 0.72% Year-to-date Change: 9.3% | |
| KELYA Links: Profile News Message Board | |
| Charts:- Daily , Weekly | |
| Add KELYA to Watchlist: View: Get Complete KELYA Trend Analysis ➞ | |
 | LAUR Laureate Education, Inc. |
| Sector: Services & Goods | |
| SubSector: Education & Training Services | |
| MarketCap: 2258.56 Millions | |
| Recent Price: 14.98 Smart Investing & Trading Score: 100 | |
| Day Percent Change: 5.27% Day Change: 0.75 | |
| Week Change: 1.22% Year-to-date Change: 9.3% | |
| LAUR Links: Profile News Message Board | |
| Charts:- Daily , Weekly | |
| Add LAUR to Watchlist: View: Get Complete LAUR Trend Analysis ➞ | |
 | JWN Nordstrom, Inc. |
| Sector: Services & Goods | |
| SubSector: Apparel Stores | |
| MarketCap: 3351.68 Millions | |
| Recent Price: 20.10 Smart Investing & Trading Score: 69 | |
| Day Percent Change: 0.60% Day Change: 0.12 | |
| Week Change: 5.07% Year-to-date Change: 8.9% | |
| JWN Links: Profile News Message Board | |
| Charts:- Daily , Weekly | |
| Add JWN to Watchlist: View: Get Complete JWN Trend Analysis ➞ | |
 | MSA MSA Safety Incorporated |
| Sector: Services & Goods | |
| SubSector: Security & Protection Services | |
| MarketCap: 4167.83 Millions | |
| Recent Price: 183.93 Smart Investing & Trading Score: 45 | |
| Day Percent Change: -0.75% Day Change: -1.39 | |
| Week Change: -2.57% Year-to-date Change: 8.9% | |
| MSA Links: Profile News Message Board | |
| Charts:- Daily , Weekly | |
| Add MSA to Watchlist: View: Get Complete MSA Trend Analysis ➞ | |
 | REZI Resideo Technologies, Inc. |
| Sector: Services & Goods | |
| SubSector: Security & Protection Services | |
| MarketCap: 712.603 Millions | |
| Recent Price: 20.49 Smart Investing & Trading Score: 44 | |
| Day Percent Change: 3.85% Day Change: 0.76 | |
| Week Change: 3.07% Year-to-date Change: 8.9% | |
| REZI Links: Profile News Message Board | |
| Charts:- Daily , Weekly | |
| Add REZI to Watchlist: View: Get Complete REZI Trend Analysis ➞ | |
 | PSMT PriceSmart, Inc. |
| Sector: Services & Goods | |
| SubSector: Discount, Variety Stores | |
| MarketCap: 1655.72 Millions | |
| Recent Price: 82.46 Smart Investing & Trading Score: 59 | |
| Day Percent Change: 0.54% Day Change: 0.44 | |
| Week Change: 1.19% Year-to-date Change: 8.8% | |
| PSMT Links: Profile News Message Board | |
| Charts:- Daily , Weekly | |
| Add PSMT to Watchlist: View: Get Complete PSMT Trend Analysis ➞ | |
 | NGVC Natural Grocers by Vitamin Cottage, Inc. |
| Sector: Services & Goods | |
| SubSector: Grocery Stores | |
| MarketCap: 185.475 Millions | |
| Recent Price: 17.38 Smart Investing & Trading Score: 95 | |
| Day Percent Change: 3.33% Day Change: 0.56 | |
| Week Change: 2.96% Year-to-date Change: 8.6% | |
| NGVC Links: Profile News Message Board | |
| Charts:- Daily , Weekly | |
| Add NGVC to Watchlist: View: Get Complete NGVC Trend Analysis ➞ | |
 | EEFT Euronet Worldwide, Inc. |
| Sector: Services & Goods | |
| SubSector: Business Services | |
| MarketCap: 4809.62 Millions | |
| Recent Price: 110.24 Smart Investing & Trading Score: 100 | |
| Day Percent Change: 2.95% Day Change: 3.16 | |
| Week Change: 6.17% Year-to-date Change: 8.6% | |
| EEFT Links: Profile News Message Board | |
| Charts:- Daily , Weekly | |
| Add EEFT to Watchlist: View: Get Complete EEFT Trend Analysis ➞ | |
 | WEX WEX Inc. |
| Sector: Services & Goods | |
| SubSector: Business Services | |
| MarketCap: 4312.22 Millions | |
| Recent Price: 211.30 Smart Investing & Trading Score: 25 | |
| Day Percent Change: 0.25% Day Change: 0.53 | |
| Week Change: -2.44% Year-to-date Change: 8.6% | |
| WEX Links: Profile News Message Board | |
| Charts:- Daily , Weekly | |
| Add WEX to Watchlist: View: Get Complete WEX Trend Analysis ➞ | |
 | SGHC Super Group (SGHC) Limited |
| Sector: Services & Goods | |
| SubSector: Gambling | |
| MarketCap: 1390 Millions | |
| Recent Price: 3.47 Smart Investing & Trading Score: 100 | |
| Day Percent Change: 4.83% Day Change: 0.16 | |
| Week Change: 15.28% Year-to-date Change: 8.6% | |
| SGHC Links: Profile News Message Board | |
| Charts:- Daily , Weekly | |
| Add SGHC to Watchlist: View: Get Complete SGHC Trend Analysis ➞ | |
 | HLT Hilton Worldwide Holdings Inc. |
| Sector: Services & Goods | |
| SubSector: Lodging | |
| MarketCap: 18064.6 Millions | |
| Recent Price: 197.54 Smart Investing & Trading Score: 32 | |
| Day Percent Change: 0.01% Day Change: 0.01 | |
| Week Change: -2.27% Year-to-date Change: 8.5% | |
| HLT Links: Profile News Message Board | |
| Charts:- Daily , Weekly | |
| Add HLT to Watchlist: View: Get Complete HLT Trend Analysis ➞ | |
 | FWONA Formula One Group |
| Sector: Services & Goods | |
| SubSector: Broadcasting - TV | |
| MarketCap: 17485.6 Millions | |
| Recent Price: 62.89 Smart Investing & Trading Score: 64 | |
| Day Percent Change: -0.36% Day Change: -0.23 | |
| Week Change: 2.04% Year-to-date Change: 8.5% | |
| FWONA Links: Profile News Message Board | |
| Charts:- Daily , Weekly | |
| Add FWONA to Watchlist: View: Get Complete FWONA Trend Analysis ➞ | |
 | WSO Watsco, Inc. |
| Sector: Services & Goods | |
| SubSector: Electronics Wholesale | |
| MarketCap: 6000.33 Millions | |
| Recent Price: 464.55 Smart Investing & Trading Score: 100 | |
| Day Percent Change: 1.86% Day Change: 8.47 | |
| Week Change: 4.81% Year-to-date Change: 8.4% | |
| WSO Links: Profile News Message Board | |
| Charts:- Daily , Weekly | |
| Add WSO to Watchlist: View: Get Complete WSO Trend Analysis ➞ | |
 | DJCO Daily Journal Corporation |
| Sector: Services & Goods | |
| SubSector: Publishing - Newspapers | |
| MarketCap: 306.822 Millions | |
| Recent Price: 369.00 Smart Investing & Trading Score: 100 | |
| Day Percent Change: 2.46% Day Change: 8.85 | |
| Week Change: 6.4% Year-to-date Change: 8.3% | |
| DJCO Links: Profile News Message Board | |
| Charts:- Daily , Weekly | |
| Add DJCO to Watchlist: View: Get Complete DJCO Trend Analysis ➞ | |
 | FOXA Fox Corporation |
| Sector: Services & Goods | |
| SubSector: Entertainment - Diversified | |
| MarketCap: 13440.7 Millions | |
| Recent Price: 32.11 Smart Investing & Trading Score: 100 | |
| Day Percent Change: 1.42% Day Change: 0.45 | |
| Week Change: 2.88% Year-to-date Change: 8.2% | |
| FOXA Links: Profile News Message Board | |
| Charts:- Daily , Weekly | |
| Add FOXA to Watchlist: View: Get Complete FOXA Trend Analysis ➞ | |
 | OUT Outfront Media Inc. |
| Sector: Services & Goods | |
| SubSector: Marketing Services | |
| MarketCap: 1388.15 Millions | |
| Recent Price: 15.09 Smart Investing & Trading Score: 36 | |
| Day Percent Change: -5.92% Day Change: -0.95 | |
| Week Change: -4.07% Year-to-date Change: 8.1% | |
| OUT Links: Profile News Message Board | |
| Charts:- Daily , Weekly | |
| Add OUT to Watchlist: View: Get Complete OUT Trend Analysis ➞ | |
 | FCN FTI Consulting, Inc. |
| Sector: Services & Goods | |
| SubSector: Management Services | |
| MarketCap: 4485.05 Millions | |
| Recent Price: 215.14 Smart Investing & Trading Score: 83 | |
| Day Percent Change: -0.05% Day Change: -0.11 | |
| Week Change: 1.79% Year-to-date Change: 8.0% | |
| FCN Links: Profile News Message Board | |
| Charts:- Daily , Weekly | |
| Add FCN to Watchlist: View: Get Complete FCN Trend Analysis ➞ | |
 | RBA Ritchie Bros. Auctioneers Incorporated |
| Sector: Services & Goods | |
| SubSector: Business Services | |
| MarketCap: 3491.02 Millions | |
| Recent Price: 72.24 Smart Investing & Trading Score: 32 | |
| Day Percent Change: 1.47% Day Change: 1.05 | |
| Week Change: -1.28% Year-to-date Change: 8.0% | |
| RBA Links: Profile News Message Board | |
| Charts:- Daily , Weekly | |
| Add RBA to Watchlist: View: Get Complete RBA Trend Analysis ➞ | |
 | AIT Applied Industrial Technologies, Inc. |
| Sector: Services & Goods | |
| SubSector: Industrial Equipment Wholesale | |
| MarketCap: 1531.58 Millions | |
| Recent Price: 185.98 Smart Investing & Trading Score: 39 | |
| Day Percent Change: 0.73% Day Change: 1.35 | |
| Week Change: 2.81% Year-to-date Change: 7.7% | |
| AIT Links: Profile News Message Board | |
| Charts:- Daily , Weekly | |
| Add AIT to Watchlist: View: Get Complete AIT Trend Analysis ➞ | |
 | DBI Designer Brands Inc. |
| Sector: Services & Goods | |
| SubSector: Apparel Stores | |
| MarketCap: 467.308 Millions | |
| Recent Price: 9.53 Smart Investing & Trading Score: 64 | |
| Day Percent Change: 1.28% Day Change: 0.12 | |
| Week Change: -1.35% Year-to-date Change: 7.7% | |
| DBI Links: Profile News Message Board | |
| Charts:- Daily , Weekly | |
| Add DBI to Watchlist: View: Get Complete DBI Trend Analysis ➞ | |
 | DDS Dillard s, Inc. |
| Sector: Services & Goods | |
| SubSector: Department Stores | |
| MarketCap: 1170.82 Millions | |
| Recent Price: 434.00 Smart Investing & Trading Score: 55 | |
| Day Percent Change: 0.63% Day Change: 2.70 | |
| Week Change: -3.33% Year-to-date Change: 7.5% | |
| DDS Links: Profile News Message Board | |
| Charts:- Daily , Weekly | |
| Add DDS to Watchlist: View: Get Complete DDS Trend Analysis ➞ | |
 | IHG InterContinental Hotels Group PLC |
| Sector: Services & Goods | |
| SubSector: Lodging | |
| MarketCap: 6387.46 Millions | |
| Recent Price: 98.01 Smart Investing & Trading Score: 15 | |
| Day Percent Change: -1.34% Day Change: -1.33 | |
| Week Change: -2.89% Year-to-date Change: 7.5% | |
| IHG Links: Profile News Message Board | |
| Charts:- Daily , Weekly | |
| Add IHG to Watchlist: View: Get Complete IHG Trend Analysis ➞ | |
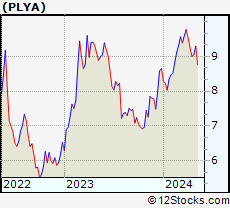 | PLYA Playa Hotels & Resorts N.V. |
| Sector: Services & Goods | |
| SubSector: Resorts & Casinos | |
| MarketCap: 360.194 Millions | |
| Recent Price: 9.29 Smart Investing & Trading Score: 66 | |
| Day Percent Change: 0.92% Day Change: 0.08 | |
| Week Change: 2.71% Year-to-date Change: 7.5% | |
| PLYA Links: Profile News Message Board | |
| Charts:- Daily , Weekly | |
| Add PLYA to Watchlist: View: Get Complete PLYA Trend Analysis ➞ | |
 | HGV Hilton Grand Vacations Inc. |
| Sector: Services & Goods | |
| SubSector: Resorts & Casinos | |
| MarketCap: 1333.04 Millions | |
| Recent Price: 43.16 Smart Investing & Trading Score: 42 | |
| Day Percent Change: 0.09% Day Change: 0.04 | |
| Week Change: -2.66% Year-to-date Change: 7.4% | |
| HGV Links: Profile News Message Board | |
| Charts:- Daily , Weekly | |
| Add HGV to Watchlist: View: Get Complete HGV Trend Analysis ➞ | |
 | WPP WPP plc |
| Sector: Services & Goods | |
| SubSector: Advertising Agencies | |
| MarketCap: 7840.25 Millions | |
| Recent Price: 51.07 Smart Investing & Trading Score: 90 | |
| Day Percent Change: 1.09% Day Change: 0.55 | |
| Week Change: 0.26% Year-to-date Change: 7.4% | |
| WPP Links: Profile News Message Board | |
| Charts:- Daily , Weekly | |
| Add WPP to Watchlist: View: Get Complete WPP Trend Analysis ➞ | |
| For tabular summary view of above stock list: Summary View ➞ 0 - 25 , 25 - 50 , 50 - 75 , 75 - 100 , 100 - 125 , 125 - 150 , 150 - 175 , 175 - 200 , 200 - 225 , 225 - 250 , 250 - 275 , 275 - 300 , 300 - 325 , 325 - 350 , 350 - 375 , 375 - 400 , 400 - 425 , 425 - 450 , 450 - 475 | ||
| Click To Change The Sort Order: By Market Cap or Company Size Performance: Year-to-date, Week and Day | |
| Select Chart Type: | ||
|
Best Stocks Today 12Stocks.com |
© 2024 12Stocks.com Terms & Conditions Privacy Contact Us
All Information Provided Only For Education And Not To Be Used For Investing or Trading. See Terms & Conditions


One More Thing ... Get Best Stocks Delivered Daily!
Never Ever Miss A Move With Our Top Ten Stocks Lists
Find Best Stocks In Any Market - Bull or Bear Market
Take A Peek At Our Top Ten Stocks Lists: Daily, Weekly, Year-to-Date & Top Trends
Find Best Stocks In Any Market - Bull or Bear Market
Take A Peek At Our Top Ten Stocks Lists: Daily, Weekly, Year-to-Date & Top Trends
Consumer Services Stocks With Best Up Trends [0-bearish to 100-bullish]: GameStop [100], El Pollo[100], Adtalem Global[100], Chicken Soup[100], Willdan [100], SunCar Technology[100], Frontier [100], Verra Mobility[100], Mondee [100], Laureate Education[100], Hesai [100]
Best Consumer Services Stocks Year-to-Date:
U Power[3264.96%], Vroom [2061.45%], Yatsen Holding[493.22%], Fluent [422.39%], Research[141.9%], Codere Online[131.85%], Carvana Co[129.83%], Sweetgreen [95.58%], RealReal [94.03%], Smart Share[68.93%], PaySign [68.93%] Best Consumer Services Stocks This Week:
Chicken Soup[192.17%], Carvana Co[44.31%], Smart Share[40.05%], GameStop [38.4%], Perdoceo Education[29.06%], CareDx [28.57%], Gannett Co[22.87%], Wayfair [22.26%], Adtalem Global[20.93%], Sunnova Energy[19.75%], WW [19.43%] Best Consumer Services Stocks Daily:
GameStop [29.08%], El Pollo[16.40%], Team [15.14%], Adtalem Global[14.66%], Chicken Soup[13.51%], WW [10.58%], Willdan [9.87%], U Power[9.44%], SunCar Technology[9.43%], Frontier [8.66%], Wayfair [8.44%]