
 Login Sign Up


| |||||
 |  | ||||

| 12Stocks.com Market Intelligence |
Best Consumer Services Stocks
| In a hurry? Services & Goods Stocks: Performance Trends Table, Stock Charts
Sort Consumer Services: Daily, Weekly, Year-to-Date, Market Cap & Trends. Filter Services & Goods stocks list by size: All Large Mid-Range Small |
| 12Stocks.com Consumer Services Stocks Performances & Trends Daily | |||||||||
|
|  The overall Smart Investing & Trading Score is 35 (0-bearish to 100-bullish) which puts Consumer Services sector in short term bearish to neutral trend. The Smart Investing & Trading Score from previous trading session is 7 and hence an improvement of trend.
| ||||||||
Here are the Smart Investing & Trading Scores of the most requested Consumer Services stocks at 12Stocks.com (click stock name for detailed review):
|


| Consider signing up for our daily 12Stocks.com "Best Stocks Newsletter". You will never ever miss a big stock move again! |
| 12Stocks.com: Investing in Consumer Services sector with Stocks | |
|
The following table helps investors and traders sort through current performance and trends (as measured by Smart Investing & Trading Score) of various
stocks in the Consumer Services sector. Quick View: Move mouse or cursor over stock symbol (ticker) to view short-term Technical chart and over stock name to view long term chart. Click on  to add stock symbol to your watchlist and to add stock symbol to your watchlist and  to view watchlist. Click on any ticker or stock name for detailed market intelligence report for that stock. to view watchlist. Click on any ticker or stock name for detailed market intelligence report for that stock. |
12Stocks.com Performance of Stocks in Consumer Services Sector
| Ticker | Stock Name | Watchlist | Category | Recent Price | Smart Investing & Trading Score | Change % | YTD Change% |
| MLCO | Melco Resorts |   | Casinos | 7.15 | 39 | 8.50% | -19.39% |
| BKE | Buckle | | Apparel | 38.25 | 57 | 2.96% | -19.51% |
| HVT | Haverty Furniture | | Retail | 28.52 | 0 | -8.03% | -19.66% |
| QS | QuantumScape | | Auto Parts | 5.58 | 42 | 3.14% | -19.71% |
| NEWT | Newtek Business | | Services | 11.01 | 37 | 2.42% | -20.22% |
| NCLH | Norwegian Cruise | | Casinos | 15.95 | 0 | -0.81% | -20.41% |
| AFYA | Afya | | Education | 17.42 | 44 | 0.81% | -20.57% |
| TLYS | Tilly s | | Apparel | 5.98 | 37 | 2.05% | -20.69% |
| RHI | Robert Half | | Staffing | 69.58 | 28 | 0.48% | -20.86% |
| DRVN | Driven Brands | | Auto & Truck Dealerships | 11.32 | 10 | -20.48% | -21.14% |
| GDEN | Golden Entertainment | | Casinos | 31.39 | 10 | 0.42% | -21.39% |
| IHS | IHS Holding | | Telecom Services | 3.62 | 88 | -0.14% | -21.41% |
| CONN | Conn s | | Retail | 3.48 | 10 | 0.87% | -21.62% |
| PZZA | Papa John | | Restaurants | 59.74 | 10 | -1.99% | -21.63% |
| UA | Under Armour | | Apparel | 6.52 | 37 | 1.24% | -21.92% |
| DLTH | Duluth | | Apparel | 4.20 | 0 | 2.44% | -21.93% |
| SBUX | Starbucks | | Restaurants | 74.93 | 0 | 0.66% | -21.96% |
| CCL | Carnival | | Casinos | 14.46 | 25 | -0.07% | -22.01% |
| CUK | Carnival | | Entertainment | 13.14 | 32 | 0.31% | -22.06% |
| STG | Sunlands Technology | | Education | 7.90 | 32 | -1.13% | -22.32% |
| TITN | Titan Machinery | | Equipment | 22.42 | 27 | 2.80% | -22.37% |
| MANU | Manchester United | | Sporting | 15.81 | 68 | -1.31% | -22.42% |
| LI | Li Auto | | Auto Manufacturers | 29.00 | 49 | 10.04% | -22.56% |
| CRMT | America s | | Automobile | 58.55 | 60 | 0.52% | -22.73% |
| RUSHB | Rush Enterprises | | Automobile | 40.94 | 17 | 1.51% | -22.73% |
| For chart view version of above stock list: Chart View ➞ 0 - 25 , 25 - 50 , 50 - 75 , 75 - 100 , 100 - 125 , 125 - 150 , 150 - 175 , 175 - 200 , 200 - 225 , 225 - 250 , 250 - 275 , 275 - 300 , 300 - 325 , 325 - 350 , 350 - 375 , 375 - 400 , 400 - 425 , 425 - 450 , 450 - 475 | ||
 | Click To Change The Sort Order: By Market Cap or Company Size Performance: Year-to-date, Week and Day |  |
|
Get the most comprehensive stock market coverage daily at 12Stocks.com ➞ Best Stocks Today ➞ Best Stocks Weekly ➞ Best Stocks Year-to-Date ➞ Best Stocks Trends ➞  Best Stocks Today 12Stocks.com Best Nasdaq Stocks ➞ Best S&P 500 Stocks ➞ Best Tech Stocks ➞ Best Biotech Stocks ➞ |
| Detailed Overview of Consumer Services Stocks |
| Consumer Services Technical Overview, Leaders & Laggards, Top Consumer Services ETF Funds & Detailed Consumer Services Stocks List, Charts, Trends & More |
| Consumer Services Sector: Technical Analysis, Trends & YTD Performance | |
| Consumer Services sector is composed of stocks
from retail, entertainment, media/publishing, consumer goods
and services subsectors. Consumer Services sector, as represented by XLY, an exchange-traded fund [ETF] that holds basket of Consumer Services stocks (e.g, Walmart, Alibaba) is down by -1.17% and is currently underperforming the overall market by -6.79% year-to-date. Below is a quick view of Technical charts and trends: |
|
 XLY Weekly Chart |
|
| Long Term Trend: Not Good | |
| Medium Term Trend: Deteriorating | |
 XLY Daily Chart |
|
| Short Term Trend: Deteriorating | |
| Overall Trend Score: 35 | |
| YTD Performance: -1.17% | |
| **Trend Scores & Views Are Only For Educational Purposes And Not For Investing | |
| 12Stocks.com: Top Performing Consumer Services Sector Stocks | ||||||||||||||||||||||||||||||||||||||||||||||||
 The top performing Consumer Services sector stocks year to date are
Now, more recently, over last week, the top performing Consumer Services sector stocks on the move are


|
||||||||||||||||||||||||||||||||||||||||||||||||
| 12Stocks.com: Investing in Consumer Services Sector using Exchange Traded Funds | |
|
The following table shows list of key exchange traded funds (ETF) that
help investors track Consumer Services Index. For detailed view, check out our ETF Funds section of our website. Quick View: Move mouse or cursor over ETF symbol (ticker) to view short-term Technical chart and over ETF name to view long term chart. Click on ticker or stock name for detailed view. Click on to add stock symbol to your watchlist and to view watchlist. |
12Stocks.com List of ETFs that track Consumer Services Index
| Ticker | ETF Name | Watchlist | Recent Price | Smart Investing & Trading Score | Change % | Week % | Year-to-date % |
| XLY | Consumer Discret Sel | | 176.72 | 35 | 1.26 | 0.46 | -1.17% |
| RTH | Retail | | 198.79 | 17 | 1.39 | -1.14 | 5.61% |
| IYC | Consumer Services | | 78.43 | 7 | 1.38 | 0.09 | 3.51% |
| XRT | Retail | | 72.49 | 32 | 1.70 | -1 | 0.24% |
| IYK | Consumer Goods | | 66.46 | 63 | 0.51 | -0.45 | 4% |
| UCC | Consumer Services | | 33.96 | 49 | 1.98 | -0.59 | -5.42% |
| RETL | Retail Bull 3X | | 8.53 | 5 | 5.44 | -3.4 | -6.47% |
| RXI | Globl Consumer Discretionary | | 161.47 | 27 | 1.46 | 0.18 | 1.52% |
| SCC | Short Consumer Services | | 15.64 | 88 | -2.13 | -0.89 | 2.06% |
| UGE | Consumer Goods | | 17.16 | 90 | 1.81 | -0.06 | 9.01% |
| 12Stocks.com: Charts, Trends, Fundamental Data and Performances of Consumer Services Stocks | |
|
We now take in-depth look at all Consumer Services stocks including charts, multi-period performances and overall trends (as measured by Smart Investing & Trading Score). One can sort Consumer Services stocks (click link to choose) by Daily, Weekly and by Year-to-Date performances. Also, one can sort by size of the company or by market capitalization. |
| Select Your Default Chart Type: | |||||
| |||||
| Click on stock symbol or name for detailed view. Click on to add stock symbol to your watchlist and to view watchlist. Quick View: Move mouse or cursor over "Daily" to quickly view daily Technical stock chart and over "Weekly" to view weekly Technical stock chart. | |||||

 | MLCO Melco Resorts & Entertainment Limited |
| Sector: Services & Goods | |
| SubSector: Resorts & Casinos | |
| MarketCap: 7031.14 Millions | |
| Recent Price: 7.15 Smart Investing & Trading Score: 39 | |
| Day Percent Change: 8.50% Day Change: 0.56 | |
| Week Change: 12.78% Year-to-date Change: -19.4% | |
| MLCO Links: Profile News Message Board | |
| Charts:- Daily , Weekly | |
| Add MLCO to Watchlist: View: Get Complete MLCO Trend Analysis ➞ | |
 | BKE The Buckle, Inc. |
| Sector: Services & Goods | |
| SubSector: Apparel Stores | |
| MarketCap: 913.808 Millions | |
| Recent Price: 38.25 Smart Investing & Trading Score: 57 | |
| Day Percent Change: 2.96% Day Change: 1.10 | |
| Week Change: 1.81% Year-to-date Change: -19.5% | |
| BKE Links: Profile News Message Board | |
| Charts:- Daily , Weekly | |
| Add BKE to Watchlist: View: Get Complete BKE Trend Analysis ➞ | |
 | HVT Haverty Furniture Companies, Inc. |
| Sector: Services & Goods | |
| SubSector: Home Furnishing Stores | |
| MarketCap: 253.125 Millions | |
| Recent Price: 28.52 Smart Investing & Trading Score: 0 | |
| Day Percent Change: -8.03% Day Change: -2.49 | |
| Week Change: -8.88% Year-to-date Change: -19.7% | |
| HVT Links: Profile News Message Board | |
| Charts:- Daily , Weekly | |
| Add HVT to Watchlist: View: Get Complete HVT Trend Analysis ➞ | |
 | QS QuantumScape Corporation |
| Sector: Services & Goods | |
| SubSector: Auto Parts | |
| MarketCap: 13137 Millions | |
| Recent Price: 5.58 Smart Investing & Trading Score: 42 | |
| Day Percent Change: 3.14% Day Change: 0.17 | |
| Week Change: 3.53% Year-to-date Change: -19.7% | |
| QS Links: Profile News Message Board | |
| Charts:- Daily , Weekly | |
| Add QS to Watchlist: View: Get Complete QS Trend Analysis ➞ | |
 | NEWT Newtek Business Services Corp. |
| Sector: Services & Goods | |
| SubSector: Business Services | |
| MarketCap: 243.982 Millions | |
| Recent Price: 11.01 Smart Investing & Trading Score: 37 | |
| Day Percent Change: 2.42% Day Change: 0.26 | |
| Week Change: 0.09% Year-to-date Change: -20.2% | |
| NEWT Links: Profile News Message Board | |
| Charts:- Daily , Weekly | |
| Add NEWT to Watchlist: View: Get Complete NEWT Trend Analysis ➞ | |
 | NCLH Norwegian Cruise Line Holdings Ltd. |
| Sector: Services & Goods | |
| SubSector: Resorts & Casinos | |
| MarketCap: 2895.54 Millions | |
| Recent Price: 15.95 Smart Investing & Trading Score: 0 | |
| Day Percent Change: -0.81% Day Change: -0.13 | |
| Week Change: -16.23% Year-to-date Change: -20.4% | |
| NCLH Links: Profile News Message Board | |
| Charts:- Daily , Weekly | |
| Add NCLH to Watchlist: View: Get Complete NCLH Trend Analysis ➞ | |
 | AFYA Afya Limited |
| Sector: Services & Goods | |
| SubSector: Education & Training Services | |
| MarketCap: 1559.26 Millions | |
| Recent Price: 17.42 Smart Investing & Trading Score: 44 | |
| Day Percent Change: 0.81% Day Change: 0.14 | |
| Week Change: -2.9% Year-to-date Change: -20.6% | |
| AFYA Links: Profile News Message Board | |
| Charts:- Daily , Weekly | |
| Add AFYA to Watchlist: View: Get Complete AFYA Trend Analysis ➞ | |
 | TLYS Tilly s, Inc. |
| Sector: Services & Goods | |
| SubSector: Apparel Stores | |
| MarketCap: 127.408 Millions | |
| Recent Price: 5.98 Smart Investing & Trading Score: 37 | |
| Day Percent Change: 2.05% Day Change: 0.12 | |
| Week Change: -0.5% Year-to-date Change: -20.7% | |
| TLYS Links: Profile News Message Board | |
| Charts:- Daily , Weekly | |
| Add TLYS to Watchlist: View: Get Complete TLYS Trend Analysis ➞ | |
 | RHI Robert Half International Inc. |
| Sector: Services & Goods | |
| SubSector: Staffing & Outsourcing Services | |
| MarketCap: 4302 Millions | |
| Recent Price: 69.58 Smart Investing & Trading Score: 28 | |
| Day Percent Change: 0.48% Day Change: 0.33 | |
| Week Change: 0.33% Year-to-date Change: -20.9% | |
| RHI Links: Profile News Message Board | |
| Charts:- Daily , Weekly | |
| Add RHI to Watchlist: View: Get Complete RHI Trend Analysis ➞ | |
 | DRVN Driven Brands Holdings Inc. |
| Sector: Services & Goods | |
| SubSector: Auto & Truck Dealerships | |
| MarketCap: 4490 Millions | |
| Recent Price: 11.32 Smart Investing & Trading Score: 10 | |
| Day Percent Change: -20.48% Day Change: -2.91 | |
| Week Change: -21.39% Year-to-date Change: -21.1% | |
| DRVN Links: Profile News Message Board | |
| Charts:- Daily , Weekly | |
| Add DRVN to Watchlist: View: Get Complete DRVN Trend Analysis ➞ | |
 | GDEN Golden Entertainment, Inc. |
| Sector: Services & Goods | |
| SubSector: Resorts & Casinos | |
| MarketCap: 130.794 Millions | |
| Recent Price: 31.39 Smart Investing & Trading Score: 10 | |
| Day Percent Change: 0.42% Day Change: 0.13 | |
| Week Change: -3.15% Year-to-date Change: -21.4% | |
| GDEN Links: Profile News Message Board | |
| Charts:- Daily , Weekly | |
| Add GDEN to Watchlist: View: Get Complete GDEN Trend Analysis ➞ | |
 | IHS IHS Holding Limited |
| Sector: Services & Goods | |
| SubSector: Telecom Services | |
| MarketCap: 3310 Millions | |
| Recent Price: 3.62 Smart Investing & Trading Score: 88 | |
| Day Percent Change: -0.14% Day Change: 0.00 | |
| Week Change: 2.41% Year-to-date Change: -21.4% | |
| IHS Links: Profile News Message Board | |
| Charts:- Daily , Weekly | |
| Add IHS to Watchlist: View: Get Complete IHS Trend Analysis ➞ | |
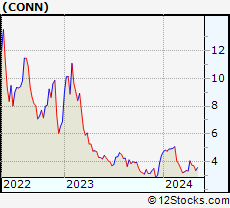 | CONN Conn s, Inc. |
| Sector: Services & Goods | |
| SubSector: Electronics Stores | |
| MarketCap: 153.2 Millions | |
| Recent Price: 3.48 Smart Investing & Trading Score: 10 | |
| Day Percent Change: 0.87% Day Change: 0.03 | |
| Week Change: -6.07% Year-to-date Change: -21.6% | |
| CONN Links: Profile News Message Board | |
| Charts:- Daily , Weekly | |
| Add CONN to Watchlist: View: Get Complete CONN Trend Analysis ➞ | |
 | PZZA Papa John s International, Inc. |
| Sector: Services & Goods | |
| SubSector: Specialty Eateries | |
| MarketCap: 1925.27 Millions | |
| Recent Price: 59.74 Smart Investing & Trading Score: 10 | |
| Day Percent Change: -1.99% Day Change: -1.21 | |
| Week Change: -5.32% Year-to-date Change: -21.6% | |
| PZZA Links: Profile News Message Board | |
| Charts:- Daily , Weekly | |
| Add PZZA to Watchlist: View: Get Complete PZZA Trend Analysis ➞ | |
 | UA Under Armour, Inc. |
| Sector: Services & Goods | |
| SubSector: Textile - Apparel Clothing | |
| MarketCap: 3926.93 Millions | |
| Recent Price: 6.52 Smart Investing & Trading Score: 37 | |
| Day Percent Change: 1.24% Day Change: 0.08 | |
| Week Change: -0.46% Year-to-date Change: -21.9% | |
| UA Links: Profile News Message Board | |
| Charts:- Daily , Weekly | |
| Add UA to Watchlist: View: Get Complete UA Trend Analysis ➞ | |
 | DLTH Duluth Holdings Inc. |
| Sector: Services & Goods | |
| SubSector: Apparel Stores | |
| MarketCap: 180.008 Millions | |
| Recent Price: 4.20 Smart Investing & Trading Score: 0 | |
| Day Percent Change: 2.44% Day Change: 0.10 | |
| Week Change: -4% Year-to-date Change: -21.9% | |
| DLTH Links: Profile News Message Board | |
| Charts:- Daily , Weekly | |
| Add DLTH to Watchlist: View: Get Complete DLTH Trend Analysis ➞ | |
 | SBUX Starbucks Corporation |
| Sector: Services & Goods | |
| SubSector: Specialty Eateries | |
| MarketCap: 74909.7 Millions | |
| Recent Price: 74.93 Smart Investing & Trading Score: 0 | |
| Day Percent Change: 0.66% Day Change: 0.49 | |
| Week Change: -15.09% Year-to-date Change: -22.0% | |
| SBUX Links: Profile News Message Board | |
| Charts:- Daily , Weekly | |
| Add SBUX to Watchlist: View: Get Complete SBUX Trend Analysis ➞ | |
 | CCL Carnival Corporation & Plc |
| Sector: Services & Goods | |
| SubSector: Resorts & Casinos | |
| MarketCap: 11725.4 Millions | |
| Recent Price: 14.46 Smart Investing & Trading Score: 25 | |
| Day Percent Change: -0.07% Day Change: -0.01 | |
| Week Change: -4.11% Year-to-date Change: -22.0% | |
| CCL Links: Profile News Message Board | |
| Charts:- Daily , Weekly | |
| Add CCL to Watchlist: View: Get Complete CCL Trend Analysis ➞ | |
 | CUK Carnival Corporation & Plc |
| Sector: Services & Goods | |
| SubSector: General Entertainment | |
| MarketCap: 10703.9 Millions | |
| Recent Price: 13.14 Smart Investing & Trading Score: 32 | |
| Day Percent Change: 0.31% Day Change: 0.04 | |
| Week Change: -3.38% Year-to-date Change: -22.1% | |
| CUK Links: Profile News Message Board | |
| Charts:- Daily , Weekly | |
| Add CUK to Watchlist: View: Get Complete CUK Trend Analysis ➞ | |
 | STG Sunlands Technology Group |
| Sector: Services & Goods | |
| SubSector: Education & Training Services | |
| MarketCap: 295.706 Millions | |
| Recent Price: 7.90 Smart Investing & Trading Score: 32 | |
| Day Percent Change: -1.13% Day Change: -0.09 | |
| Week Change: -0.69% Year-to-date Change: -22.3% | |
| STG Links: Profile News Message Board | |
| Charts:- Daily , Weekly | |
| Add STG to Watchlist: View: Get Complete STG Trend Analysis ➞ | |
 | TITN Titan Machinery Inc. |
| Sector: Services & Goods | |
| SubSector: Industrial Equipment Wholesale | |
| MarketCap: 208.958 Millions | |
| Recent Price: 22.42 Smart Investing & Trading Score: 27 | |
| Day Percent Change: 2.80% Day Change: 0.61 | |
| Week Change: -1.23% Year-to-date Change: -22.4% | |
| TITN Links: Profile News Message Board | |
| Charts:- Daily , Weekly | |
| Add TITN to Watchlist: View: Get Complete TITN Trend Analysis ➞ | |
 | MANU Manchester United plc |
| Sector: Services & Goods | |
| SubSector: Sporting Activities | |
| MarketCap: 2537.74 Millions | |
| Recent Price: 15.81 Smart Investing & Trading Score: 68 | |
| Day Percent Change: -1.31% Day Change: -0.21 | |
| Week Change: -1.62% Year-to-date Change: -22.4% | |
| MANU Links: Profile News Message Board | |
| Charts:- Daily , Weekly | |
| Add MANU to Watchlist: View: Get Complete MANU Trend Analysis ➞ | |
 | LI Li Auto Inc. |
| Sector: Services & Goods | |
| SubSector: Auto Manufacturers | |
| MarketCap: 29167 Millions | |
| Recent Price: 29.00 Smart Investing & Trading Score: 49 | |
| Day Percent Change: 10.04% Day Change: 2.64 | |
| Week Change: 15.79% Year-to-date Change: -22.6% | |
| LI Links: Profile News Message Board | |
| Charts:- Daily , Weekly | |
| Add LI to Watchlist: View: Get Complete LI Trend Analysis ➞ | |
 | CRMT America s Car-Mart, Inc. |
| Sector: Services & Goods | |
| SubSector: Auto Dealerships | |
| MarketCap: 329.921 Millions | |
| Recent Price: 58.55 Smart Investing & Trading Score: 60 | |
| Day Percent Change: 0.52% Day Change: 0.30 | |
| Week Change: 1.18% Year-to-date Change: -22.7% | |
| CRMT Links: Profile News Message Board | |
| Charts:- Daily , Weekly | |
| Add CRMT to Watchlist: View: Get Complete CRMT Trend Analysis ➞ | |
 | RUSHB Rush Enterprises, Inc. |
| Sector: Services & Goods | |
| SubSector: Auto Dealerships | |
| MarketCap: 203.221 Millions | |
| Recent Price: 40.94 Smart Investing & Trading Score: 17 | |
| Day Percent Change: 1.51% Day Change: 0.61 | |
| Week Change: -8.08% Year-to-date Change: -22.7% | |
| RUSHB Links: Profile News Message Board | |
| Charts:- Daily , Weekly | |
| Add RUSHB to Watchlist: View: Get Complete RUSHB Trend Analysis ➞ | |
| For tabular summary view of above stock list: Summary View ➞ 0 - 25 , 25 - 50 , 50 - 75 , 75 - 100 , 100 - 125 , 125 - 150 , 150 - 175 , 175 - 200 , 200 - 225 , 225 - 250 , 250 - 275 , 275 - 300 , 300 - 325 , 325 - 350 , 350 - 375 , 375 - 400 , 400 - 425 , 425 - 450 , 450 - 475 | ||
| Click To Change The Sort Order: By Market Cap or Company Size Performance: Year-to-date, Week and Day | |
| Select Chart Type: | ||
|
Best Stocks Today 12Stocks.com |
© 2024 12Stocks.com Terms & Conditions Privacy Contact Us
All Information Provided Only For Education And Not To Be Used For Investing or Trading. See Terms & Conditions


One More Thing ... Get Best Stocks Delivered Daily!
Never Ever Miss A Move With Our Top Ten Stocks Lists
Find Best Stocks In Any Market - Bull or Bear Market
Take A Peek At Our Top Ten Stocks Lists: Daily, Weekly, Year-to-Date & Top Trends
Find Best Stocks In Any Market - Bull or Bear Market
Take A Peek At Our Top Ten Stocks Lists: Daily, Weekly, Year-to-Date & Top Trends
Consumer Services Stocks With Best Up Trends [0-bearish to 100-bullish]: Perdoceo Education[100], Gannett Co[100], Sprouts Farmers[100], MINISO [100], Smart Share[100], Dada Nexus[100], Thomson Reuters[100], Gray Television[100], WESCO [100], Alibaba [100], Tetra Tech[100]
Best Consumer Services Stocks Year-to-Date:
U Power[2974.78%], Vroom [1965.31%], Yatsen Holding[475.45%], Fluent [397.76%], Research[138.8%], Codere Online[132.88%], Carvana Co[120.06%], Sweetgreen [88.85%], RealReal [87.56%], Smart Share[68.74%], PaySign [64.64%] Best Consumer Services Stocks This Week:
Chicken Soup[157.39%], Smart Share[39.89%], Carvana Co[38.18%], Perdoceo Education[27.84%], Olaplex [24.63%], CareDx [22.62%], Polestar Automotive[21.61%], XPeng [19.9%], Gannett Co[18.6%], OneSpaWorld [16.28%], Li Auto[15.79%] Best Consumer Services Stocks Daily:
Carvana Co[33.77%], Perdoceo Education[31.46%], Gannett Co[26.97%], Sunnova Energy[25.21%], Chicken Soup[20.82%], Olaplex [19.29%], GameStop [16.96%], Wayfair [16.05%], XPeng [15.76%], Children s[14.88%], OneWater Marine[14.09%]