
 Login Sign Up


| |||||
 |  | ||||

| 12Stocks.com Market Intelligence |
Best Consumer Services Stocks
| In a hurry? Services & Goods Stocks: Performance Trends Table, Stock Charts
Sort Consumer Services: Daily, Weekly, Year-to-Date, Market Cap & Trends. Filter Services & Goods stocks list by size: All Large Mid-Range Small |
| 12Stocks.com Consumer Services Stocks Performances & Trends Daily | |||||||||
|
|  The overall Smart Investing & Trading Score is 51 (0-bearish to 100-bullish) which puts Consumer Services sector in short term neutral trend. The Smart Investing & Trading Score from previous trading session is 58 and hence a deterioration of trend.
| ||||||||
Here are the Smart Investing & Trading Scores of the most requested Consumer Services stocks at 12Stocks.com (click stock name for detailed review):
|


| Consider signing up for our daily 12Stocks.com "Best Stocks Newsletter". You will never ever miss a big stock move again! |
| 12Stocks.com: Investing in Consumer Services sector with Stocks | |
|
The following table helps investors and traders sort through current performance and trends (as measured by Smart Investing & Trading Score) of various
stocks in the Consumer Services sector. Quick View: Move mouse or cursor over stock symbol (ticker) to view short-term Technical chart and over stock name to view long term chart. Click on  to add stock symbol to your watchlist and to add stock symbol to your watchlist and  to view watchlist. Click on any ticker or stock name for detailed market intelligence report for that stock. to view watchlist. Click on any ticker or stock name for detailed market intelligence report for that stock. |
12Stocks.com Performance of Stocks in Consumer Services Sector
| Ticker | Stock Name | Watchlist | Category | Recent Price | Smart Investing & Trading Score | Change % | YTD Change% |
| CUK | Carnival |   | Entertainment | 13.72 | 57 | 0.88% | -18.62% |
| VVI | Viad Corp | | Services | 34.62 | 56 | -2.37% | -4.36% |
| MSA | MSA Safety | | Security | 188.71 | 56 | -1.05% | 11.78% |
| GK | G&K Services | | Services | 19.40 | 56 | -0.21% | 7.00% |
| UTI | Universal Technical | | Education | 14.89 | 56 | 1.85% | 18.93% |
| ETSY | Etsy | | Retail | 67.20 | 56 | 0.49% | -17.09% |
| CARG | CarGurus | | Automobile | 22.87 | 56 | -2.01% | -5.34% |
| RBA | Ritchie Bros. | | Services | 73.33 | 56 | -0.05% | 9.63% |
| GOLF | Acushnet | | Retail | 61.57 | 55 | -2.52% | -2.53% |
| MCS | Marcus | | Entertainment | 13.47 | 55 | -1.32% | -7.61% |
| BKE | Buckle | | Apparel | 36.71 | 55 | -1.10% | -22.75% |
| FC | Franklin Covey | | Education | 39.33 | 55 | -0.63% | -9.65% |
| IHS | IHS Holding | | Telecom Services | 3.44 | 54 | 1.33% | -25.22% |
| EBAY | eBay | | Retail | 51.34 | 54 | 0.31% | 17.70% |
| OMI | Owens & Minor | | Medical | 24.12 | 54 | -2.51% | 25.17% |
| DIS | Walt Disney | | Entertainment | 112.77 | 54 | -1.01% | 24.90% |
| ACM | AECOM | | Services | 93.59 | 54 | -0.45% | 1.26% |
| DG | Dollar General | | Retail | 142.65 | 54 | -0.36% | 4.93% |
| BKR | Baker Hughes | | Services | 33.29 | 53 | 1.99% | -2.60% |
| BJ | BJ s | | Retail | 76.38 | 53 | 0.79% | 14.58% |
| ACVA | ACV Auctions | | Auto & Truck Dealerships | 17.72 | 53 | -2.72% | 17.66% |
| REAL | RealReal | | Retail | 3.40 | 53 | -1.30% | 69.40% |
| NL | NL Industries | | Equipment | 7.90 | 53 | -1.13% | 40.82% |
| PSMT | PriceSmart | | Retail | 80.17 | 53 | -0.91% | 5.79% |
| TRU | TransUnion | | Services | 74.29 | 52 | 8.17% | 8.12% |
| For chart view version of above stock list: Chart View ➞ 0 - 25 , 25 - 50 , 50 - 75 , 75 - 100 , 100 - 125 , 125 - 150 , 150 - 175 , 175 - 200 , 200 - 225 , 225 - 250 , 250 - 275 , 275 - 300 , 300 - 325 , 325 - 350 , 350 - 375 , 375 - 400 , 400 - 425 , 425 - 450 , 450 - 475 | ||
 | Click To Change The Sort Order: By Market Cap or Company Size Performance: Year-to-date, Week and Day |  |
|
Get the most comprehensive stock market coverage daily at 12Stocks.com ➞ Best Stocks Today ➞ Best Stocks Weekly ➞ Best Stocks Year-to-Date ➞ Best Stocks Trends ➞  Best Stocks Today 12Stocks.com Best Nasdaq Stocks ➞ Best S&P 500 Stocks ➞ Best Tech Stocks ➞ Best Biotech Stocks ➞ |
| Detailed Overview of Consumer Services Stocks |
| Consumer Services Technical Overview, Leaders & Laggards, Top Consumer Services ETF Funds & Detailed Consumer Services Stocks List, Charts, Trends & More |
| Consumer Services Sector: Technical Analysis, Trends & YTD Performance | |
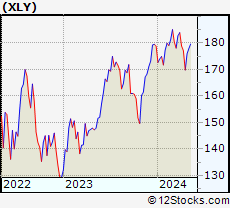
| Consumer Services sector is composed of stocks
from retail, entertainment, media/publishing, consumer goods
and services subsectors. Consumer Services sector, as represented by XLY, an exchange-traded fund [ETF] that holds basket of Consumer Services stocks (e.g, Walmart, Alibaba) is down by -2.5% and is currently underperforming the overall market by -7.66% year-to-date. Below is a quick view of Technical charts and trends: |
|
 XLY Weekly Chart |
|
| Long Term Trend: Good | |
| Medium Term Trend: Not Good | |
 XLY Daily Chart |
|
| Short Term Trend: Very Good | |
| Overall Trend Score: 51 | |
| YTD Performance: -2.5% | |
| **Trend Scores & Views Are Only For Educational Purposes And Not For Investing | |
| 12Stocks.com: Top Performing Consumer Services Sector Stocks | ||||||||||||||||||||||||||||||||||||||||||||||||
 The top performing Consumer Services sector stocks year to date are
Now, more recently, over last week, the top performing Consumer Services sector stocks on the move are


|
||||||||||||||||||||||||||||||||||||||||||||||||
| 12Stocks.com: Investing in Consumer Services Sector using Exchange Traded Funds | |
|
The following table shows list of key exchange traded funds (ETF) that
help investors track Consumer Services Index. For detailed view, check out our ETF Funds section of our website. Quick View: Move mouse or cursor over ETF symbol (ticker) to view short-term Technical chart and over ETF name to view long term chart. Click on ticker or stock name for detailed view. Click on to add stock symbol to your watchlist and to view watchlist. |
12Stocks.com List of ETFs that track Consumer Services Index
| Ticker | ETF Name | Watchlist | Recent Price | Smart Investing & Trading Score | Change % | Week % | Year-to-date % |
| XLY | Consumer Discret Sel | | 174.34 | 51 | 0.09 | 2.7 | -2.5% |
| RTH | Retail | | 198.66 | 44 | -0.57 | 0.02 | 5.54% |
| IYC | Consumer Services | | 77.87 | 36 | 0.05 | 2.1 | 2.77% |
| XRT | Retail | | 72.21 | 51 | -0.43 | 1.46 | -0.15% |
| IYK | Consumer Goods | | 66.98 | 75 | -0.33 | 1.78 | 4.81% |
| UCC | Consumer Services | | 33.25 | 66 | -0.36 | 5.3 | -7.4% |
| RETL | Retail Bull 3X | | 8.47 | 48 | -1.40 | 4.31 | -7.13% |
| RXI | Globl Consumer Discretionary | | 159.18 | 36 | -0.69 | 1.29 | 0.08% |
| SCC | Short Consumer Services | | 16.06 | 42 | -0.37 | -5.27 | 4.8% |
| UGE | Consumer Goods | | 17.12 | 90 | -0.70 | 2.96 | 8.76% |
| 12Stocks.com: Charts, Trends, Fundamental Data and Performances of Consumer Services Stocks | |
|
We now take in-depth look at all Consumer Services stocks including charts, multi-period performances and overall trends (as measured by Smart Investing & Trading Score). One can sort Consumer Services stocks (click link to choose) by Daily, Weekly and by Year-to-Date performances. Also, one can sort by size of the company or by market capitalization. |
| Select Your Default Chart Type: | |||||
| |||||
| Click on stock symbol or name for detailed view. Click on to add stock symbol to your watchlist and to view watchlist. Quick View: Move mouse or cursor over "Daily" to quickly view daily Technical stock chart and over "Weekly" to view weekly Technical stock chart. | |||||

 | CUK Carnival Corporation & Plc |
| Sector: Services & Goods | |
| SubSector: General Entertainment | |
| MarketCap: 10703.9 Millions | |
| Recent Price: 13.72 Smart Investing & Trading Score: 57 | |
| Day Percent Change: 0.88% Day Change: 0.12 | |
| Week Change: 7.78% Year-to-date Change: -18.6% | |
| CUK Links: Profile News Message Board | |
| Charts:- Daily , Weekly | |
| Add CUK to Watchlist: View: Get Complete CUK Trend Analysis ➞ | |
 | VVI Viad Corp |
| Sector: Services & Goods | |
| SubSector: Business Services | |
| MarketCap: 270.682 Millions | |
| Recent Price: 34.62 Smart Investing & Trading Score: 56 | |
| Day Percent Change: -2.37% Day Change: -0.84 | |
| Week Change: -0.29% Year-to-date Change: -4.4% | |
| VVI Links: Profile News Message Board | |
| Charts:- Daily , Weekly | |
| Add VVI to Watchlist: View: Get Complete VVI Trend Analysis ➞ | |
 | MSA MSA Safety Incorporated |
| Sector: Services & Goods | |
| SubSector: Security & Protection Services | |
| MarketCap: 4167.83 Millions | |
| Recent Price: 188.71 Smart Investing & Trading Score: 56 | |
| Day Percent Change: -1.05% Day Change: -2.01 | |
| Week Change: 1.8% Year-to-date Change: 11.8% | |
| MSA Links: Profile News Message Board | |
| Charts:- Daily , Weekly | |
| Add MSA to Watchlist: View: Get Complete MSA Trend Analysis ➞ | |
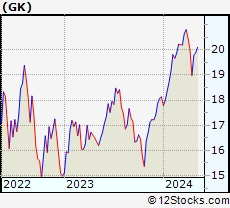 | GK G&K Services, Inc. |
| Sector: Services & Goods | |
| SubSector: Personal Services | |
| MarketCap: 1861.21 Millions | |
| Recent Price: 19.40 Smart Investing & Trading Score: 56 | |
| Day Percent Change: -0.21% Day Change: -0.04 | |
| Week Change: 2.19% Year-to-date Change: 7.0% | |
| GK Links: Profile News Message Board | |
| Charts:- Daily , Weekly | |
| Add GK to Watchlist: View: Get Complete GK Trend Analysis ➞ | |
 | UTI Universal Technical Institute, Inc. |
| Sector: Services & Goods | |
| SubSector: Education & Training Services | |
| MarketCap: 163.506 Millions | |
| Recent Price: 14.89 Smart Investing & Trading Score: 56 | |
| Day Percent Change: 1.85% Day Change: 0.27 | |
| Week Change: 2.13% Year-to-date Change: 18.9% | |
| UTI Links: Profile News Message Board | |
| Charts:- Daily , Weekly | |
| Add UTI to Watchlist: View: Get Complete UTI Trend Analysis ➞ | |
 | ETSY Etsy, Inc. |
| Sector: Services & Goods | |
| SubSector: Specialty Retail, Other | |
| MarketCap: 4263.24 Millions | |
| Recent Price: 67.20 Smart Investing & Trading Score: 56 | |
| Day Percent Change: 0.49% Day Change: 0.33 | |
| Week Change: 0.66% Year-to-date Change: -17.1% | |
| ETSY Links: Profile News Message Board | |
| Charts:- Daily , Weekly | |
| Add ETSY to Watchlist: View: Get Complete ETSY Trend Analysis ➞ | |
 | CARG CarGurus, Inc. |
| Sector: Services & Goods | |
| SubSector: Auto Dealerships | |
| MarketCap: 2099.31 Millions | |
| Recent Price: 22.87 Smart Investing & Trading Score: 56 | |
| Day Percent Change: -2.01% Day Change: -0.47 | |
| Week Change: 2.99% Year-to-date Change: -5.3% | |
| CARG Links: Profile News Message Board | |
| Charts:- Daily , Weekly | |
| Add CARG to Watchlist: View: Get Complete CARG Trend Analysis ➞ | |
 | RBA Ritchie Bros. Auctioneers Incorporated |
| Sector: Services & Goods | |
| SubSector: Business Services | |
| MarketCap: 3491.02 Millions | |
| Recent Price: 73.33 Smart Investing & Trading Score: 56 | |
| Day Percent Change: -0.05% Day Change: -0.04 | |
| Week Change: 0.99% Year-to-date Change: 9.6% | |
| RBA Links: Profile News Message Board | |
| Charts:- Daily , Weekly | |
| Add RBA to Watchlist: View: Get Complete RBA Trend Analysis ➞ | |
 | GOLF Acushnet Holdings Corp. |
| Sector: Services & Goods | |
| SubSector: Sporting Goods Stores | |
| MarketCap: 1717.74 Millions | |
| Recent Price: 61.57 Smart Investing & Trading Score: 55 | |
| Day Percent Change: -2.52% Day Change: -1.59 | |
| Week Change: -0.89% Year-to-date Change: -2.5% | |
| GOLF Links: Profile News Message Board | |
| Charts:- Daily , Weekly | |
| Add GOLF to Watchlist: View: Get Complete GOLF Trend Analysis ➞ | |
 | MCS The Marcus Corporation |
| Sector: Services & Goods | |
| SubSector: Entertainment - Diversified | |
| MarketCap: 441.437 Millions | |
| Recent Price: 13.47 Smart Investing & Trading Score: 55 | |
| Day Percent Change: -1.32% Day Change: -0.18 | |
| Week Change: 1.97% Year-to-date Change: -7.6% | |
| MCS Links: Profile News Message Board | |
| Charts:- Daily , Weekly | |
| Add MCS to Watchlist: View: Get Complete MCS Trend Analysis ➞ | |
 | BKE The Buckle, Inc. |
| Sector: Services & Goods | |
| SubSector: Apparel Stores | |
| MarketCap: 913.808 Millions | |
| Recent Price: 36.71 Smart Investing & Trading Score: 55 | |
| Day Percent Change: -1.10% Day Change: -0.41 | |
| Week Change: 0.33% Year-to-date Change: -22.8% | |
| BKE Links: Profile News Message Board | |
| Charts:- Daily , Weekly | |
| Add BKE to Watchlist: View: Get Complete BKE Trend Analysis ➞ | |
 | FC Franklin Covey Co. |
| Sector: Services & Goods | |
| SubSector: Education & Training Services | |
| MarketCap: 243.306 Millions | |
| Recent Price: 39.33 Smart Investing & Trading Score: 55 | |
| Day Percent Change: -0.63% Day Change: -0.25 | |
| Week Change: -0.38% Year-to-date Change: -9.7% | |
| FC Links: Profile News Message Board | |
| Charts:- Daily , Weekly | |
| Add FC to Watchlist: View: Get Complete FC Trend Analysis ➞ | |
 | IHS IHS Holding Limited |
| Sector: Services & Goods | |
| SubSector: Telecom Services | |
| MarketCap: 3310 Millions | |
| Recent Price: 3.44 Smart Investing & Trading Score: 54 | |
| Day Percent Change: 1.33% Day Change: 0.04 | |
| Week Change: 3.61% Year-to-date Change: -25.2% | |
| IHS Links: Profile News Message Board | |
| Charts:- Daily , Weekly | |
| Add IHS to Watchlist: View: Get Complete IHS Trend Analysis ➞ | |
 | EBAY eBay Inc. |
| Sector: Services & Goods | |
| SubSector: Specialty Retail, Other | |
| MarketCap: 23152.3 Millions | |
| Recent Price: 51.34 Smart Investing & Trading Score: 54 | |
| Day Percent Change: 0.31% Day Change: 0.16 | |
| Week Change: 1.89% Year-to-date Change: 17.7% | |
| EBAY Links: Profile News Message Board | |
| Charts:- Daily , Weekly | |
| Add EBAY to Watchlist: View: Get Complete EBAY Trend Analysis ➞ | |
 | OMI Owens & Minor, Inc. |
| Sector: Services & Goods | |
| SubSector: Medical Equipment Wholesale | |
| MarketCap: 403.92 Millions | |
| Recent Price: 24.12 Smart Investing & Trading Score: 54 | |
| Day Percent Change: -2.51% Day Change: -0.62 | |
| Week Change: -2.7% Year-to-date Change: 25.2% | |
| OMI Links: Profile News Message Board | |
| Charts:- Daily , Weekly | |
| Add OMI to Watchlist: View: Get Complete OMI Trend Analysis ➞ | |
 | DIS The Walt Disney Company |
| Sector: Services & Goods | |
| SubSector: Entertainment - Diversified | |
| MarketCap: 178396 Millions | |
| Recent Price: 112.77 Smart Investing & Trading Score: 54 | |
| Day Percent Change: -1.01% Day Change: -1.15 | |
| Week Change: 0.14% Year-to-date Change: 24.9% | |
| DIS Links: Profile News Message Board | |
| Charts:- Daily , Weekly | |
| Add DIS to Watchlist: View: Get Complete DIS Trend Analysis ➞ | |
 | ACM AECOM |
| Sector: Services & Goods | |
| SubSector: Technical Services | |
| MarketCap: 4781.9 Millions | |
| Recent Price: 93.59 Smart Investing & Trading Score: 54 | |
| Day Percent Change: -0.45% Day Change: -0.42 | |
| Week Change: 0.26% Year-to-date Change: 1.3% | |
| ACM Links: Profile News Message Board | |
| Charts:- Daily , Weekly | |
| Add ACM to Watchlist: View: Get Complete ACM Trend Analysis ➞ | |
 | DG Dollar General Corporation |
| Sector: Services & Goods | |
| SubSector: Discount, Variety Stores | |
| MarketCap: 39611.9 Millions | |
| Recent Price: 142.65 Smart Investing & Trading Score: 54 | |
| Day Percent Change: -0.36% Day Change: -0.51 | |
| Week Change: -1.5% Year-to-date Change: 4.9% | |
| DG Links: Profile News Message Board | |
| Charts:- Daily , Weekly | |
| Add DG to Watchlist: View: Get Complete DG Trend Analysis ➞ | |
 | BKR Baker Hughes Company |
| Sector: Services & Goods | |
| SubSector: Technical Services | |
| MarketCap: 1330 Millions | |
| Recent Price: 33.29 Smart Investing & Trading Score: 53 | |
| Day Percent Change: 1.99% Day Change: 0.65 | |
| Week Change: 2.15% Year-to-date Change: -2.6% | |
| BKR Links: Profile News Message Board | |
| Charts:- Daily , Weekly | |
| Add BKR to Watchlist: View: Get Complete BKR Trend Analysis ➞ | |
 | BJ BJ s Wholesale Club Holdings, Inc. |
| Sector: Services & Goods | |
| SubSector: Discount, Variety Stores | |
| MarketCap: 3346.02 Millions | |
| Recent Price: 76.38 Smart Investing & Trading Score: 53 | |
| Day Percent Change: 0.79% Day Change: 0.60 | |
| Week Change: 3.58% Year-to-date Change: 14.6% | |
| BJ Links: Profile News Message Board | |
| Charts:- Daily , Weekly | |
| Add BJ to Watchlist: View: Get Complete BJ Trend Analysis ➞ | |
 | ACVA ACV Auctions Inc. |
| Sector: Services & Goods | |
| SubSector: Auto & Truck Dealerships | |
| MarketCap: 2680 Millions | |
| Recent Price: 17.72 Smart Investing & Trading Score: 53 | |
| Day Percent Change: -2.72% Day Change: -0.50 | |
| Week Change: 2.37% Year-to-date Change: 17.7% | |
| ACVA Links: Profile News Message Board | |
| Charts:- Daily , Weekly | |
| Add ACVA to Watchlist: View: Get Complete ACVA Trend Analysis ➞ | |
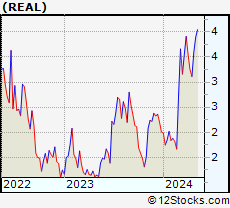 | REAL The RealReal, Inc. |
| Sector: Services & Goods | |
| SubSector: Specialty Retail, Other | |
| MarketCap: 839.344 Millions | |
| Recent Price: 3.40 Smart Investing & Trading Score: 53 | |
| Day Percent Change: -1.30% Day Change: -0.05 | |
| Week Change: 9.49% Year-to-date Change: 69.4% | |
| REAL Links: Profile News Message Board | |
| Charts:- Daily , Weekly | |
| Add REAL to Watchlist: View: Get Complete REAL Trend Analysis ➞ | |
 | NL NL Industries, Inc. |
| Sector: Services & Goods | |
| SubSector: Industrial Equipment Wholesale | |
| MarketCap: 126.258 Millions | |
| Recent Price: 7.90 Smart Investing & Trading Score: 53 | |
| Day Percent Change: -1.13% Day Change: -0.09 | |
| Week Change: 1.15% Year-to-date Change: 40.8% | |
| NL Links: Profile News Message Board | |
| Charts:- Daily , Weekly | |
| Add NL to Watchlist: View: Get Complete NL Trend Analysis ➞ | |
 | PSMT PriceSmart, Inc. |
| Sector: Services & Goods | |
| SubSector: Discount, Variety Stores | |
| MarketCap: 1655.72 Millions | |
| Recent Price: 80.17 Smart Investing & Trading Score: 53 | |
| Day Percent Change: -0.91% Day Change: -0.74 | |
| Week Change: -3.23% Year-to-date Change: 5.8% | |
| PSMT Links: Profile News Message Board | |
| Charts:- Daily , Weekly | |
| Add PSMT to Watchlist: View: Get Complete PSMT Trend Analysis ➞ | |
 | TRU TransUnion |
| Sector: Services & Goods | |
| SubSector: Business Services | |
| MarketCap: 11457.2 Millions | |
| Recent Price: 74.29 Smart Investing & Trading Score: 52 | |
| Day Percent Change: 8.17% Day Change: 5.61 | |
| Week Change: 11.38% Year-to-date Change: 8.1% | |
| TRU Links: Profile News Message Board | |
| Charts:- Daily , Weekly | |
| Add TRU to Watchlist: View: Get Complete TRU Trend Analysis ➞ | |
| For tabular summary view of above stock list: Summary View ➞ 0 - 25 , 25 - 50 , 50 - 75 , 75 - 100 , 100 - 125 , 125 - 150 , 150 - 175 , 175 - 200 , 200 - 225 , 225 - 250 , 250 - 275 , 275 - 300 , 300 - 325 , 325 - 350 , 350 - 375 , 375 - 400 , 400 - 425 , 425 - 450 , 450 - 475 | ||
| Click To Change The Sort Order: By Market Cap or Company Size Performance: Year-to-date, Week and Day | |
| Select Chart Type: | ||
|
Best Stocks Today 12Stocks.com |
© 2024 12Stocks.com Terms & Conditions Privacy Contact Us
All Information Provided Only For Education And Not To Be Used For Investing or Trading. See Terms & Conditions


One More Thing ... Get Best Stocks Delivered Daily!
Never Ever Miss A Move With Our Top Ten Stocks Lists
Find Best Stocks In Any Market - Bull or Bear Market
Take A Peek At Our Top Ten Stocks Lists: Daily, Weekly, Year-to-Date & Top Trends
Find Best Stocks In Any Market - Bull or Bear Market
Take A Peek At Our Top Ten Stocks Lists: Daily, Weekly, Year-to-Date & Top Trends
Consumer Services Stocks With Best Up Trends [0-bearish to 100-bullish]: Ardagh Metal[100], Chipotle Mexican[100], Churchill Downs[100], Yatsen Holding[100], Tractor Supply[100], Omnicom [100], Dada Nexus[100], FTI Consulting[100], Avnet [100], Alibaba [100], 1[100]
Best Consumer Services Stocks Year-to-Date:
U Power[2852.01%], Vroom [1804.53%], Yatsen Holding[502.79%], Fluent [298.51%], Codere Online[133.9%], Research[104.68%], Sweetgreen [101.42%], RealReal [69.4%], PaySign [56.43%], Bright Scholar[56%], Spotify Technology[53.81%] Best Consumer Services Stocks This Week:
Chicken Soup[210%], Yatsen Holding[21.99%], Hibbett Sports[21.03%], Strategic Education[19.29%], Noodles & [18.07%], K12 [17.39%], TAL Education[16.8%], Sonic Automotive[16.56%], Golden Heaven[15.91%], Ardagh Metal[14.9%], Altisource Portfolio[13.33%] Best Consumer Services Stocks Daily:
Strategic Education[16.28%], Boqii Holding[15.69%], Sonic Automotive[10.86%], Altisource Portfolio[10.00%], TAL Education[8.89%], Ardagh Metal[8.82%], MOGU [8.43%], TransUnion [8.17%], Noodles & [8.08%], Chipotle Mexican[6.33%], Soho House[6.30%]