
 Login Sign Up


| |||||
 |  | ||||

| 12Stocks.com Market Intelligence |
Best Consumer Services Stocks
| In a hurry? Services & Goods Stocks: Performance Trends Table, Stock Charts
Sort Consumer Services: Daily, Weekly, Year-to-Date, Market Cap & Trends. Filter Services & Goods stocks list by size: All Large Mid-Range Small |
| 12Stocks.com Consumer Services Stocks Performances & Trends Daily | |||||||||
|
|  The overall Smart Investing & Trading Score is 57 (0-bearish to 100-bullish) which puts Consumer Services sector in short term neutral trend. The Smart Investing & Trading Score from previous trading session is 35 and hence an improvement of trend.
| ||||||||
Here are the Smart Investing & Trading Scores of the most requested Consumer Services stocks at 12Stocks.com (click stock name for detailed review):
|


| Consider signing up for our daily 12Stocks.com "Best Stocks Newsletter". You will never ever miss a big stock move again! |
| 12Stocks.com: Investing in Consumer Services sector with Stocks | |
|
The following table helps investors and traders sort through current performance and trends (as measured by Smart Investing & Trading Score) of various
stocks in the Consumer Services sector. Quick View: Move mouse or cursor over stock symbol (ticker) to view short-term Technical chart and over stock name to view long term chart. Click on  to add stock symbol to your watchlist and to add stock symbol to your watchlist and  to view watchlist. Click on any ticker or stock name for detailed market intelligence report for that stock. to view watchlist. Click on any ticker or stock name for detailed market intelligence report for that stock. |
12Stocks.com Performance of Stocks in Consumer Services Sector
| Ticker | Stock Name | Watchlist | Category | Recent Price | Smart Investing & Trading Score | Change % | YTD Change% |
| CARG | CarGurus |   | Automobile | 22.75 | 73 | -0.70% | -5.84% |
| CPRT | Copart | | Automobile | 55.20 | 73 | 1.47% | 12.65% |
| GPI | 1 | | Automobile | 295.04 | 73 | 0.86% | -3.18% |
| MYTE | MYT Netherlands | | Luxury Goods | 4.00 | 71 | -2.91% | 24.22% |
| YSG | Yatsen Holding | | Specialty Retail | 4.34 | 71 | 3.09% | 493.22% |
| DIS | Walt Disney | | Entertainment | 113.66 | 71 | 0.92% | 25.88% |
| CNK | Cinemark | | Entertainment | 17.72 | 71 | 0.74% | 25.76% |
| WMT | Walmart | | Retail | 59.82 | 71 | 0.18% | 13.83% |
| MCO | Moody s | | Services | 380.56 | 70 | 1.11% | -2.56% |
| BOOT | Boot Barn | | Apparel | 105.30 | 70 | 1.08% | 37.18% |
| LQDT | Liquidity Services | | Retail | 17.95 | 70 | 1.13% | 4.30% |
| RIVN | Rivian Automotive | | Auto Manufacturers | 10.08 | 69 | 6.78% | -56.98% |
| BFAM | Bright Horizons | | Services | 111.23 | 69 | 6.67% | 18.03% |
| BJRI | BJ s | | Restaurants | 34.68 | 69 | 5.86% | -3.69% |
| RBLX | Roblox | | Electronic Gaming & Multimedia | 39.24 | 69 | 5.44% | -14.96% |
| MCW | Mister Car | | Services | 7.33 | 69 | 4.57% | -14.97% |
| JMIA | Jumia Technologies | | Retail | 5.06 | 69 | 3.27% | 43.34% |
| SIX | Six Flags | | Entertainment | 24.72 | 69 | 3.04% | -1.44% |
| AMCX | AMC Networks | | Entertainment | 11.85 | 69 | 2.69% | -36.93% |
| COST | Costco Wholesale | | Retail | 743.90 | 69 | 1.56% | 12.70% |
| JWN | Nordstrom | | Apparel | 20.10 | 69 | 0.60% | 8.94% |
| BIG | Big Lots | | Retail | 3.59 | 69 | -0.55% | -53.92% |
| ACTG | Acacia Research | | Services | 5.02 | 68 | 2.24% | 28.06% |
| LTH | Life Time | | Leisure | 14.09 | 68 | 0.93% | -7.03% |
| MANU | Manchester United | | Sporting | 15.49 | 68 | -2.02% | -23.99% |
| For chart view version of above stock list: Chart View ➞ 0 - 25 , 25 - 50 , 50 - 75 , 75 - 100 , 100 - 125 , 125 - 150 , 150 - 175 , 175 - 200 , 200 - 225 , 225 - 250 , 250 - 275 , 275 - 300 , 300 - 325 , 325 - 350 , 350 - 375 , 375 - 400 , 400 - 425 , 425 - 450 , 450 - 475 | ||
 | Click To Change The Sort Order: By Market Cap or Company Size Performance: Year-to-date, Week and Day |  |
|
Get the most comprehensive stock market coverage daily at 12Stocks.com ➞ Best Stocks Today ➞ Best Stocks Weekly ➞ Best Stocks Year-to-Date ➞ Best Stocks Trends ➞  Best Stocks Today 12Stocks.com Best Nasdaq Stocks ➞ Best S&P 500 Stocks ➞ Best Tech Stocks ➞ Best Biotech Stocks ➞ |
| Detailed Overview of Consumer Services Stocks |
| Consumer Services Technical Overview, Leaders & Laggards, Top Consumer Services ETF Funds & Detailed Consumer Services Stocks List, Charts, Trends & More |
| Consumer Services Sector: Technical Analysis, Trends & YTD Performance | |
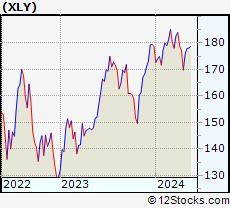
| Consumer Services sector is composed of stocks
from retail, entertainment, media/publishing, consumer goods
and services subsectors. Consumer Services sector, as represented by XLY, an exchange-traded fund [ETF] that holds basket of Consumer Services stocks (e.g, Walmart, Alibaba) is down by -0.5% and is currently underperforming the overall market by -7.38% year-to-date. Below is a quick view of Technical charts and trends: |
|
 XLY Weekly Chart |
|
| Long Term Trend: Not Good | |
| Medium Term Trend: Very Good | |
 XLY Daily Chart |
|
| Short Term Trend: Very Good | |
| Overall Trend Score: 57 | |
| YTD Performance: -0.5% | |
| **Trend Scores & Views Are Only For Educational Purposes And Not For Investing | |
| 12Stocks.com: Top Performing Consumer Services Sector Stocks | ||||||||||||||||||||||||||||||||||||||||||||||||
 The top performing Consumer Services sector stocks year to date are
Now, more recently, over last week, the top performing Consumer Services sector stocks on the move are


|
||||||||||||||||||||||||||||||||||||||||||||||||
| 12Stocks.com: Investing in Consumer Services Sector using Exchange Traded Funds | |
|
The following table shows list of key exchange traded funds (ETF) that
help investors track Consumer Services Index. For detailed view, check out our ETF Funds section of our website. Quick View: Move mouse or cursor over ETF symbol (ticker) to view short-term Technical chart and over ETF name to view long term chart. Click on ticker or stock name for detailed view. Click on to add stock symbol to your watchlist and to view watchlist. |
12Stocks.com List of ETFs that track Consumer Services Index
| Ticker | ETF Name | Watchlist | Recent Price | Smart Investing & Trading Score | Change % | Week % | Year-to-date % |
| XLY | Consumer Discret Sel | | 177.91 | 57 | 0.67 | 1.14 | -0.5% |
| RTH | Retail | | 200.52 | 40 | 0.87 | -0.28 | 6.53% |
| IYC | Consumer Services | | 79.09 | 57 | 0.84 | 0.93 | 4.38% |
| XRT | Retail | | 73.42 | 54 | 1.28 | 0.27 | 1.52% |
| IYK | Consumer Goods | | 66.59 | 64 | 0.20 | -0.25 | 4.2% |
| UCC | Consumer Services | | 34.07 | 54 | 0.31 | -0.27 | -5.13% |
| RETL | Retail Bull 3X | | 8.83 | 52 | 3.52 | 0 | -3.18% |
| RXI | Globl Consumer Discretionary | | 163.11 | 64 | 1.02 | 1.2 | 2.55% |
| SCC | Short Consumer Services | | 15.39 | 36 | -1.63 | -2.5 | 0.4% |
| UGE | Consumer Goods | | 17.27 | 90 | 0.64 | 0.58 | 9.71% |
| 12Stocks.com: Charts, Trends, Fundamental Data and Performances of Consumer Services Stocks | |
|
We now take in-depth look at all Consumer Services stocks including charts, multi-period performances and overall trends (as measured by Smart Investing & Trading Score). One can sort Consumer Services stocks (click link to choose) by Daily, Weekly and by Year-to-Date performances. Also, one can sort by size of the company or by market capitalization. |
| Select Your Default Chart Type: | |||||
| |||||
| Click on stock symbol or name for detailed view. Click on to add stock symbol to your watchlist and to view watchlist. Quick View: Move mouse or cursor over "Daily" to quickly view daily Technical stock chart and over "Weekly" to view weekly Technical stock chart. | |||||

 | CARG CarGurus, Inc. |
| Sector: Services & Goods | |
| SubSector: Auto Dealerships | |
| MarketCap: 2099.31 Millions | |
| Recent Price: 22.75 Smart Investing & Trading Score: 73 | |
| Day Percent Change: -0.70% Day Change: -0.16 | |
| Week Change: -2.02% Year-to-date Change: -5.8% | |
| CARG Links: Profile News Message Board | |
| Charts:- Daily , Weekly | |
| Add CARG to Watchlist: View: Get Complete CARG Trend Analysis ➞ | |
 | CPRT Copart, Inc. |
| Sector: Services & Goods | |
| SubSector: Auto Dealerships | |
| MarketCap: 15462.1 Millions | |
| Recent Price: 55.20 Smart Investing & Trading Score: 73 | |
| Day Percent Change: 1.47% Day Change: 0.80 | |
| Week Change: -0.95% Year-to-date Change: 12.7% | |
| CPRT Links: Profile News Message Board | |
| Charts:- Daily , Weekly | |
| Add CPRT to Watchlist: View: Get Complete CPRT Trend Analysis ➞ | |
 | GPI Group 1 Automotive, Inc. |
| Sector: Services & Goods | |
| SubSector: Auto Dealerships | |
| MarketCap: 921.021 Millions | |
| Recent Price: 295.04 Smart Investing & Trading Score: 73 | |
| Day Percent Change: 0.86% Day Change: 2.51 | |
| Week Change: -1.77% Year-to-date Change: -3.2% | |
| GPI Links: Profile News Message Board | |
| Charts:- Daily , Weekly | |
| Add GPI to Watchlist: View: Get Complete GPI Trend Analysis ➞ | |
 | MYTE MYT Netherlands Parent B.V. |
| Sector: Services & Goods | |
| SubSector: Luxury Goods | |
| MarketCap: 330 Millions | |
| Recent Price: 4.00 Smart Investing & Trading Score: 71 | |
| Day Percent Change: -2.91% Day Change: -0.12 | |
| Week Change: -3.38% Year-to-date Change: 24.2% | |
| MYTE Links: Profile News Message Board | |
| Charts:- Daily , Weekly | |
| Add MYTE to Watchlist: View: Get Complete MYTE Trend Analysis ➞ | |
 | YSG Yatsen Holding Limited |
| Sector: Services & Goods | |
| SubSector: Specialty Retail | |
| MarketCap: 11827 Millions | |
| Recent Price: 4.34 Smart Investing & Trading Score: 71 | |
| Day Percent Change: 3.09% Day Change: 0.13 | |
| Week Change: -10.33% Year-to-date Change: 493.2% | |
| YSG Links: Profile News Message Board | |
| Charts:- Daily , Weekly | |
| Add YSG to Watchlist: View: Get Complete YSG Trend Analysis ➞ | |
 | DIS The Walt Disney Company |
| Sector: Services & Goods | |
| SubSector: Entertainment - Diversified | |
| MarketCap: 178396 Millions | |
| Recent Price: 113.66 Smart Investing & Trading Score: 71 | |
| Day Percent Change: 0.92% Day Change: 1.04 | |
| Week Change: 0.82% Year-to-date Change: 25.9% | |
| DIS Links: Profile News Message Board | |
| Charts:- Daily , Weekly | |
| Add DIS to Watchlist: View: Get Complete DIS Trend Analysis ➞ | |
 | CNK Cinemark Holdings, Inc. |
| Sector: Services & Goods | |
| SubSector: Movie Production, Theaters | |
| MarketCap: 1776.29 Millions | |
| Recent Price: 17.72 Smart Investing & Trading Score: 71 | |
| Day Percent Change: 0.74% Day Change: 0.13 | |
| Week Change: 0.4% Year-to-date Change: 25.8% | |
| CNK Links: Profile News Message Board | |
| Charts:- Daily , Weekly | |
| Add CNK to Watchlist: View: Get Complete CNK Trend Analysis ➞ | |
 | WMT Walmart Inc. |
| Sector: Services & Goods | |
| SubSector: Discount, Variety Stores | |
| MarketCap: 355610 Millions | |
| Recent Price: 59.82 Smart Investing & Trading Score: 71 | |
| Day Percent Change: 0.18% Day Change: 0.11 | |
| Week Change: -0.57% Year-to-date Change: 13.8% | |
| WMT Links: Profile News Message Board | |
| Charts:- Daily , Weekly | |
| Add WMT to Watchlist: View: Get Complete WMT Trend Analysis ➞ | |
 | MCO Moody s Corporation |
| Sector: Services & Goods | |
| SubSector: Business Services | |
| MarketCap: 35998.5 Millions | |
| Recent Price: 380.56 Smart Investing & Trading Score: 70 | |
| Day Percent Change: 1.11% Day Change: 4.16 | |
| Week Change: 1.18% Year-to-date Change: -2.6% | |
| MCO Links: Profile News Message Board | |
| Charts:- Daily , Weekly | |
| Add MCO to Watchlist: View: Get Complete MCO Trend Analysis ➞ | |
 | BOOT Boot Barn Holdings, Inc. |
| Sector: Services & Goods | |
| SubSector: Apparel Stores | |
| MarketCap: 360.608 Millions | |
| Recent Price: 105.30 Smart Investing & Trading Score: 70 | |
| Day Percent Change: 1.08% Day Change: 1.12 | |
| Week Change: -2.31% Year-to-date Change: 37.2% | |
| BOOT Links: Profile News Message Board | |
| Charts:- Daily , Weekly | |
| Add BOOT to Watchlist: View: Get Complete BOOT Trend Analysis ➞ | |
 | LQDT Liquidity Services, Inc. |
| Sector: Services & Goods | |
| SubSector: Catalog & Mail Order Houses | |
| MarketCap: 144.492 Millions | |
| Recent Price: 17.95 Smart Investing & Trading Score: 70 | |
| Day Percent Change: 1.13% Day Change: 0.20 | |
| Week Change: 3.04% Year-to-date Change: 4.3% | |
| LQDT Links: Profile News Message Board | |
| Charts:- Daily , Weekly | |
| Add LQDT to Watchlist: View: Get Complete LQDT Trend Analysis ➞ | |
 | RIVN Rivian Automotive, Inc. |
| Sector: Services & Goods | |
| SubSector: Auto Manufacturers | |
| MarketCap: 14310 Millions | |
| Recent Price: 10.08 Smart Investing & Trading Score: 69 | |
| Day Percent Change: 6.78% Day Change: 0.64 | |
| Week Change: 11.57% Year-to-date Change: -57.0% | |
| RIVN Links: Profile News Message Board | |
| Charts:- Daily , Weekly | |
| Add RIVN to Watchlist: View: Get Complete RIVN Trend Analysis ➞ | |
 | BFAM Bright Horizons Family Solutions Inc. |
| Sector: Services & Goods | |
| SubSector: Personal Services | |
| MarketCap: 5487.65 Millions | |
| Recent Price: 111.23 Smart Investing & Trading Score: 69 | |
| Day Percent Change: 6.67% Day Change: 6.96 | |
| Week Change: 4.27% Year-to-date Change: 18.0% | |
| BFAM Links: Profile News Message Board | |
| Charts:- Daily , Weekly | |
| Add BFAM to Watchlist: View: Get Complete BFAM Trend Analysis ➞ | |
 | BJRI BJ s Restaurants, Inc. |
| Sector: Services & Goods | |
| SubSector: Restaurants | |
| MarketCap: 183.67 Millions | |
| Recent Price: 34.68 Smart Investing & Trading Score: 69 | |
| Day Percent Change: 5.86% Day Change: 1.92 | |
| Week Change: 3.71% Year-to-date Change: -3.7% | |
| BJRI Links: Profile News Message Board | |
| Charts:- Daily , Weekly | |
| Add BJRI to Watchlist: View: Get Complete BJRI Trend Analysis ➞ | |
 | RBLX Roblox Corporation |
| Sector: Services & Goods | |
| SubSector: Electronic Gaming & Multimedia | |
| MarketCap: 25420 Millions | |
| Recent Price: 39.24 Smart Investing & Trading Score: 69 | |
| Day Percent Change: 5.44% Day Change: 2.02 | |
| Week Change: 8.97% Year-to-date Change: -15.0% | |
| RBLX Links: Profile News Message Board | |
| Charts:- Daily , Weekly | |
| Add RBLX to Watchlist: View: Get Complete RBLX Trend Analysis ➞ | |
 | MCW Mister Car Wash, Inc. |
| Sector: Services & Goods | |
| SubSector: Personal Services | |
| MarketCap: 2790 Millions | |
| Recent Price: 7.33 Smart Investing & Trading Score: 69 | |
| Day Percent Change: 4.57% Day Change: 0.32 | |
| Week Change: 6.31% Year-to-date Change: -15.0% | |
| MCW Links: Profile News Message Board | |
| Charts:- Daily , Weekly | |
| Add MCW to Watchlist: View: Get Complete MCW Trend Analysis ➞ | |
 | JMIA Jumia Technologies AG |
| Sector: Services & Goods | |
| SubSector: Specialty Retail, Other | |
| MarketCap: 203.644 Millions | |
| Recent Price: 5.06 Smart Investing & Trading Score: 69 | |
| Day Percent Change: 3.27% Day Change: 0.16 | |
| Week Change: 11.45% Year-to-date Change: 43.3% | |
| JMIA Links: Profile News Message Board | |
| Charts:- Daily , Weekly | |
| Add JMIA to Watchlist: View: Get Complete JMIA Trend Analysis ➞ | |
 | SIX Six Flags Entertainment Corporation |
| Sector: Services & Goods | |
| SubSector: General Entertainment | |
| MarketCap: 1282.69 Millions | |
| Recent Price: 24.72 Smart Investing & Trading Score: 69 | |
| Day Percent Change: 3.04% Day Change: 0.73 | |
| Week Change: 4.17% Year-to-date Change: -1.4% | |
| SIX Links: Profile News Message Board | |
| Charts:- Daily , Weekly | |
| Add SIX to Watchlist: View: Get Complete SIX Trend Analysis ➞ | |
 | AMCX AMC Networks Inc. |
| Sector: Services & Goods | |
| SubSector: Entertainment - Diversified | |
| MarketCap: 1477.37 Millions | |
| Recent Price: 11.85 Smart Investing & Trading Score: 69 | |
| Day Percent Change: 2.69% Day Change: 0.31 | |
| Week Change: 9.42% Year-to-date Change: -36.9% | |
| AMCX Links: Profile News Message Board | |
| Charts:- Daily , Weekly | |
| Add AMCX to Watchlist: View: Get Complete AMCX Trend Analysis ➞ | |
 | COST Costco Wholesale Corporation |
| Sector: Services & Goods | |
| SubSector: Discount, Variety Stores | |
| MarketCap: 136355 Millions | |
| Recent Price: 743.90 Smart Investing & Trading Score: 69 | |
| Day Percent Change: 1.56% Day Change: 11.46 | |
| Week Change: 2.02% Year-to-date Change: 12.7% | |
| COST Links: Profile News Message Board | |
| Charts:- Daily , Weekly | |
| Add COST to Watchlist: View: Get Complete COST Trend Analysis ➞ | |
 | JWN Nordstrom, Inc. |
| Sector: Services & Goods | |
| SubSector: Apparel Stores | |
| MarketCap: 3351.68 Millions | |
| Recent Price: 20.10 Smart Investing & Trading Score: 69 | |
| Day Percent Change: 0.60% Day Change: 0.12 | |
| Week Change: 5.07% Year-to-date Change: 8.9% | |
| JWN Links: Profile News Message Board | |
| Charts:- Daily , Weekly | |
| Add JWN to Watchlist: View: Get Complete JWN Trend Analysis ➞ | |
 | BIG Big Lots, Inc. |
| Sector: Services & Goods | |
| SubSector: Discount, Variety Stores | |
| MarketCap: 603.572 Millions | |
| Recent Price: 3.59 Smart Investing & Trading Score: 69 | |
| Day Percent Change: -0.55% Day Change: -0.02 | |
| Week Change: 3.46% Year-to-date Change: -53.9% | |
| BIG Links: Profile News Message Board | |
| Charts:- Daily , Weekly | |
| Add BIG to Watchlist: View: Get Complete BIG Trend Analysis ➞ | |
 | ACTG Acacia Research Corporation |
| Sector: Services & Goods | |
| SubSector: Business Services | |
| MarketCap: 112.782 Millions | |
| Recent Price: 5.02 Smart Investing & Trading Score: 68 | |
| Day Percent Change: 2.24% Day Change: 0.11 | |
| Week Change: 3.08% Year-to-date Change: 28.1% | |
| ACTG Links: Profile News Message Board | |
| Charts:- Daily , Weekly | |
| Add ACTG to Watchlist: View: Get Complete ACTG Trend Analysis ➞ | |
 | LTH Life Time Group Holdings, Inc. |
| Sector: Services & Goods | |
| SubSector: Leisure | |
| MarketCap: 3740 Millions | |
| Recent Price: 14.09 Smart Investing & Trading Score: 68 | |
| Day Percent Change: 0.93% Day Change: 0.13 | |
| Week Change: -0.46% Year-to-date Change: -7.0% | |
| LTH Links: Profile News Message Board | |
| Charts:- Daily , Weekly | |
| Add LTH to Watchlist: View: Get Complete LTH Trend Analysis ➞ | |
 | MANU Manchester United plc |
| Sector: Services & Goods | |
| SubSector: Sporting Activities | |
| MarketCap: 2537.74 Millions | |
| Recent Price: 15.49 Smart Investing & Trading Score: 68 | |
| Day Percent Change: -2.02% Day Change: -0.32 | |
| Week Change: -3.61% Year-to-date Change: -24.0% | |
| MANU Links: Profile News Message Board | |
| Charts:- Daily , Weekly | |
| Add MANU to Watchlist: View: Get Complete MANU Trend Analysis ➞ | |
| For tabular summary view of above stock list: Summary View ➞ 0 - 25 , 25 - 50 , 50 - 75 , 75 - 100 , 100 - 125 , 125 - 150 , 150 - 175 , 175 - 200 , 200 - 225 , 225 - 250 , 250 - 275 , 275 - 300 , 300 - 325 , 325 - 350 , 350 - 375 , 375 - 400 , 400 - 425 , 425 - 450 , 450 - 475 | ||
| Click To Change The Sort Order: By Market Cap or Company Size Performance: Year-to-date, Week and Day | |
| Select Chart Type: | ||
|
Best Stocks Today 12Stocks.com |
© 2024 12Stocks.com Terms & Conditions Privacy Contact Us
All Information Provided Only For Education And Not To Be Used For Investing or Trading. See Terms & Conditions


One More Thing ... Get Best Stocks Delivered Daily!
Never Ever Miss A Move With Our Top Ten Stocks Lists
Find Best Stocks In Any Market - Bull or Bear Market
Take A Peek At Our Top Ten Stocks Lists: Daily, Weekly, Year-to-Date & Top Trends
Find Best Stocks In Any Market - Bull or Bear Market
Take A Peek At Our Top Ten Stocks Lists: Daily, Weekly, Year-to-Date & Top Trends
Consumer Services Stocks With Best Up Trends [0-bearish to 100-bullish]: GameStop [100], El Pollo[100], Adtalem Global[100], Chicken Soup[100], Willdan [100], SunCar Technology[100], Frontier [100], Verra Mobility[100], Mondee [100], Laureate Education[100], Hesai [100]
Best Consumer Services Stocks Year-to-Date:
U Power[3264.96%], Vroom [2061.45%], Yatsen Holding[493.22%], Fluent [422.39%], Research[141.9%], Codere Online[131.85%], Carvana Co[129.83%], Sweetgreen [95.58%], RealReal [94.03%], Smart Share[68.93%], PaySign [68.93%] Best Consumer Services Stocks This Week:
Chicken Soup[192.17%], Carvana Co[44.31%], Smart Share[40.05%], GameStop [38.4%], Perdoceo Education[29.06%], CareDx [28.57%], Gannett Co[22.87%], Wayfair [22.26%], Adtalem Global[20.93%], Sunnova Energy[19.75%], WW [19.43%] Best Consumer Services Stocks Daily:
GameStop [29.08%], El Pollo[16.40%], Team [15.14%], Adtalem Global[14.66%], Chicken Soup[13.51%], WW [10.58%], Willdan [9.87%], U Power[9.44%], SunCar Technology[9.43%], Frontier [8.66%], Wayfair [8.44%]