
 Login Sign Up


| |||||
 |  | ||||

| 12Stocks.com Market Intelligence |
Best Consumer Services Stocks
| In a hurry? Services & Goods Stocks: Performance Trends Table, Stock Charts
Sort Consumer Services: Daily, Weekly, Year-to-Date, Market Cap & Trends. Filter Services & Goods stocks list by size: All Large Mid-Range Small |
| 12Stocks.com Consumer Services Stocks Performances & Trends Daily | |||||||||
|
|  The overall Smart Investing & Trading Score is 35 (0-bearish to 100-bullish) which puts Consumer Services sector in short term bearish to neutral trend. The Smart Investing & Trading Score from previous trading session is 7 and hence an improvement of trend.
| ||||||||
Here are the Smart Investing & Trading Scores of the most requested Consumer Services stocks at 12Stocks.com (click stock name for detailed review):
|


| Consider signing up for our daily 12Stocks.com "Best Stocks Newsletter". You will never ever miss a big stock move again! |
| 12Stocks.com: Investing in Consumer Services sector with Stocks | |
|
The following table helps investors and traders sort through current performance and trends (as measured by Smart Investing & Trading Score) of various
stocks in the Consumer Services sector. Quick View: Move mouse or cursor over stock symbol (ticker) to view short-term Technical chart and over stock name to view long term chart. Click on  to add stock symbol to your watchlist and to add stock symbol to your watchlist and  to view watchlist. Click on any ticker or stock name for detailed market intelligence report for that stock. to view watchlist. Click on any ticker or stock name for detailed market intelligence report for that stock. |
12Stocks.com Performance of Stocks in Consumer Services Sector
| Ticker | Stock Name | Watchlist | Category | Recent Price | Smart Investing & Trading Score | Change % | YTD Change% |
| EM | Smart Share |   | Services | 0.87 | 100 | 8.63% | 68.74% |
| TRI | Thomson Reuters | | Publishing | 162.96 | 100 | 7.58% | 11.45% |
| GTN | Gray Television | | Broadcasting | 6.44 | 100 | 7.33% | -28.13% |
| WCC | WESCO | | Equipment | 165.08 | 100 | 6.92% | -5.06% |
| BABA | Alibaba | | Retail | 80.33 | 100 | 6.38% | 3.64% |
| TTEK | Tetra Tech | | Services | 204.35 | 100 | 6.16% | 22.42% |
| HSAI | Hesai | | Auto Parts | 4.90 | 100 | 4.93% | -46.04% |
| OB | Outbrain | | Internet Content & Information | 4.42 | 100 | 4.49% | 0.91% |
| PRDO | Perdoceo Education | | Education | 24.17 | 100 | 31.79% | 37.64% |
| OSW | OneSpaWorld | | Casinos | 14.85 | 100 | 3.85% | 5.32% |
| GCI | Gannett Co | | Publishing | 3.06 | 100 | 26.97% | 33.04% |
| PGRU | PropertyGuru | | Internet Content & Information | 3.95 | 100 | 2.86% | 17.73% |
| RERE | ATRenew | | Internet Retail | 2.12 | 100 | 2.17% | 11.90% |
| SFM | Sprouts Farmers | | Grocery | 71.98 | 100 | 11.96% | 49.62% |
| SGHC | Super | | Gambling | 3.31 | 100 | 1.53% | 3.60% |
| WEN | Wendy s | | Restaurants | 19.91 | 100 | 1.48% | 2.21% |
| GHG | GreenTree Hospitality | | Lodging | 3.06 | 100 | -4.38% | -18.62% |
| EAT | Brinker | | Restaurants | 54.34 | 100 | -1.11% | 25.85% |
| DLX | Deluxe | | Services | 21.57 | 95 | 8.45% | 0.56% |
| BZUN | Baozun | | Retail | 2.87 | 95 | 6.30% | 4.74% |
| APEI | American Public | | Education | 14.39 | 95 | 4.12% | 49.12% |
| SHAK | Shake Shack | | Restaurants | 104.94 | 95 | 1.56% | 41.58% |
| SGA | Saga | | Broadcasting | 23.43 | 95 | 0.71% | 5.28% |
| ABM | ABM Industries | | Services | 44.84 | 95 | 0.09% | 0.02% |
| REAL | RealReal | | Retail | 3.76 | 95 | -3.84% | 87.06% |
| For chart view version of above stock list: Chart View ➞ 0 - 25 , 25 - 50 , 50 - 75 , 75 - 100 , 100 - 125 , 125 - 150 , 150 - 175 , 175 - 200 , 200 - 225 , 225 - 250 , 250 - 275 , 275 - 300 , 300 - 325 , 325 - 350 , 350 - 375 , 375 - 400 , 400 - 425 , 425 - 450 , 450 - 475 | ||
 | Click To Change The Sort Order: By Market Cap or Company Size Performance: Year-to-date, Week and Day |  |
|
Get the most comprehensive stock market coverage daily at 12Stocks.com ➞ Best Stocks Today ➞ Best Stocks Weekly ➞ Best Stocks Year-to-Date ➞ Best Stocks Trends ➞  Best Stocks Today 12Stocks.com Best Nasdaq Stocks ➞ Best S&P 500 Stocks ➞ Best Tech Stocks ➞ Best Biotech Stocks ➞ |
| Detailed Overview of Consumer Services Stocks |
| Consumer Services Technical Overview, Leaders & Laggards, Top Consumer Services ETF Funds & Detailed Consumer Services Stocks List, Charts, Trends & More |
| Consumer Services Sector: Technical Analysis, Trends & YTD Performance | |
| Consumer Services sector is composed of stocks
from retail, entertainment, media/publishing, consumer goods
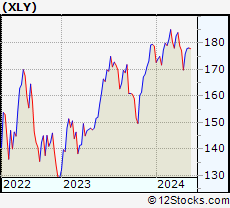
and services subsectors. Consumer Services sector, as represented by XLY, an exchange-traded fund [ETF] that holds basket of Consumer Services stocks (e.g, Walmart, Alibaba) is down by -1.17% and is currently underperforming the overall market by -6.79% year-to-date. Below is a quick view of Technical charts and trends: |
|
 XLY Weekly Chart |
|
| Long Term Trend: Not Good | |
| Medium Term Trend: Deteriorating | |
 XLY Daily Chart |
|
| Short Term Trend: Deteriorating | |
| Overall Trend Score: 35 | |
| YTD Performance: -1.17% | |
| **Trend Scores & Views Are Only For Educational Purposes And Not For Investing | |
| 12Stocks.com: Top Performing Consumer Services Sector Stocks | ||||||||||||||||||||||||||||||||||||||||||||||||
 The top performing Consumer Services sector stocks year to date are
Now, more recently, over last week, the top performing Consumer Services sector stocks on the move are


|
||||||||||||||||||||||||||||||||||||||||||||||||
| 12Stocks.com: Investing in Consumer Services Sector using Exchange Traded Funds | |
|
The following table shows list of key exchange traded funds (ETF) that
help investors track Consumer Services Index. For detailed view, check out our ETF Funds section of our website. Quick View: Move mouse or cursor over ETF symbol (ticker) to view short-term Technical chart and over ETF name to view long term chart. Click on ticker or stock name for detailed view. Click on to add stock symbol to your watchlist and to view watchlist. |
12Stocks.com List of ETFs that track Consumer Services Index
| Ticker | ETF Name | Watchlist | Recent Price | Smart Investing & Trading Score | Change % | Week % | Year-to-date % |
| XLY | Consumer Discret Sel | | 176.72 | 35 | 1.26 | 0.46 | -1.17% |
| RTH | Retail | | 199.00 | 0 | 1.49 | -1.03 | 5.72% |
| IYC | Consumer Services | | 78.35 | 7 | 1.28 | -0.01 | 3.41% |
| XRT | Retail | | 72.49 | 25 | 1.70 | -1 | 0.24% |
| IYK | Consumer Goods | | 66.46 | 63 | 0.51 | -0.45 | 4% |
| UCC | Consumer Services | | 33.96 | 42 | 1.98 | -0.59 | -5.42% |
| RETL | Retail Bull 3X | | 8.53 | 5 | 5.44 | -3.4 | -6.47% |
| RXI | Globl Consumer Discretionary | | 161.47 | 27 | 1.46 | 0.18 | 1.52% |
| SCC | Short Consumer Services | | 15.66 | 88 | -1.97 | -0.73 | 2.23% |
| UGE | Consumer Goods | | 16.92 | 73 | 0.39 | -1.46 | 7.49% |
| 12Stocks.com: Charts, Trends, Fundamental Data and Performances of Consumer Services Stocks | |
|
We now take in-depth look at all Consumer Services stocks including charts, multi-period performances and overall trends (as measured by Smart Investing & Trading Score). One can sort Consumer Services stocks (click link to choose) by Daily, Weekly and by Year-to-Date performances. Also, one can sort by size of the company or by market capitalization. |
| Select Your Default Chart Type: | |||||
| |||||
| Click on stock symbol or name for detailed view. Click on to add stock symbol to your watchlist and to view watchlist. Quick View: Move mouse or cursor over "Daily" to quickly view daily Technical stock chart and over "Weekly" to view weekly Technical stock chart. | |||||

 | EM Smart Share Global Limited |
| Sector: Services & Goods | |
| SubSector: Personal Services | |
| MarketCap: 238 Millions | |
| Recent Price: 0.87 Smart Investing & Trading Score: 100 | |
| Day Percent Change: 8.63% Day Change: 0.07 | |
| Week Change: 39.89% Year-to-date Change: 68.7% | |
| EM Links: Profile News Message Board | |
| Charts:- Daily , Weekly | |
| Add EM to Watchlist: View: Get Complete EM Trend Analysis ➞ | |
 | TRI Thomson Reuters Corporation |
| Sector: Services & Goods | |
| SubSector: Publishing - Periodicals | |
| MarketCap: 30959.4 Millions | |
| Recent Price: 162.96 Smart Investing & Trading Score: 100 | |
| Day Percent Change: 7.58% Day Change: 11.48 | |
| Week Change: 5.54% Year-to-date Change: 11.5% | |
| TRI Links: Profile News Message Board | |
| Charts:- Daily , Weekly | |
| Add TRI to Watchlist: View: Get Complete TRI Trend Analysis ➞ | |
 | GTN Gray Television, Inc. |
| Sector: Services & Goods | |
| SubSector: Broadcasting - TV | |
| MarketCap: 1144.63 Millions | |
| Recent Price: 6.44 Smart Investing & Trading Score: 100 | |
| Day Percent Change: 7.33% Day Change: 0.44 | |
| Week Change: 14.8% Year-to-date Change: -28.1% | |
| GTN Links: Profile News Message Board | |
| Charts:- Daily , Weekly | |
| Add GTN to Watchlist: View: Get Complete GTN Trend Analysis ➞ | |
 | WCC WESCO International, Inc. |
| Sector: Services & Goods | |
| SubSector: Industrial Equipment Wholesale | |
| MarketCap: 824.358 Millions | |
| Recent Price: 165.08 Smart Investing & Trading Score: 100 | |
| Day Percent Change: 6.92% Day Change: 10.68 | |
| Week Change: 5.96% Year-to-date Change: -5.1% | |
| WCC Links: Profile News Message Board | |
| Charts:- Daily , Weekly | |
| Add WCC to Watchlist: View: Get Complete WCC Trend Analysis ➞ | |
 | BABA Alibaba Group Holding Limited |
| Sector: Services & Goods | |
| SubSector: Specialty Retail, Other | |
| MarketCap: 522666 Millions | |
| Recent Price: 80.33 Smart Investing & Trading Score: 100 | |
| Day Percent Change: 6.38% Day Change: 4.82 | |
| Week Change: 6.33% Year-to-date Change: 3.6% | |
| BABA Links: Profile News Message Board | |
| Charts:- Daily , Weekly | |
| Add BABA to Watchlist: View: Get Complete BABA Trend Analysis ➞ | |
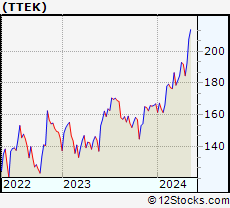 | TTEK Tetra Tech, Inc. |
| Sector: Services & Goods | |
| SubSector: Technical Services | |
| MarketCap: 3985.5 Millions | |
| Recent Price: 204.35 Smart Investing & Trading Score: 100 | |
| Day Percent Change: 6.16% Day Change: 11.86 | |
| Week Change: 6.16% Year-to-date Change: 22.4% | |
| TTEK Links: Profile News Message Board | |
| Charts:- Daily , Weekly | |
| Add TTEK to Watchlist: View: Get Complete TTEK Trend Analysis ➞ | |
 | HSAI Hesai Group |
| Sector: Services & Goods | |
| SubSector: Auto Parts | |
| MarketCap: 1330 Millions | |
| Recent Price: 4.90 Smart Investing & Trading Score: 100 | |
| Day Percent Change: 4.93% Day Change: 0.23 | |
| Week Change: 11.36% Year-to-date Change: -46.0% | |
| HSAI Links: Profile News Message Board | |
| Charts:- Daily , Weekly | |
| Add HSAI to Watchlist: View: Get Complete HSAI Trend Analysis ➞ | |
 | OB Outbrain Inc. |
| Sector: Services & Goods | |
| SubSector: Internet Content & Information | |
| MarketCap: 250 Millions | |
| Recent Price: 4.42 Smart Investing & Trading Score: 100 | |
| Day Percent Change: 4.49% Day Change: 0.19 | |
| Week Change: 5.74% Year-to-date Change: 0.9% | |
| OB Links: Profile News Message Board | |
| Charts:- Daily , Weekly | |
| Add OB to Watchlist: View: Get Complete OB Trend Analysis ➞ | |
 | PRDO Perdoceo Education Corporation |
| Sector: Services & Goods | |
| SubSector: Education & Training Services | |
| MarketCap: 631.006 Millions | |
| Recent Price: 24.17 Smart Investing & Trading Score: 100 | |
| Day Percent Change: 31.79% Day Change: 5.83 | |
| Week Change: 28.15% Year-to-date Change: 37.6% | |
| PRDO Links: Profile News Message Board | |
| Charts:- Daily , Weekly | |
| Add PRDO to Watchlist: View: Get Complete PRDO Trend Analysis ➞ | |
 | OSW OneSpaWorld Holdings Limited |
| Sector: Services & Goods | |
| SubSector: Resorts & Casinos | |
| MarketCap: 228.394 Millions | |
| Recent Price: 14.85 Smart Investing & Trading Score: 100 | |
| Day Percent Change: 3.85% Day Change: 0.55 | |
| Week Change: 16.2% Year-to-date Change: 5.3% | |
| OSW Links: Profile News Message Board | |
| Charts:- Daily , Weekly | |
| Add OSW to Watchlist: View: Get Complete OSW Trend Analysis ➞ | |
 | GCI Gannett Co., Inc. |
| Sector: Services & Goods | |
| SubSector: Publishing - Newspapers | |
| MarketCap: 222.322 Millions | |
| Recent Price: 3.06 Smart Investing & Trading Score: 100 | |
| Day Percent Change: 26.97% Day Change: 0.65 | |
| Week Change: 18.6% Year-to-date Change: 33.0% | |
| GCI Links: Profile News Message Board | |
| Charts:- Daily , Weekly | |
| Add GCI to Watchlist: View: Get Complete GCI Trend Analysis ➞ | |
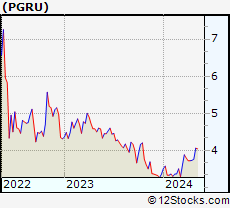 | PGRU PropertyGuru Group Limited |
| Sector: Services & Goods | |
| SubSector: Internet Content & Information | |
| MarketCap: 720 Millions | |
| Recent Price: 3.95 Smart Investing & Trading Score: 100 | |
| Day Percent Change: 2.86% Day Change: 0.11 | |
| Week Change: 5.05% Year-to-date Change: 17.7% | |
| PGRU Links: Profile News Message Board | |
| Charts:- Daily , Weekly | |
| Add PGRU to Watchlist: View: Get Complete PGRU Trend Analysis ➞ | |
 | RERE ATRenew Inc. |
| Sector: Services & Goods | |
| SubSector: Internet Retail | |
| MarketCap: 672 Millions | |
| Recent Price: 2.12 Smart Investing & Trading Score: 100 | |
| Day Percent Change: 2.17% Day Change: 0.05 | |
| Week Change: 6.82% Year-to-date Change: 11.9% | |
| RERE Links: Profile News Message Board | |
| Charts:- Daily , Weekly | |
| Add RERE to Watchlist: View: Get Complete RERE Trend Analysis ➞ | |
 | SFM Sprouts Farmers Market, Inc. |
| Sector: Services & Goods | |
| SubSector: Grocery Stores | |
| MarketCap: 2495.85 Millions | |
| Recent Price: 71.98 Smart Investing & Trading Score: 100 | |
| Day Percent Change: 11.96% Day Change: 7.69 | |
| Week Change: 7.46% Year-to-date Change: 49.6% | |
| SFM Links: Profile News Message Board | |
| Charts:- Daily , Weekly | |
| Add SFM to Watchlist: View: Get Complete SFM Trend Analysis ➞ | |
 | SGHC Super Group (SGHC) Limited |
| Sector: Services & Goods | |
| SubSector: Gambling | |
| MarketCap: 1390 Millions | |
| Recent Price: 3.31 Smart Investing & Trading Score: 100 | |
| Day Percent Change: 1.53% Day Change: 0.05 | |
| Week Change: 9.97% Year-to-date Change: 3.6% | |
| SGHC Links: Profile News Message Board | |
| Charts:- Daily , Weekly | |
| Add SGHC to Watchlist: View: Get Complete SGHC Trend Analysis ➞ | |
 | WEN The Wendy s Company |
| Sector: Services & Goods | |
| SubSector: Restaurants | |
| MarketCap: 2814.9 Millions | |
| Recent Price: 19.91 Smart Investing & Trading Score: 100 | |
| Day Percent Change: 1.48% Day Change: 0.29 | |
| Week Change: -1.14% Year-to-date Change: 2.2% | |
| WEN Links: Profile News Message Board | |
| Charts:- Daily , Weekly | |
| Add WEN to Watchlist: View: Get Complete WEN Trend Analysis ➞ | |
 | GHG GreenTree Hospitality Group Ltd. |
| Sector: Services & Goods | |
| SubSector: Lodging | |
| MarketCap: 1195.36 Millions | |
| Recent Price: 3.06 Smart Investing & Trading Score: 100 | |
| Day Percent Change: -4.38% Day Change: -0.14 | |
| Week Change: -1.29% Year-to-date Change: -18.6% | |
| GHG Links: Profile News Message Board | |
| Charts:- Daily , Weekly | |
| Add GHG to Watchlist: View: Get Complete GHG Trend Analysis ➞ | |
 | EAT Brinker International, Inc. |
| Sector: Services & Goods | |
| SubSector: Restaurants | |
| MarketCap: 435.97 Millions | |
| Recent Price: 54.34 Smart Investing & Trading Score: 100 | |
| Day Percent Change: -1.11% Day Change: -0.61 | |
| Week Change: 11.28% Year-to-date Change: 25.9% | |
| EAT Links: Profile News Message Board | |
| Charts:- Daily , Weekly | |
| Add EAT to Watchlist: View: Get Complete EAT Trend Analysis ➞ | |
 | DLX Deluxe Corporation |
| Sector: Services & Goods | |
| SubSector: Business Services | |
| MarketCap: 1025.82 Millions | |
| Recent Price: 21.57 Smart Investing & Trading Score: 95 | |
| Day Percent Change: 8.45% Day Change: 1.68 | |
| Week Change: 6% Year-to-date Change: 0.6% | |
| DLX Links: Profile News Message Board | |
| Charts:- Daily , Weekly | |
| Add DLX to Watchlist: View: Get Complete DLX Trend Analysis ➞ | |
 | BZUN Baozun Inc. |
| Sector: Services & Goods | |
| SubSector: Catalog & Mail Order Houses | |
| MarketCap: 1668.92 Millions | |
| Recent Price: 2.87 Smart Investing & Trading Score: 95 | |
| Day Percent Change: 6.30% Day Change: 0.17 | |
| Week Change: 4.36% Year-to-date Change: 4.7% | |
| BZUN Links: Profile News Message Board | |
| Charts:- Daily , Weekly | |
| Add BZUN to Watchlist: View: Get Complete BZUN Trend Analysis ➞ | |
 | APEI American Public Education, Inc. |
| Sector: Services & Goods | |
| SubSector: Education & Training Services | |
| MarketCap: 361.306 Millions | |
| Recent Price: 14.39 Smart Investing & Trading Score: 95 | |
| Day Percent Change: 4.12% Day Change: 0.57 | |
| Week Change: 0.7% Year-to-date Change: 49.1% | |
| APEI Links: Profile News Message Board | |
| Charts:- Daily , Weekly | |
| Add APEI to Watchlist: View: Get Complete APEI Trend Analysis ➞ | |
 | SHAK Shake Shack Inc. |
| Sector: Services & Goods | |
| SubSector: Specialty Eateries | |
| MarketCap: 1497.67 Millions | |
| Recent Price: 104.94 Smart Investing & Trading Score: 95 | |
| Day Percent Change: 1.56% Day Change: 1.61 | |
| Week Change: 0.06% Year-to-date Change: 41.6% | |
| SHAK Links: Profile News Message Board | |
| Charts:- Daily , Weekly | |
| Add SHAK to Watchlist: View: Get Complete SHAK Trend Analysis ➞ | |
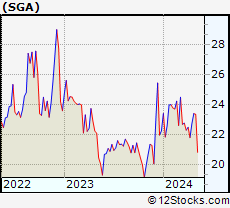 | SGA Saga Communications, Inc. |
| Sector: Services & Goods | |
| SubSector: Broadcasting - Radio | |
| MarketCap: 158.295 Millions | |
| Recent Price: 23.43 Smart Investing & Trading Score: 95 | |
| Day Percent Change: 0.71% Day Change: 0.16 | |
| Week Change: 0.11% Year-to-date Change: 5.3% | |
| SGA Links: Profile News Message Board | |
| Charts:- Daily , Weekly | |
| Add SGA to Watchlist: View: Get Complete SGA Trend Analysis ➞ | |
 | ABM ABM Industries Incorporated |
| Sector: Services & Goods | |
| SubSector: Business Services | |
| MarketCap: 1706.72 Millions | |
| Recent Price: 44.84 Smart Investing & Trading Score: 95 | |
| Day Percent Change: 0.09% Day Change: 0.04 | |
| Week Change: 1.82% Year-to-date Change: 0.0% | |
| ABM Links: Profile News Message Board | |
| Charts:- Daily , Weekly | |
| Add ABM to Watchlist: View: Get Complete ABM Trend Analysis ➞ | |
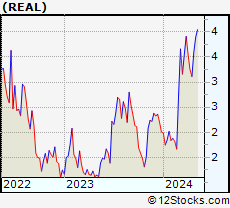 | REAL The RealReal, Inc. |
| Sector: Services & Goods | |
| SubSector: Specialty Retail, Other | |
| MarketCap: 839.344 Millions | |
| Recent Price: 3.76 Smart Investing & Trading Score: 95 | |
| Day Percent Change: -3.84% Day Change: -0.15 | |
| Week Change: 4.74% Year-to-date Change: 87.1% | |
| REAL Links: Profile News Message Board | |
| Charts:- Daily , Weekly | |
| Add REAL to Watchlist: View: Get Complete REAL Trend Analysis ➞ | |
| For tabular summary view of above stock list: Summary View ➞ 0 - 25 , 25 - 50 , 50 - 75 , 75 - 100 , 100 - 125 , 125 - 150 , 150 - 175 , 175 - 200 , 200 - 225 , 225 - 250 , 250 - 275 , 275 - 300 , 300 - 325 , 325 - 350 , 350 - 375 , 375 - 400 , 400 - 425 , 425 - 450 , 450 - 475 | ||
| Click To Change The Sort Order: By Market Cap or Company Size Performance: Year-to-date, Week and Day | |
| Select Chart Type: | ||
|
Best Stocks Today 12Stocks.com |
© 2024 12Stocks.com Terms & Conditions Privacy Contact Us
All Information Provided Only For Education And Not To Be Used For Investing or Trading. See Terms & Conditions


One More Thing ... Get Best Stocks Delivered Daily!
Never Ever Miss A Move With Our Top Ten Stocks Lists
Find Best Stocks In Any Market - Bull or Bear Market
Take A Peek At Our Top Ten Stocks Lists: Daily, Weekly, Year-to-Date & Top Trends
Find Best Stocks In Any Market - Bull or Bear Market
Take A Peek At Our Top Ten Stocks Lists: Daily, Weekly, Year-to-Date & Top Trends
Consumer Services Stocks With Best Up Trends [0-bearish to 100-bullish]: Perdoceo Education[100], Gannett Co[100], Sprouts Farmers[100], Smart Share[100], Thomson Reuters[100], Gray Television[100], WESCO [100], Alibaba [100], Tetra Tech[100], Hesai [100], Outbrain [100]
Best Consumer Services Stocks Year-to-Date:
U Power[2974.78%], Vroom [1965.31%], Yatsen Holding[475.45%], Fluent [397.76%], Research[136.47%], Codere Online[132.88%], Carvana Co[120.06%], Sweetgreen [88.85%], RealReal [87.06%], Smart Share[68.74%], PaySign [65.36%] Best Consumer Services Stocks This Week:
Chicken Soup[156.52%], Smart Share[39.89%], Carvana Co[38.18%], Perdoceo Education[28.15%], Olaplex [24.63%], CareDx [22.75%], Polestar Automotive[21.61%], XPeng [19.9%], Gannett Co[18.6%], OneSpaWorld [16.2%], Li Auto[15.79%] Best Consumer Services Stocks Daily:
Carvana Co[33.77%], Perdoceo Education[31.79%], Gannett Co[26.97%], Sunnova Energy[25.21%], Chicken Soup[20.41%], Olaplex [19.29%], GameStop [16.96%], Wayfair [16.05%], XPeng [15.76%], Children s[14.58%], OneWater Marine[14.09%]