
 Login Sign Up


| |||||
 |  | ||||

| 12Stocks.com Market Intelligence |
Best Consumer Services Stocks
| In a hurry? Services & Goods Stocks: Performance Trends Table, Stock Charts
Sort Consumer Services: Daily, Weekly, Year-to-Date, Market Cap & Trends. Filter Services & Goods stocks list by size: All Large Mid-Range Small |
| 12Stocks.com Consumer Services Stocks Performances & Trends Daily | |||||||||
|
|  The overall Smart Investing & Trading Score is 7 (0-bearish to 100-bullish) which puts Consumer Services sector in short term bearish trend. The Smart Investing & Trading Score from previous trading session is 56 and hence a deterioration of trend.
| ||||||||
Here are the Smart Investing & Trading Scores of the most requested Consumer Services stocks at 12Stocks.com (click stock name for detailed review):
|


| Consider signing up for our daily 12Stocks.com "Best Stocks Newsletter". You will never ever miss a big stock move again! |
| 12Stocks.com: Investing in Consumer Services sector with Stocks | |
|
The following table helps investors and traders sort through current performance and trends (as measured by Smart Investing & Trading Score) of various
stocks in the Consumer Services sector. Quick View: Move mouse or cursor over stock symbol (ticker) to view short-term Technical chart and over stock name to view long term chart. Click on  to add stock symbol to your watchlist and to add stock symbol to your watchlist and  to view watchlist. Click on any ticker or stock name for detailed market intelligence report for that stock. to view watchlist. Click on any ticker or stock name for detailed market intelligence report for that stock. |
12Stocks.com Performance of Stocks in Consumer Services Sector
| Ticker | Stock Name | Watchlist | Category | Recent Price | Smart Investing & Trading Score | Change % | YTD Change% |
| CBRL | Cracker Barrel |   | Restaurants | 56.36 | 0 | -3.14% | -26.88% |
| FIVE | Five Below | | Retail | 141.93 | 0 | -3.01% | -33.42% |
| BLMN | Bloomin | | Restaurants | 25.04 | 0 | -2.91% | -11.05% |
| ASO | Academy Sports | | Specialty Retail | 56.70 | 0 | -2.74% | -14.11% |
| ONEW | OneWater Marine | | Recreational | 20.15 | 0 | -2.70% | -40.37% |
| DLTH | Duluth | | Apparel | 4.10 | 0 | -2.61% | -23.79% |
| RUSHA | Rush Enterprises | | Automobile | 42.81 | 0 | -2.53% | -14.89% |
| GDEN | Golden Entertainment | | Casinos | 31.26 | 0 | -2.46% | -21.71% |
| BBY | Best Buy | | Retail | 72.03 | 0 | -2.19% | -7.98% |
| BGSF | BG Staffing | | Staffing | 8.50 | 0 | -2.07% | -9.57% |
| SBUX | Starbucks | | Restaurants | 74.44 | 0 | -15.88% | -22.47% |
| NCLH | Norwegian Cruise | | Casinos | 16.08 | 0 | -15.01% | -19.76% |
| GPN | Global Payments | | Services | 109.06 | 0 | -11.17% | -14.13% |
| ONON | On Holding | | Footwear & Accessories | 31.15 | 0 | -1.89% | 14.19% |
| CHUY | Chuy s | | Restaurants | 28.99 | 0 | -1.60% | -24.17% |
| DRI | Darden Restaurants | | Restaurants | 151.15 | 0 | -1.47% | -8.00% |
| RUSHB | Rush Enterprises | | Automobile | 40.33 | 0 | -1.42% | -23.88% |
| ROST | Ross Stores | | Apparel | 127.82 | 0 | -1.34% | -7.64% |
| CMPR | Cimpress | | Services | 84.30 | 0 | -1.14% | 5.31% |
| BKNG | Booking | | Services | 3415.64 | 0 | -1.05% | -3.71% |
| JWN | Nordstrom | | Apparel | 18.81 | 0 | -1.05% | 1.95% |
| SEAT | Vivid Seats | | Internet Content & Information | 5.20 | 0 | -1.05% | -16.75% |
| PK | Park Hotels | | Lodging | 15.97 | 0 | -0.99% | 4.38% |
| MAR | Marriott | | Lodging | 233.86 | 0 | -0.96% | 3.70% |
| SHCO | Soho House | | Lodging | 5.16 | 0 | -0.96% | -29.02% |
| For chart view version of above stock list: Chart View ➞ 0 - 25 , 25 - 50 , 50 - 75 , 75 - 100 , 100 - 125 , 125 - 150 , 150 - 175 , 175 - 200 , 200 - 225 , 225 - 250 , 250 - 275 , 275 - 300 , 300 - 325 , 325 - 350 , 350 - 375 , 375 - 400 , 400 - 425 , 425 - 450 , 450 - 475 | ||
 | Click To Change The Sort Order: By Market Cap or Company Size Performance: Year-to-date, Week and Day |  |
|
Get the most comprehensive stock market coverage daily at 12Stocks.com ➞ Best Stocks Today ➞ Best Stocks Weekly ➞ Best Stocks Year-to-Date ➞ Best Stocks Trends ➞  Best Stocks Today 12Stocks.com Best Nasdaq Stocks ➞ Best S&P 500 Stocks ➞ Best Tech Stocks ➞ Best Biotech Stocks ➞ |
| Detailed Overview of Consumer Services Stocks |
| Consumer Services Technical Overview, Leaders & Laggards, Top Consumer Services ETF Funds & Detailed Consumer Services Stocks List, Charts, Trends & More |
| Consumer Services Sector: Technical Analysis, Trends & YTD Performance | |
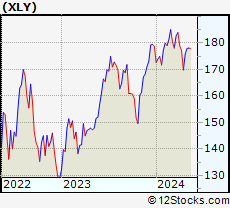
| Consumer Services sector is composed of stocks
from retail, entertainment, media/publishing, consumer goods
and services subsectors. Consumer Services sector, as represented by XLY, an exchange-traded fund [ETF] that holds basket of Consumer Services stocks (e.g, Walmart, Alibaba) is down by -2.4% and is currently underperforming the overall market by -6.94% year-to-date. Below is a quick view of Technical charts and trends: |
|
 XLY Weekly Chart |
|
| Long Term Trend: Not Good | |
| Medium Term Trend: Not Good | |
 XLY Daily Chart |
|
| Short Term Trend: Not Good | |
| Overall Trend Score: 7 | |
| YTD Performance: -2.4% | |
| **Trend Scores & Views Are Only For Educational Purposes And Not For Investing | |
| 12Stocks.com: Top Performing Consumer Services Sector Stocks | ||||||||||||||||||||||||||||||||||||||||||||||||
 The top performing Consumer Services sector stocks year to date are
Now, more recently, over last week, the top performing Consumer Services sector stocks on the move are


|
||||||||||||||||||||||||||||||||||||||||||||||||
| 12Stocks.com: Investing in Consumer Services Sector using Exchange Traded Funds | |
|
The following table shows list of key exchange traded funds (ETF) that
help investors track Consumer Services Index. For detailed view, check out our ETF Funds section of our website. Quick View: Move mouse or cursor over ETF symbol (ticker) to view short-term Technical chart and over ETF name to view long term chart. Click on ticker or stock name for detailed view. Click on to add stock symbol to your watchlist and to view watchlist. |
12Stocks.com List of ETFs that track Consumer Services Index
| Ticker | ETF Name | Watchlist | Recent Price | Smart Investing & Trading Score | Change % | Week % | Year-to-date % |
| XLY | Consumer Discret Sel | | 174.52 | 7 | -0.63 | -0.79 | -2.4% |
| RTH | Retail | | 196.07 | 0 | -1.40 | -2.49 | 4.17% |
| IYC | Consumer Services | | 77.36 | 7 | -0.40 | -1.28 | 2.1% |
| XRT | Retail | | 71.28 | 7 | -0.71 | -2.65 | -1.44% |
| IYK | Consumer Goods | | 66.12 | 51 | -1.12 | -0.96 | 3.47% |
| UCC | Consumer Services | | 33.30 | 42 | -2.67 | -2.52 | -7.26% |
| RETL | Retail Bull 3X | | 8.09 | 12 | -2.65 | -8.38 | -11.29% |
| RXI | Globl Consumer Discretionary | | 159.15 | 7 | -0.45 | -1.26 | 0.06% |
| SCC | Short Consumer Services | | 15.98 | 88 | 2.57 | 1.27 | 4.28% |
| UGE | Consumer Goods | | 16.86 | 83 | -1.43 | -1.83 | 7.08% |
| 12Stocks.com: Charts, Trends, Fundamental Data and Performances of Consumer Services Stocks | |
|
We now take in-depth look at all Consumer Services stocks including charts, multi-period performances and overall trends (as measured by Smart Investing & Trading Score). One can sort Consumer Services stocks (click link to choose) by Daily, Weekly and by Year-to-Date performances. Also, one can sort by size of the company or by market capitalization. |
| Select Your Default Chart Type: | |||||
| |||||
| Click on stock symbol or name for detailed view. Click on to add stock symbol to your watchlist and to view watchlist. Quick View: Move mouse or cursor over "Daily" to quickly view daily Technical stock chart and over "Weekly" to view weekly Technical stock chart. | |||||

 | CBRL Cracker Barrel Old Country Store, Inc. |
| Sector: Services & Goods | |
| SubSector: Restaurants | |
| MarketCap: 1839.6 Millions | |
| Recent Price: 56.36 Smart Investing & Trading Score: 0 | |
| Day Percent Change: -3.14% Day Change: -1.83 | |
| Week Change: -4.99% Year-to-date Change: -26.9% | |
| CBRL Links: Profile News Message Board | |
| Charts:- Daily , Weekly | |
| Add CBRL to Watchlist: View: Get Complete CBRL Trend Analysis ➞ | |
 | FIVE Five Below, Inc. |
| Sector: Services & Goods | |
| SubSector: Specialty Retail, Other | |
| MarketCap: 3693.74 Millions | |
| Recent Price: 141.93 Smart Investing & Trading Score: 0 | |
| Day Percent Change: -3.01% Day Change: -4.41 | |
| Week Change: -5.43% Year-to-date Change: -33.4% | |
| FIVE Links: Profile News Message Board | |
| Charts:- Daily , Weekly | |
| Add FIVE to Watchlist: View: Get Complete FIVE Trend Analysis ➞ | |
 | BLMN Bloomin Brands, Inc. |
| Sector: Services & Goods | |
| SubSector: Restaurants | |
| MarketCap: 503.47 Millions | |
| Recent Price: 25.04 Smart Investing & Trading Score: 0 | |
| Day Percent Change: -2.91% Day Change: -0.75 | |
| Week Change: -7.02% Year-to-date Change: -11.1% | |
| BLMN Links: Profile News Message Board | |
| Charts:- Daily , Weekly | |
| Add BLMN to Watchlist: View: Get Complete BLMN Trend Analysis ➞ | |
 | ASO Academy Sports and Outdoors, Inc. |
| Sector: Services & Goods | |
| SubSector: Specialty Retail | |
| MarketCap: 16027 Millions | |
| Recent Price: 56.70 Smart Investing & Trading Score: 0 | |
| Day Percent Change: -2.74% Day Change: -1.60 | |
| Week Change: -6.62% Year-to-date Change: -14.1% | |
| ASO Links: Profile News Message Board | |
| Charts:- Daily , Weekly | |
| Add ASO to Watchlist: View: Get Complete ASO Trend Analysis ➞ | |
 | ONEW OneWater Marine Inc. |
| Sector: Services & Goods | |
| SubSector: Recreational Vehicles | |
| MarketCap: 42027 Millions | |
| Recent Price: 20.15 Smart Investing & Trading Score: 0 | |
| Day Percent Change: -2.70% Day Change: -0.56 | |
| Week Change: -8.28% Year-to-date Change: -40.4% | |
| ONEW Links: Profile News Message Board | |
| Charts:- Daily , Weekly | |
| Add ONEW to Watchlist: View: Get Complete ONEW Trend Analysis ➞ | |
 | DLTH Duluth Holdings Inc. |
| Sector: Services & Goods | |
| SubSector: Apparel Stores | |
| MarketCap: 180.008 Millions | |
| Recent Price: 4.10 Smart Investing & Trading Score: 0 | |
| Day Percent Change: -2.61% Day Change: -0.11 | |
| Week Change: -6.29% Year-to-date Change: -23.8% | |
| DLTH Links: Profile News Message Board | |
| Charts:- Daily , Weekly | |
| Add DLTH to Watchlist: View: Get Complete DLTH Trend Analysis ➞ | |
 | RUSHA Rush Enterprises, Inc. |
| Sector: Services & Goods | |
| SubSector: Auto Dealerships | |
| MarketCap: 1183.21 Millions | |
| Recent Price: 42.81 Smart Investing & Trading Score: 0 | |
| Day Percent Change: -2.53% Day Change: -1.11 | |
| Week Change: -8.45% Year-to-date Change: -14.9% | |
| RUSHA Links: Profile News Message Board | |
| Charts:- Daily , Weekly | |
| Add RUSHA to Watchlist: View: Get Complete RUSHA Trend Analysis ➞ | |
 | GDEN Golden Entertainment, Inc. |
| Sector: Services & Goods | |
| SubSector: Resorts & Casinos | |
| MarketCap: 130.794 Millions | |
| Recent Price: 31.26 Smart Investing & Trading Score: 0 | |
| Day Percent Change: -2.46% Day Change: -0.79 | |
| Week Change: -3.55% Year-to-date Change: -21.7% | |
| GDEN Links: Profile News Message Board | |
| Charts:- Daily , Weekly | |
| Add GDEN to Watchlist: View: Get Complete GDEN Trend Analysis ➞ | |
 | BBY Best Buy Co., Inc. |
| Sector: Services & Goods | |
| SubSector: Electronics Stores | |
| MarketCap: 15771.3 Millions | |
| Recent Price: 72.03 Smart Investing & Trading Score: 0 | |
| Day Percent Change: -2.19% Day Change: -1.61 | |
| Week Change: -4.02% Year-to-date Change: -8.0% | |
| BBY Links: Profile News Message Board | |
| Charts:- Daily , Weekly | |
| Add BBY to Watchlist: View: Get Complete BBY Trend Analysis ➞ | |
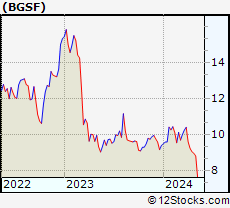 | BGSF BG Staffing, Inc. |
| Sector: Services & Goods | |
| SubSector: Staffing & Outsourcing Services | |
| MarketCap: 111.728 Millions | |
| Recent Price: 8.50 Smart Investing & Trading Score: 0 | |
| Day Percent Change: -2.07% Day Change: -0.18 | |
| Week Change: -5.24% Year-to-date Change: -9.6% | |
| BGSF Links: Profile News Message Board | |
| Charts:- Daily , Weekly | |
| Add BGSF to Watchlist: View: Get Complete BGSF Trend Analysis ➞ | |
 | SBUX Starbucks Corporation |
| Sector: Services & Goods | |
| SubSector: Specialty Eateries | |
| MarketCap: 74909.7 Millions | |
| Recent Price: 74.44 Smart Investing & Trading Score: 0 | |
| Day Percent Change: -15.88% Day Change: -14.05 | |
| Week Change: -15.65% Year-to-date Change: -22.5% | |
| SBUX Links: Profile News Message Board | |
| Charts:- Daily , Weekly | |
| Add SBUX to Watchlist: View: Get Complete SBUX Trend Analysis ➞ | |
 | NCLH Norwegian Cruise Line Holdings Ltd. |
| Sector: Services & Goods | |
| SubSector: Resorts & Casinos | |
| MarketCap: 2895.54 Millions | |
| Recent Price: 16.08 Smart Investing & Trading Score: 0 | |
| Day Percent Change: -15.01% Day Change: -2.84 | |
| Week Change: -15.55% Year-to-date Change: -19.8% | |
| NCLH Links: Profile News Message Board | |
| Charts:- Daily , Weekly | |
| Add NCLH to Watchlist: View: Get Complete NCLH Trend Analysis ➞ | |
 | GPN Global Payments Inc. |
| Sector: Services & Goods | |
| SubSector: Business Services | |
| MarketCap: 39068.8 Millions | |
| Recent Price: 109.06 Smart Investing & Trading Score: 0 | |
| Day Percent Change: -11.17% Day Change: -13.71 | |
| Week Change: -12.45% Year-to-date Change: -14.1% | |
| GPN Links: Profile News Message Board | |
| Charts:- Daily , Weekly | |
| Add GPN to Watchlist: View: Get Complete GPN Trend Analysis ➞ | |
 | ONON On Holding AG |
| Sector: Services & Goods | |
| SubSector: Footwear & Accessories | |
| MarketCap: 10600 Millions | |
| Recent Price: 31.15 Smart Investing & Trading Score: 0 | |
| Day Percent Change: -1.89% Day Change: -0.60 | |
| Week Change: -5% Year-to-date Change: 14.2% | |
| ONON Links: Profile News Message Board | |
| Charts:- Daily , Weekly | |
| Add ONON to Watchlist: View: Get Complete ONON Trend Analysis ➞ | |
 | CHUY Chuy s Holdings, Inc. |
| Sector: Services & Goods | |
| SubSector: Restaurants | |
| MarketCap: 159.17 Millions | |
| Recent Price: 28.99 Smart Investing & Trading Score: 0 | |
| Day Percent Change: -1.60% Day Change: -0.47 | |
| Week Change: -4.42% Year-to-date Change: -24.2% | |
| CHUY Links: Profile News Message Board | |
| Charts:- Daily , Weekly | |
| Add CHUY to Watchlist: View: Get Complete CHUY Trend Analysis ➞ | |
 | DRI Darden Restaurants, Inc. |
| Sector: Services & Goods | |
| SubSector: Restaurants | |
| MarketCap: 5623.1 Millions | |
| Recent Price: 151.15 Smart Investing & Trading Score: 0 | |
| Day Percent Change: -1.47% Day Change: -2.26 | |
| Week Change: -3.17% Year-to-date Change: -8.0% | |
| DRI Links: Profile News Message Board | |
| Charts:- Daily , Weekly | |
| Add DRI to Watchlist: View: Get Complete DRI Trend Analysis ➞ | |
 | RUSHB Rush Enterprises, Inc. |
| Sector: Services & Goods | |
| SubSector: Auto Dealerships | |
| MarketCap: 203.221 Millions | |
| Recent Price: 40.33 Smart Investing & Trading Score: 0 | |
| Day Percent Change: -1.42% Day Change: -0.58 | |
| Week Change: -9.45% Year-to-date Change: -23.9% | |
| RUSHB Links: Profile News Message Board | |
| Charts:- Daily , Weekly | |
| Add RUSHB to Watchlist: View: Get Complete RUSHB Trend Analysis ➞ | |
 | ROST Ross Stores, Inc. |
| Sector: Services & Goods | |
| SubSector: Apparel Stores | |
| MarketCap: 24938.8 Millions | |
| Recent Price: 127.82 Smart Investing & Trading Score: 0 | |
| Day Percent Change: -1.34% Day Change: -1.73 | |
| Week Change: -4.33% Year-to-date Change: -7.6% | |
| ROST Links: Profile News Message Board | |
| Charts:- Daily , Weekly | |
| Add ROST to Watchlist: View: Get Complete ROST Trend Analysis ➞ | |
 | CMPR Cimpress plc |
| Sector: Services & Goods | |
| SubSector: Business Services | |
| MarketCap: 1675.02 Millions | |
| Recent Price: 84.30 Smart Investing & Trading Score: 0 | |
| Day Percent Change: -1.14% Day Change: -0.97 | |
| Week Change: -5.37% Year-to-date Change: 5.3% | |
| CMPR Links: Profile News Message Board | |
| Charts:- Daily , Weekly | |
| Add CMPR to Watchlist: View: Get Complete CMPR Trend Analysis ➞ | |
 | BKNG Booking Holdings Inc. |
| Sector: Services & Goods | |
| SubSector: Business Services | |
| MarketCap: 54467.9 Millions | |
| Recent Price: 3415.64 Smart Investing & Trading Score: 0 | |
| Day Percent Change: -1.05% Day Change: -36.39 | |
| Week Change: -2.99% Year-to-date Change: -3.7% | |
| BKNG Links: Profile News Message Board | |
| Charts:- Daily , Weekly | |
| Add BKNG to Watchlist: View: Get Complete BKNG Trend Analysis ➞ | |
 | JWN Nordstrom, Inc. |
| Sector: Services & Goods | |
| SubSector: Apparel Stores | |
| MarketCap: 3351.68 Millions | |
| Recent Price: 18.81 Smart Investing & Trading Score: 0 | |
| Day Percent Change: -1.05% Day Change: -0.20 | |
| Week Change: -1.67% Year-to-date Change: 2.0% | |
| JWN Links: Profile News Message Board | |
| Charts:- Daily , Weekly | |
| Add JWN to Watchlist: View: Get Complete JWN Trend Analysis ➞ | |
 | SEAT Vivid Seats Inc. |
| Sector: Services & Goods | |
| SubSector: Internet Content & Information | |
| MarketCap: 1560 Millions | |
| Recent Price: 5.20 Smart Investing & Trading Score: 0 | |
| Day Percent Change: -1.05% Day Change: -0.05 | |
| Week Change: -12.32% Year-to-date Change: -16.8% | |
| SEAT Links: Profile News Message Board | |
| Charts:- Daily , Weekly | |
| Add SEAT to Watchlist: View: Get Complete SEAT Trend Analysis ➞ | |
 | PK Park Hotels & Resorts Inc. |
| Sector: Services & Goods | |
| SubSector: Lodging | |
| MarketCap: 2221.06 Millions | |
| Recent Price: 15.97 Smart Investing & Trading Score: 0 | |
| Day Percent Change: -0.99% Day Change: -0.16 | |
| Week Change: -3.62% Year-to-date Change: 4.4% | |
| PK Links: Profile News Message Board | |
| Charts:- Daily , Weekly | |
| Add PK to Watchlist: View: Get Complete PK Trend Analysis ➞ | |
 | MAR Marriott International, Inc. |
| Sector: Services & Goods | |
| SubSector: Lodging | |
| MarketCap: 25831.6 Millions | |
| Recent Price: 233.86 Smart Investing & Trading Score: 0 | |
| Day Percent Change: -0.96% Day Change: -2.27 | |
| Week Change: -2.9% Year-to-date Change: 3.7% | |
| MAR Links: Profile News Message Board | |
| Charts:- Daily , Weekly | |
| Add MAR to Watchlist: View: Get Complete MAR Trend Analysis ➞ | |
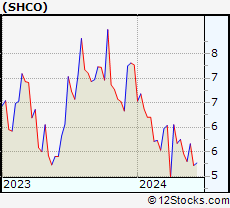 | SHCO Soho House & Co Inc. |
| Sector: Services & Goods | |
| SubSector: Lodging | |
| MarketCap: 1140 Millions | |
| Recent Price: 5.16 Smart Investing & Trading Score: 0 | |
| Day Percent Change: -0.96% Day Change: -0.05 | |
| Week Change: -8.83% Year-to-date Change: -29.0% | |
| SHCO Links: Profile News Message Board | |
| Charts:- Daily , Weekly | |
| Add SHCO to Watchlist: View: Get Complete SHCO Trend Analysis ➞ | |
| For tabular summary view of above stock list: Summary View ➞ 0 - 25 , 25 - 50 , 50 - 75 , 75 - 100 , 100 - 125 , 125 - 150 , 150 - 175 , 175 - 200 , 200 - 225 , 225 - 250 , 250 - 275 , 275 - 300 , 300 - 325 , 325 - 350 , 350 - 375 , 375 - 400 , 400 - 425 , 425 - 450 , 450 - 475 | ||
| Click To Change The Sort Order: By Market Cap or Company Size Performance: Year-to-date, Week and Day | |
| Select Chart Type: | ||
|
Best Stocks Today 12Stocks.com |
© 2024 12Stocks.com Terms & Conditions Privacy Contact Us
All Information Provided Only For Education And Not To Be Used For Investing or Trading. See Terms & Conditions


One More Thing ... Get Best Stocks Delivered Daily!
Never Ever Miss A Move With Our Top Ten Stocks Lists
Find Best Stocks In Any Market - Bull or Bear Market
Take A Peek At Our Top Ten Stocks Lists: Daily, Weekly, Year-to-Date & Top Trends
Find Best Stocks In Any Market - Bull or Bear Market
Take A Peek At Our Top Ten Stocks Lists: Daily, Weekly, Year-to-Date & Top Trends
Consumer Services Stocks With Best Up Trends [0-bearish to 100-bullish]: Chicken Soup[100], Smart Share[100], OneSpaWorld [100], Outbrain [100], Gray Television[100], Playtika Holding[100], Brinker [100], Hesai [100], Outfront Media[95], ABM Industries[95], RealReal [95]
Best Consumer Services Stocks Year-to-Date:
U Power[2879.91%], Vroom [1802.87%], Yatsen Holding[467.25%], Fluent [395.52%], Research[129.49%], Codere Online[129.11%], RealReal [94.53%], Sweetgreen [76.19%], PaySign [66.79%], Carvana Co[64.51%], CAVA [56.42%] Best Consumer Services Stocks This Week:
Chicken Soup[113.04%], Smart Share[28.78%], CareDx [21.43%], Golden Heaven[19.29%], Lanvin [15.19%], Fluent [12.54%], Brinker [12.53%], OneSpaWorld [11.89%], Research[11.28%], Noodles & [10.71%], RealReal [8.91%] Best Consumer Services Stocks Daily:
Chicken Soup[92.91%], CareDx [18.30%], Smart Share[12.44%], OneSpaWorld [12.42%], DHI [8.97%], Verisk Analytics[6.81%], Qurate Retail[5.76%], EVI Industries[5.60%], Daily Journal[5.49%], MYT Netherlands[5.36%], EVgo [5.28%]