
 Login Sign Up


| |||||
 |  | ||||

| 12Stocks.com Market Intelligence |
Best Consumer Services Stocks
| In a hurry? Services & Goods Stocks: Performance Trends Table, Stock Charts
Sort Consumer Services: Daily, Weekly, Year-to-Date, Market Cap & Trends. Filter Services & Goods stocks list by size: All Large Mid-Range Small |
| 12Stocks.com Consumer Services Stocks Performances & Trends Daily | |||||||||
|
|  The overall Smart Investing & Trading Score is 58 (0-bearish to 100-bullish) which puts Consumer Services sector in short term neutral trend. The Smart Investing & Trading Score from previous trading session is 23 and an improvement of trend continues.
| ||||||||
Here are the Smart Investing & Trading Scores of the most requested Consumer Services stocks at 12Stocks.com (click stock name for detailed review):
|


| Consider signing up for our daily 12Stocks.com "Best Stocks Newsletter". You will never ever miss a big stock move again! |
| 12Stocks.com: Investing in Consumer Services sector with Stocks | |
|
The following table helps investors and traders sort through current performance and trends (as measured by Smart Investing & Trading Score) of various
stocks in the Consumer Services sector. Quick View: Move mouse or cursor over stock symbol (ticker) to view short-term Technical chart and over stock name to view long term chart. Click on  to add stock symbol to your watchlist and to add stock symbol to your watchlist and  to view watchlist. Click on any ticker or stock name for detailed market intelligence report for that stock. to view watchlist. Click on any ticker or stock name for detailed market intelligence report for that stock. |
12Stocks.com Performance of Stocks in Consumer Services Sector
| Ticker | Stock Name | Watchlist | Category | Recent Price | Smart Investing & Trading Score | Change % | YTD Change% |
| MYPS | PLAYSTUDIOS |   | Electronic Gaming & Multimedia | 2.20 | 46 | -3.93% | -17.76% |
| CNK | Cinemark | | Entertainment | 17.70 | 46 | -0.73% | 25.62% |
| TGT | Target | | Retail | 165.80 | 46 | -0.43% | 16.42% |
| DG | Dollar General | | Retail | 142.70 | 46 | -0.02% | 4.97% |
| CASS | Cass Information | | Services | 43.38 | 45 | 0.87% | -3.72% |
| VIPS | Vipshop | | Retail | 15.84 | 45 | 0.28% | -10.84% |
| VALU | Value Line | | Publishing | 37.45 | 45 | 0.00% | -23.18% |
| GGR | Gogoro | | Auto Parts | 1.49 | 45 | -0.67% | -42.69% |
| NWSA | News | | Broadcasting | 24.52 | 45 | -0.39% | -0.14% |
| TGNA | TEGNA | | Broadcasting | 13.74 | 45 | 0.18% | -10.16% |
| MCD | McDonald s | | Restaurants | 272.98 | 45 | -1.41% | -7.94% |
| TBI | TrueBlue | | Staffing | 10.76 | 45 | -1.01% | -29.86% |
| ASPS | Altisource Portfolio | | Services | 1.66 | 44 | 0.00% | -53.37% |
| COOK | Traeger | | Furnishings, Fixtures & Appliances | 2.09 | 44 | -2.34% | -26.02% |
| WMT | Walmart | | Retail | 59.25 | 44 | 0.27% | 12.75% |
| W | Wayfair | | Retail | 53.85 | 44 | -6.75% | -12.72% |
| KRT | Karat Packaging | | Packaging | 26.67 | 44 | -1.91% | 7.07% |
| LOW | Lowe s | | Retail | 229.52 | 44 | -1.73% | 3.13% |
| CTAS | Cintas | | Services | 663.50 | 44 | -0.42% | 10.10% |
| ORLY | O Reilly | | Auto Parts | 1090.39 | 44 | -0.18% | 14.77% |
| EDR | Endeavor | | Entertainment | 26.36 | 43 | 0.06% | 11.10% |
| HCSG | Healthcare Services | | Services | 11.50 | 43 | -3.77% | 10.90% |
| AZO | AutoZone | | Auto Parts | 2960.00 | 43 | -0.04% | 14.48% |
| CHH | Choice Hotels | | Lodging | 119.57 | 42 | 2.07% | 5.53% |
| EVGO | EVgo | | Specialty Retail | 1.77 | 42 | 1.43% | -50.49% |
| For chart view version of above stock list: Chart View ➞ 0 - 25 , 25 - 50 , 50 - 75 , 75 - 100 , 100 - 125 , 125 - 150 , 150 - 175 , 175 - 200 , 200 - 225 , 225 - 250 , 250 - 275 , 275 - 300 , 300 - 325 , 325 - 350 , 350 - 375 , 375 - 400 , 400 - 425 | ||
 | Click To Change The Sort Order: By Market Cap or Company Size Performance: Year-to-date, Week and Day |  |
|
Get the most comprehensive stock market coverage daily at 12Stocks.com ➞ Best Stocks Today ➞ Best Stocks Weekly ➞ Best Stocks Year-to-Date ➞ Best Stocks Trends ➞  Best Stocks Today 12Stocks.com Best Nasdaq Stocks ➞ Best S&P 500 Stocks ➞ Best Tech Stocks ➞ Best Biotech Stocks ➞ |
| Detailed Overview of Consumer Services Stocks |
| Consumer Services Technical Overview, Leaders & Laggards, Top Consumer Services ETF Funds & Detailed Consumer Services Stocks List, Charts, Trends & More |
| Consumer Services Sector: Technical Analysis, Trends & YTD Performance | |
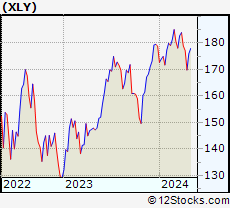
| Consumer Services sector is composed of stocks
from retail, entertainment, media/publishing, consumer goods
and services subsectors. Consumer Services sector, as represented by XLY, an exchange-traded fund [ETF] that holds basket of Consumer Services stocks (e.g, Walmart, Alibaba) is down by -2.61% and is currently underperforming the overall market by -7.95% year-to-date. Below is a quick view of Technical charts and trends: |
|
 XLY Weekly Chart |
|
| Long Term Trend: Good | |
| Medium Term Trend: Not Good | |
 XLY Daily Chart |
|
| Short Term Trend: Very Good | |
| Overall Trend Score: 58 | |
| YTD Performance: -2.61% | |
| **Trend Scores & Views Are Only For Educational Purposes And Not For Investing | |
| 12Stocks.com: Top Performing Consumer Services Sector Stocks | ||||||||||||||||||||||||||||||||||||||||||||||||
 The top performing Consumer Services sector stocks year to date are
Now, more recently, over last week, the top performing Consumer Services sector stocks on the move are


|
||||||||||||||||||||||||||||||||||||||||||||||||
| 12Stocks.com: Investing in Consumer Services Sector using Exchange Traded Funds | |
|
The following table shows list of key exchange traded funds (ETF) that
help investors track Consumer Services Index. For detailed view, check out our ETF Funds section of our website. Quick View: Move mouse or cursor over ETF symbol (ticker) to view short-term Technical chart and over ETF name to view long term chart. Click on ticker or stock name for detailed view. Click on to add stock symbol to your watchlist and to view watchlist. |
12Stocks.com List of ETFs that track Consumer Services Index
| Ticker | ETF Name | Watchlist | Recent Price | Smart Investing & Trading Score | Change % | Week % | Year-to-date % |
| XLY | Consumer Discret Sel | | 174.14 | 58 | 0.93 | 2.58 | -2.61% |
| RTH | Retail | | 200.56 | 58 | 0.03 | 0.97 | 6.55% |
| XRT | Retail | | 72.48 | 65 | -0.76 | 1.85 | 0.23% |
| UCC | Consumer Services | | 33.37 | 73 | 2.12 | 5.68 | -7.07% |
| SCC | Short Consumer Services | | 16.06 | 35 | -2.22 | -5.27 | 4.8% |
| UGE | Consumer Goods | | 17.02 | 73 | -0.09 | 2.33 | 8.09% |
| 12Stocks.com: Charts, Trends, Fundamental Data and Performances of Consumer Services Stocks | |
|
We now take in-depth look at all Consumer Services stocks including charts, multi-period performances and overall trends (as measured by Smart Investing & Trading Score). One can sort Consumer Services stocks (click link to choose) by Daily, Weekly and by Year-to-Date performances. Also, one can sort by size of the company or by market capitalization. |
| Select Your Default Chart Type: | |||||
| |||||
| Click on stock symbol or name for detailed view. Click on to add stock symbol to your watchlist and to view watchlist. Quick View: Move mouse or cursor over "Daily" to quickly view daily Technical stock chart and over "Weekly" to view weekly Technical stock chart. | |||||

 | MYPS PLAYSTUDIOS, Inc. |
| Sector: Services & Goods | |
| SubSector: Electronic Gaming & Multimedia | |
| MarketCap: 635 Millions | |
| Recent Price: 2.20 Smart Investing & Trading Score: 46 | |
| Day Percent Change: -3.93% Day Change: -0.09 | |
| Week Change: -4.76% Year-to-date Change: -17.8% | |
| MYPS Links: Profile News Message Board | |
| Charts:- Daily , Weekly | |
| Add MYPS to Watchlist: View: Get Complete MYPS Trend Analysis ➞ | |
 | CNK Cinemark Holdings, Inc. |
| Sector: Services & Goods | |
| SubSector: Movie Production, Theaters | |
| MarketCap: 1776.29 Millions | |
| Recent Price: 17.70 Smart Investing & Trading Score: 46 | |
| Day Percent Change: -0.73% Day Change: -0.13 | |
| Week Change: -2.85% Year-to-date Change: 25.6% | |
| CNK Links: Profile News Message Board | |
| Charts:- Daily , Weekly | |
| Add CNK to Watchlist: View: Get Complete CNK Trend Analysis ➞ | |
 | TGT Target Corporation |
| Sector: Services & Goods | |
| SubSector: Discount, Variety Stores | |
| MarketCap: 55980.6 Millions | |
| Recent Price: 165.80 Smart Investing & Trading Score: 46 | |
| Day Percent Change: -0.43% Day Change: -0.71 | |
| Week Change: -1.49% Year-to-date Change: 16.4% | |
| TGT Links: Profile News Message Board | |
| Charts:- Daily , Weekly | |
| Add TGT to Watchlist: View: Get Complete TGT Trend Analysis ➞ | |
 | DG Dollar General Corporation |
| Sector: Services & Goods | |
| SubSector: Discount, Variety Stores | |
| MarketCap: 39611.9 Millions | |
| Recent Price: 142.70 Smart Investing & Trading Score: 46 | |
| Day Percent Change: -0.02% Day Change: -0.03 | |
| Week Change: -1.46% Year-to-date Change: 5.0% | |
| DG Links: Profile News Message Board | |
| Charts:- Daily , Weekly | |
| Add DG to Watchlist: View: Get Complete DG Trend Analysis ➞ | |
 | CASS Cass Information Systems, Inc. |
| Sector: Services & Goods | |
| SubSector: Business Services | |
| MarketCap: 477.382 Millions | |
| Recent Price: 43.38 Smart Investing & Trading Score: 45 | |
| Day Percent Change: 0.87% Day Change: 0.38 | |
| Week Change: 4.14% Year-to-date Change: -3.7% | |
| CASS Links: Profile News Message Board | |
| Charts:- Daily , Weekly | |
| Add CASS to Watchlist: View: Get Complete CASS Trend Analysis ➞ | |
 | VIPS Vipshop Holdings Limited |
| Sector: Services & Goods | |
| SubSector: Catalog & Mail Order Houses | |
| MarketCap: 10496.2 Millions | |
| Recent Price: 15.84 Smart Investing & Trading Score: 45 | |
| Day Percent Change: 0.28% Day Change: 0.05 | |
| Week Change: 4.45% Year-to-date Change: -10.8% | |
| VIPS Links: Profile News Message Board | |
| Charts:- Daily , Weekly | |
| Add VIPS to Watchlist: View: Get Complete VIPS Trend Analysis ➞ | |
 | VALU Value Line, Inc. |
| Sector: Services & Goods | |
| SubSector: Publishing - Periodicals | |
| MarketCap: 254.3 Millions | |
| Recent Price: 37.45 Smart Investing & Trading Score: 45 | |
| Day Percent Change: 0.00% Day Change: 0.00 | |
| Week Change: 0.21% Year-to-date Change: -23.2% | |
| VALU Links: Profile News Message Board | |
| Charts:- Daily , Weekly | |
| Add VALU to Watchlist: View: Get Complete VALU Trend Analysis ➞ | |
 | GGR Gogoro Inc. |
| Sector: Services & Goods | |
| SubSector: Auto Parts | |
| MarketCap: 856 Millions | |
| Recent Price: 1.49 Smart Investing & Trading Score: 45 | |
| Day Percent Change: -0.67% Day Change: -0.01 | |
| Week Change: 5.67% Year-to-date Change: -42.7% | |
| GGR Links: Profile News Message Board | |
| Charts:- Daily , Weekly | |
| Add GGR to Watchlist: View: Get Complete GGR Trend Analysis ➞ | |
 | NWSA News Corporation |
| Sector: Services & Goods | |
| SubSector: Broadcasting - TV | |
| MarketCap: 5857.53 Millions | |
| Recent Price: 24.52 Smart Investing & Trading Score: 45 | |
| Day Percent Change: -0.39% Day Change: -0.09 | |
| Week Change: 2.06% Year-to-date Change: -0.1% | |
| NWSA Links: Profile News Message Board | |
| Charts:- Daily , Weekly | |
| Add NWSA to Watchlist: View: Get Complete NWSA Trend Analysis ➞ | |
 | TGNA TEGNA Inc. |
| Sector: Services & Goods | |
| SubSector: Broadcasting - TV | |
| MarketCap: 2791.83 Millions | |
| Recent Price: 13.74 Smart Investing & Trading Score: 45 | |
| Day Percent Change: 0.18% Day Change: 0.02 | |
| Week Change: -0.54% Year-to-date Change: -10.2% | |
| TGNA Links: Profile News Message Board | |
| Charts:- Daily , Weekly | |
| Add TGNA to Watchlist: View: Get Complete TGNA Trend Analysis ➞ | |
 | MCD McDonald s Corporation |
| Sector: Services & Goods | |
| SubSector: Restaurants | |
| MarketCap: 122481 Millions | |
| Recent Price: 272.98 Smart Investing & Trading Score: 45 | |
| Day Percent Change: -1.41% Day Change: -3.90 | |
| Week Change: 0.36% Year-to-date Change: -7.9% | |
| MCD Links: Profile News Message Board | |
| Charts:- Daily , Weekly | |
| Add MCD to Watchlist: View: Get Complete MCD Trend Analysis ➞ | |
 | TBI TrueBlue, Inc. |
| Sector: Services & Goods | |
| SubSector: Staffing & Outsourcing Services | |
| MarketCap: 563.228 Millions | |
| Recent Price: 10.76 Smart Investing & Trading Score: 45 | |
| Day Percent Change: -1.01% Day Change: -0.11 | |
| Week Change: -0.65% Year-to-date Change: -29.9% | |
| TBI Links: Profile News Message Board | |
| Charts:- Daily , Weekly | |
| Add TBI to Watchlist: View: Get Complete TBI Trend Analysis ➞ | |
 | ASPS Altisource Portfolio Solutions S.A. |
| Sector: Services & Goods | |
| SubSector: Business Services | |
| MarketCap: 120.382 Millions | |
| Recent Price: 1.66 Smart Investing & Trading Score: 44 | |
| Day Percent Change: 0.00% Day Change: 0.00 | |
| Week Change: 0.61% Year-to-date Change: -53.4% | |
| ASPS Links: Profile News Message Board | |
| Charts:- Daily , Weekly | |
| Add ASPS to Watchlist: View: Get Complete ASPS Trend Analysis ➞ | |
 | COOK Traeger, Inc. |
| Sector: Services & Goods | |
| SubSector: Furnishings, Fixtures & Appliances | |
| MarketCap: 524 Millions | |
| Recent Price: 2.09 Smart Investing & Trading Score: 44 | |
| Day Percent Change: -2.34% Day Change: -0.05 | |
| Week Change: -0.95% Year-to-date Change: -26.0% | |
| COOK Links: Profile News Message Board | |
| Charts:- Daily , Weekly | |
| Add COOK to Watchlist: View: Get Complete COOK Trend Analysis ➞ | |
 | WMT Walmart Inc. |
| Sector: Services & Goods | |
| SubSector: Discount, Variety Stores | |
| MarketCap: 355610 Millions | |
| Recent Price: 59.25 Smart Investing & Trading Score: 44 | |
| Day Percent Change: 0.27% Day Change: 0.16 | |
| Week Change: -0.47% Year-to-date Change: 12.8% | |
| WMT Links: Profile News Message Board | |
| Charts:- Daily , Weekly | |
| Add WMT to Watchlist: View: Get Complete WMT Trend Analysis ➞ | |
 | W Wayfair Inc. |
| Sector: Services & Goods | |
| SubSector: Catalog & Mail Order Houses | |
| MarketCap: 3497.02 Millions | |
| Recent Price: 53.85 Smart Investing & Trading Score: 44 | |
| Day Percent Change: -6.75% Day Change: -3.90 | |
| Week Change: 0.32% Year-to-date Change: -12.7% | |
| W Links: Profile News Message Board | |
| Charts:- Daily , Weekly | |
| Add W to Watchlist: View: Get Complete W Trend Analysis ➞ | |
 | KRT Karat Packaging Inc. |
| Sector: Services & Goods | |
| SubSector: Packaging & Containers | |
| MarketCap: 357 Millions | |
| Recent Price: 26.67 Smart Investing & Trading Score: 44 | |
| Day Percent Change: -1.91% Day Change: -0.52 | |
| Week Change: -0.6% Year-to-date Change: 7.1% | |
| KRT Links: Profile News Message Board | |
| Charts:- Daily , Weekly | |
| Add KRT to Watchlist: View: Get Complete KRT Trend Analysis ➞ | |
 | LOW Lowe s Companies, Inc. |
| Sector: Services & Goods | |
| SubSector: Home Improvement Stores | |
| MarketCap: 56084.2 Millions | |
| Recent Price: 229.52 Smart Investing & Trading Score: 44 | |
| Day Percent Change: -1.73% Day Change: -4.04 | |
| Week Change: -0.31% Year-to-date Change: 3.1% | |
| LOW Links: Profile News Message Board | |
| Charts:- Daily , Weekly | |
| Add LOW to Watchlist: View: Get Complete LOW Trend Analysis ➞ | |
 | CTAS Cintas Corporation |
| Sector: Services & Goods | |
| SubSector: Business Services | |
| MarketCap: 20154.6 Millions | |
| Recent Price: 663.50 Smart Investing & Trading Score: 44 | |
| Day Percent Change: -0.42% Day Change: -2.83 | |
| Week Change: 0.33% Year-to-date Change: 10.1% | |
| CTAS Links: Profile News Message Board | |
| Charts:- Daily , Weekly | |
| Add CTAS to Watchlist: View: Get Complete CTAS Trend Analysis ➞ | |
 | ORLY O Reilly Automotive, Inc. |
| Sector: Services & Goods | |
| SubSector: Auto Parts Stores | |
| MarketCap: 22391.5 Millions | |
| Recent Price: 1090.39 Smart Investing & Trading Score: 44 | |
| Day Percent Change: -0.18% Day Change: -1.96 | |
| Week Change: -0.05% Year-to-date Change: 14.8% | |
| ORLY Links: Profile News Message Board | |
| Charts:- Daily , Weekly | |
| Add ORLY to Watchlist: View: Get Complete ORLY Trend Analysis ➞ | |
 | EDR Endeavor Group Holdings, Inc. |
| Sector: Services & Goods | |
| SubSector: Entertainment | |
| MarketCap: 11310 Millions | |
| Recent Price: 26.36 Smart Investing & Trading Score: 43 | |
| Day Percent Change: 0.06% Day Change: 0.01 | |
| Week Change: -0.51% Year-to-date Change: 11.1% | |
| EDR Links: Profile News Message Board | |
| Charts:- Daily , Weekly | |
| Add EDR to Watchlist: View: Get Complete EDR Trend Analysis ➞ | |
 | HCSG Healthcare Services Group, Inc. |
| Sector: Services & Goods | |
| SubSector: Business Services | |
| MarketCap: 1758.32 Millions | |
| Recent Price: 11.50 Smart Investing & Trading Score: 43 | |
| Day Percent Change: -3.77% Day Change: -0.45 | |
| Week Change: -3.69% Year-to-date Change: 10.9% | |
| HCSG Links: Profile News Message Board | |
| Charts:- Daily , Weekly | |
| Add HCSG to Watchlist: View: Get Complete HCSG Trend Analysis ➞ | |
 | AZO AutoZone, Inc. |
| Sector: Services & Goods | |
| SubSector: Auto Parts Stores | |
| MarketCap: 19128 Millions | |
| Recent Price: 2960.00 Smart Investing & Trading Score: 43 | |
| Day Percent Change: -0.04% Day Change: -1.04 | |
| Week Change: -0.86% Year-to-date Change: 14.5% | |
| AZO Links: Profile News Message Board | |
| Charts:- Daily , Weekly | |
| Add AZO to Watchlist: View: Get Complete AZO Trend Analysis ➞ | |
 | CHH Choice Hotels International, Inc. |
| Sector: Services & Goods | |
| SubSector: Lodging | |
| MarketCap: 3427.56 Millions | |
| Recent Price: 119.57 Smart Investing & Trading Score: 42 | |
| Day Percent Change: 2.07% Day Change: 2.42 | |
| Week Change: 2.76% Year-to-date Change: 5.5% | |
| CHH Links: Profile News Message Board | |
| Charts:- Daily , Weekly | |
| Add CHH to Watchlist: View: Get Complete CHH Trend Analysis ➞ | |
 | EVGO EVgo, Inc. |
| Sector: Services & Goods | |
| SubSector: Specialty Retail | |
| MarketCap: 1140 Millions | |
| Recent Price: 1.77 Smart Investing & Trading Score: 42 | |
| Day Percent Change: 1.43% Day Change: 0.02 | |
| Week Change: 2.6% Year-to-date Change: -50.5% | |
| EVGO Links: Profile News Message Board | |
| Charts:- Daily , Weekly | |
| Add EVGO to Watchlist: View: Get Complete EVGO Trend Analysis ➞ | |
| For tabular summary view of above stock list: Summary View ➞ 0 - 25 , 25 - 50 , 50 - 75 , 75 - 100 , 100 - 125 , 125 - 150 , 150 - 175 , 175 - 200 , 200 - 225 , 225 - 250 , 250 - 275 , 275 - 300 , 300 - 325 , 325 - 350 , 350 - 375 , 375 - 400 , 400 - 425 | ||
| Click To Change The Sort Order: By Market Cap or Company Size Performance: Year-to-date, Week and Day | |
| Select Chart Type: | ||
|
Best Stocks Today 12Stocks.com |
© 2024 12Stocks.com Terms & Conditions Privacy Contact Us
All Information Provided Only For Education And Not To Be Used For Investing or Trading. See Terms & Conditions


One More Thing ... Get Best Stocks Delivered Daily!
Never Ever Miss A Move With Our Top Ten Stocks Lists
Find Best Stocks In Any Market - Bull or Bear Market
Take A Peek At Our Top Ten Stocks Lists: Daily, Weekly, Year-to-Date & Top Trends
Find Best Stocks In Any Market - Bull or Bear Market
Take A Peek At Our Top Ten Stocks Lists: Daily, Weekly, Year-to-Date & Top Trends
Consumer Services Stocks With Best Up Trends [0-bearish to 100-bullish]: Yatsen Holding[100], 1[100], Alibaba [100], MINISO [100], IMAX [100], Omnicom [100], Carriage Services[100], Texas Roadhouse[100], MYT Netherlands[100], Napco Security[100], Reservoir Media[100]
Best Consumer Services Stocks Year-to-Date:
U Power[2785.04%], Vroom [1864.2%], Yatsen Holding[473.4%], Fluent [288.06%], Codere Online[137.67%], Research[105.46%], PaySign [58.04%], DXP Enterprises[52.26%], Gaia [50.37%], CRA [49.63%], DoubleDown Interactive[41.63%] Best Consumer Services Stocks This Week:
Chicken Soup[124.57%], Hibbett Sports[21.01%], Yatsen Holding[16.04%], Jumia Technologies[15.36%], Ameresco [13.7%], MYT Netherlands[12.79%], Baozun [12.72%], 1[11.49%], K12 [11.41%], Zumiez [11.34%], Allbirds [10.46%] Best Consumer Services Stocks Daily:
Chicken Soup[113.88%], K12 [8.21%], Yatsen Holding[6.74%], Allego N.V[6.31%], Watsco [5.94%], 1[5.92%], Starbox [5.73%], Gaia [5.45%], Hilton Worldwide[5.33%], Olaplex [4.38%], Dada Nexus[4.03%]