
 Login Sign Up


| |||||
 |  | ||||

| 12Stocks.com Market Intelligence |
Best Consumer Services Stocks
| In a hurry? Services & Goods Stocks: Performance Trends Table, Stock Charts
Sort Consumer Services: Daily, Weekly, Year-to-Date, Market Cap & Trends. Filter Services & Goods stocks list by size: All Large Mid-Range Small |
| 12Stocks.com Consumer Services Stocks Performances & Trends Daily | |||||||||
|
|  The overall Smart Investing & Trading Score is 68 (0-bearish to 100-bullish) which puts Consumer Services sector in short term neutral to bullish trend. The Smart Investing & Trading Score from previous trading session is 51 and hence an improvement of trend.
| ||||||||
Here are the Smart Investing & Trading Scores of the most requested Consumer Services stocks at 12Stocks.com (click stock name for detailed review):
|


| Consider signing up for our daily 12Stocks.com "Best Stocks Newsletter". You will never ever miss a big stock move again! |
| 12Stocks.com: Investing in Consumer Services sector with Stocks | |
|
The following table helps investors and traders sort through current performance and trends (as measured by Smart Investing & Trading Score) of various
stocks in the Consumer Services sector. Quick View: Move mouse or cursor over stock symbol (ticker) to view short-term Technical chart and over stock name to view long term chart. Click on  to add stock symbol to your watchlist and to add stock symbol to your watchlist and  to view watchlist. Click on any ticker or stock name for detailed market intelligence report for that stock. to view watchlist. Click on any ticker or stock name for detailed market intelligence report for that stock. |
12Stocks.com Performance of Stocks in Consumer Services Sector
| Ticker | Stock Name | Watchlist | Category | Recent Price | Smart Investing & Trading Score | Change % | YTD Change% |
| ROL | Rollins |   | Services | 44.90 | 75 | 1.42% | 2.82% |
| STN | Stantec | | Services | 81.84 | 75 | 0.42% | 2.06% |
| GPC | Genuine Parts | | Auto Parts | 159.93 | 75 | -0.71% | 15.47% |
| DJCO | Daily Journal | | Publishing | 344.60 | 75 | -0.69% | 1.11% |
| HGV | Hilton Grand | | Casinos | 44.34 | 75 | -0.16% | 10.35% |
| GME | GameStop | | Retail | 11.90 | 74 | 6.16% | -32.12% |
| ASPS | Altisource Portfolio | | Services | 1.97 | 74 | 5.35% | -44.66% |
| EXPO | Exponent | | Services | 95.14 | 74 | 19.40% | 8.06% |
| CSSEP | Chicken Soup | | Broadcasting | 1.26 | 74 | 1.58% | -71.95% |
| PLTK | Playtika Holding | | Electronic Gaming & Multimedia | 7.15 | 74 | 1.42% | -17.10% |
| MED | Medifast | | Retail | 33.71 | 74 | 0.63% | -49.85% |
| SSP | E.W. Scripps | | Broadcasting | 3.71 | 74 | 0.41% | -53.63% |
| DIN | Dine Brands | | Restaurants | 45.17 | 74 | -1.12% | -9.02% |
| ZUMZ | Zumiez | | Retail | 16.93 | 74 | -0.29% | -16.76% |
| FWRG | First Watch | | Restaurants | 23.64 | 73 | 0.04% | 18.62% |
| NCLH | Norwegian Cruise | | Casinos | 19.04 | 73 | -1.60% | -4.99% |
| IHG | InterContinental Hotels | | Lodging | 100.93 | 73 | 0.22% | 10.69% |
| BBSI | Barrett Business | | Staffing | 121.52 | 71 | -1.29% | 4.94% |
| WISH | ContextLogic | | Internet Retail | 5.70 | 71 | -0.18% | -4.12% |
| WMT | Walmart | | Retail | 60.16 | 71 | -0.08% | 14.48% |
| SHAK | Shake Shack | | Restaurants | 104.88 | 70 | 3.45% | 41.50% |
| JMIA | Jumia Technologies | | Retail | 4.54 | 70 | 2.95% | 28.61% |
| PDD | Pinduoduo | | Retail | 129.30 | 70 | 2.74% | -11.63% |
| GK | G&K Services | | Services | 19.79 | 70 | 1.98% | 9.13% |
| H | Hyatt Hotels | | Lodging | 151.32 | 70 | 0.04% | 16.03% |
| For chart view version of above stock list: Chart View ➞ 0 - 25 , 25 - 50 , 50 - 75 , 75 - 100 , 100 - 125 , 125 - 150 , 150 - 175 , 175 - 200 , 200 - 225 , 225 - 250 , 250 - 275 , 275 - 300 , 300 - 325 , 325 - 350 , 350 - 375 , 375 - 400 , 400 - 425 , 425 - 450 , 450 - 475 | ||
 | Click To Change The Sort Order: By Market Cap or Company Size Performance: Year-to-date, Week and Day |  |
|
Get the most comprehensive stock market coverage daily at 12Stocks.com ➞ Best Stocks Today ➞ Best Stocks Weekly ➞ Best Stocks Year-to-Date ➞ Best Stocks Trends ➞  Best Stocks Today 12Stocks.com Best Nasdaq Stocks ➞ Best S&P 500 Stocks ➞ Best Tech Stocks ➞ Best Biotech Stocks ➞ |
| Detailed Overview of Consumer Services Stocks |
| Consumer Services Technical Overview, Leaders & Laggards, Top Consumer Services ETF Funds & Detailed Consumer Services Stocks List, Charts, Trends & More |
| Consumer Services Sector: Technical Analysis, Trends & YTD Performance | |
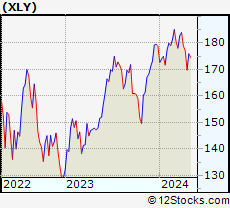
| Consumer Services sector is composed of stocks
from retail, entertainment, media/publishing, consumer goods
and services subsectors. Consumer Services sector, as represented by XLY, an exchange-traded fund [ETF] that holds basket of Consumer Services stocks (e.g, Walmart, Alibaba) is down by -1.62% and is currently underperforming the overall market by -7.76% year-to-date. Below is a quick view of Technical charts and trends: |
|
 XLY Weekly Chart |
|
| Long Term Trend: Good | |
| Medium Term Trend: Not Good | |
 XLY Daily Chart |
|
| Short Term Trend: Very Good | |
| Overall Trend Score: 68 | |
| YTD Performance: -1.62% | |
| **Trend Scores & Views Are Only For Educational Purposes And Not For Investing | |
| 12Stocks.com: Top Performing Consumer Services Sector Stocks | ||||||||||||||||||||||||||||||||||||||||||||||||
 The top performing Consumer Services sector stocks year to date are
Now, more recently, over last week, the top performing Consumer Services sector stocks on the move are


|
||||||||||||||||||||||||||||||||||||||||||||||||
| 12Stocks.com: Investing in Consumer Services Sector using Exchange Traded Funds | |
|
The following table shows list of key exchange traded funds (ETF) that
help investors track Consumer Services Index. For detailed view, check out our ETF Funds section of our website. Quick View: Move mouse or cursor over ETF symbol (ticker) to view short-term Technical chart and over ETF name to view long term chart. Click on ticker or stock name for detailed view. Click on to add stock symbol to your watchlist and to view watchlist. |
12Stocks.com List of ETFs that track Consumer Services Index
| Ticker | ETF Name | Watchlist | Recent Price | Smart Investing & Trading Score | Change % | Week % | Year-to-date % |
| XLY | Consumer Discret Sel | | 175.91 | 68 | 0.90 | 3.62 | -1.62% |
| RTH | Retail | | 201.08 | 56 | 1.22 | 1.23 | 6.83% |
| IYC | Consumer Services | | 78.36 | 43 | 0.63 | 2.74 | 3.42% |
| XRT | Retail | | 73.22 | 63 | 1.40 | 2.88 | 1.24% |
| IYK | Consumer Goods | | 66.82 | 68 | -0.24 | 1.53 | 4.56% |
| UCC | Consumer Services | | 33.88 | 80 | 1.89 | 7.3 | -5.65% |
| RETL | Retail Bull 3X | | 8.83 | 55 | 4.25 | 8.74 | -3.18% |
| RXI | Globl Consumer Discretionary | | 161.18 | 43 | 1.26 | 2.56 | 1.33% |
| SCC | Short Consumer Services | | 15.78 | 35 | -1.74 | -6.92 | 2.98% |
| UGE | Consumer Goods | | 17.17 | 90 | 0.29 | 3.26 | 9.08% |
| 12Stocks.com: Charts, Trends, Fundamental Data and Performances of Consumer Services Stocks | |
|
We now take in-depth look at all Consumer Services stocks including charts, multi-period performances and overall trends (as measured by Smart Investing & Trading Score). One can sort Consumer Services stocks (click link to choose) by Daily, Weekly and by Year-to-Date performances. Also, one can sort by size of the company or by market capitalization. |
| Select Your Default Chart Type: | |||||
| |||||
| Click on stock symbol or name for detailed view. Click on to add stock symbol to your watchlist and to view watchlist. Quick View: Move mouse or cursor over "Daily" to quickly view daily Technical stock chart and over "Weekly" to view weekly Technical stock chart. | |||||

 | ROL Rollins, Inc. |
| Sector: Services & Goods | |
| SubSector: Business Services | |
| MarketCap: 12827.4 Millions | |
| Recent Price: 44.90 Smart Investing & Trading Score: 75 | |
| Day Percent Change: 1.42% Day Change: 0.63 | |
| Week Change: 5.62% Year-to-date Change: 2.8% | |
| ROL Links: Profile News Message Board | |
| Charts:- Daily , Weekly | |
| Add ROL to Watchlist: View: Get Complete ROL Trend Analysis ➞ | |
 | STN Stantec Inc. |
| Sector: Services & Goods | |
| SubSector: Business Services | |
| MarketCap: 2855.92 Millions | |
| Recent Price: 81.84 Smart Investing & Trading Score: 75 | |
| Day Percent Change: 0.42% Day Change: 0.34 | |
| Week Change: 3.7% Year-to-date Change: 2.1% | |
| STN Links: Profile News Message Board | |
| Charts:- Daily , Weekly | |
| Add STN to Watchlist: View: Get Complete STN Trend Analysis ➞ | |
 | GPC Genuine Parts Company |
| Sector: Services & Goods | |
| SubSector: Auto Parts Stores | |
| MarketCap: 8605.9 Millions | |
| Recent Price: 159.93 Smart Investing & Trading Score: 75 | |
| Day Percent Change: -0.71% Day Change: -1.14 | |
| Week Change: -1.51% Year-to-date Change: 15.5% | |
| GPC Links: Profile News Message Board | |
| Charts:- Daily , Weekly | |
| Add GPC to Watchlist: View: Get Complete GPC Trend Analysis ➞ | |
 | DJCO Daily Journal Corporation |
| Sector: Services & Goods | |
| SubSector: Publishing - Newspapers | |
| MarketCap: 306.822 Millions | |
| Recent Price: 344.60 Smart Investing & Trading Score: 75 | |
| Day Percent Change: -0.69% Day Change: -2.40 | |
| Week Change: -0.97% Year-to-date Change: 1.1% | |
| DJCO Links: Profile News Message Board | |
| Charts:- Daily , Weekly | |
| Add DJCO to Watchlist: View: Get Complete DJCO Trend Analysis ➞ | |
 | HGV Hilton Grand Vacations Inc. |
| Sector: Services & Goods | |
| SubSector: Resorts & Casinos | |
| MarketCap: 1333.04 Millions | |
| Recent Price: 44.34 Smart Investing & Trading Score: 75 | |
| Day Percent Change: -0.16% Day Change: -0.07 | |
| Week Change: 2.62% Year-to-date Change: 10.4% | |
| HGV Links: Profile News Message Board | |
| Charts:- Daily , Weekly | |
| Add HGV to Watchlist: View: Get Complete HGV Trend Analysis ➞ | |
 | GME GameStop Corp. |
| Sector: Services & Goods | |
| SubSector: Electronics Stores | |
| MarketCap: 257.8 Millions | |
| Recent Price: 11.90 Smart Investing & Trading Score: 74 | |
| Day Percent Change: 6.16% Day Change: 0.69 | |
| Week Change: 14.2% Year-to-date Change: -32.1% | |
| GME Links: Profile News Message Board | |
| Charts:- Daily , Weekly | |
| Add GME to Watchlist: View: Get Complete GME Trend Analysis ➞ | |
 | ASPS Altisource Portfolio Solutions S.A. |
| Sector: Services & Goods | |
| SubSector: Business Services | |
| MarketCap: 120.382 Millions | |
| Recent Price: 1.97 Smart Investing & Trading Score: 74 | |
| Day Percent Change: 5.35% Day Change: 0.10 | |
| Week Change: 19.39% Year-to-date Change: -44.7% | |
| ASPS Links: Profile News Message Board | |
| Charts:- Daily , Weekly | |
| Add ASPS to Watchlist: View: Get Complete ASPS Trend Analysis ➞ | |
 | EXPO Exponent, Inc. |
| Sector: Services & Goods | |
| SubSector: Management Services | |
| MarketCap: 3605.95 Millions | |
| Recent Price: 95.14 Smart Investing & Trading Score: 74 | |
| Day Percent Change: 19.40% Day Change: 15.46 | |
| Week Change: 20.17% Year-to-date Change: 8.1% | |
| EXPO Links: Profile News Message Board | |
| Charts:- Daily , Weekly | |
| Add EXPO to Watchlist: View: Get Complete EXPO Trend Analysis ➞ | |
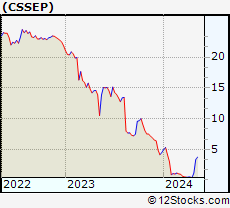 | CSSEP Chicken Soup for the Soul Entertainment, Inc. |
| Sector: Services & Goods | |
| SubSector: Broadcasting - TV | |
| MarketCap: 195.763 Millions | |
| Recent Price: 1.26 Smart Investing & Trading Score: 74 | |
| Day Percent Change: 1.58% Day Change: 0.02 | |
| Week Change: 214.9% Year-to-date Change: -72.0% | |
| CSSEP Links: Profile News Message Board | |
| Charts:- Daily , Weekly | |
| Add CSSEP to Watchlist: View: Get Complete CSSEP Trend Analysis ➞ | |
 | PLTK Playtika Holding Corp. |
| Sector: Services & Goods | |
| SubSector: Electronic Gaming & Multimedia | |
| MarketCap: 4260 Millions | |
| Recent Price: 7.15 Smart Investing & Trading Score: 74 | |
| Day Percent Change: 1.42% Day Change: 0.10 | |
| Week Change: 3.92% Year-to-date Change: -17.1% | |
| PLTK Links: Profile News Message Board | |
| Charts:- Daily , Weekly | |
| Add PLTK to Watchlist: View: Get Complete PLTK Trend Analysis ➞ | |
 | MED Medifast, Inc. |
| Sector: Services & Goods | |
| SubSector: Specialty Retail, Other | |
| MarketCap: 681.044 Millions | |
| Recent Price: 33.71 Smart Investing & Trading Score: 74 | |
| Day Percent Change: 0.63% Day Change: 0.21 | |
| Week Change: 3.91% Year-to-date Change: -49.9% | |
| MED Links: Profile News Message Board | |
| Charts:- Daily , Weekly | |
| Add MED to Watchlist: View: Get Complete MED Trend Analysis ➞ | |
 | SSP The E.W. Scripps Company |
| Sector: Services & Goods | |
| SubSector: Broadcasting - TV | |
| MarketCap: 766.163 Millions | |
| Recent Price: 3.71 Smart Investing & Trading Score: 74 | |
| Day Percent Change: 0.41% Day Change: 0.02 | |
| Week Change: 3.2% Year-to-date Change: -53.6% | |
| SSP Links: Profile News Message Board | |
| Charts:- Daily , Weekly | |
| Add SSP to Watchlist: View: Get Complete SSP Trend Analysis ➞ | |
 | DIN Dine Brands Global, Inc. |
| Sector: Services & Goods | |
| SubSector: Restaurants | |
| MarketCap: 421.17 Millions | |
| Recent Price: 45.17 Smart Investing & Trading Score: 74 | |
| Day Percent Change: -1.12% Day Change: -0.51 | |
| Week Change: 4.2% Year-to-date Change: -9.0% | |
| DIN Links: Profile News Message Board | |
| Charts:- Daily , Weekly | |
| Add DIN to Watchlist: View: Get Complete DIN Trend Analysis ➞ | |
 | ZUMZ Zumiez Inc. |
| Sector: Services & Goods | |
| SubSector: Specialty Retail, Other | |
| MarketCap: 526.244 Millions | |
| Recent Price: 16.93 Smart Investing & Trading Score: 74 | |
| Day Percent Change: -0.29% Day Change: -0.05 | |
| Week Change: 11.6% Year-to-date Change: -16.8% | |
| ZUMZ Links: Profile News Message Board | |
| Charts:- Daily , Weekly | |
| Add ZUMZ to Watchlist: View: Get Complete ZUMZ Trend Analysis ➞ | |
 | FWRG First Watch Restaurant Group, Inc. |
| Sector: Services & Goods | |
| SubSector: Restaurants | |
| MarketCap: 1000 Millions | |
| Recent Price: 23.64 Smart Investing & Trading Score: 73 | |
| Day Percent Change: 0.04% Day Change: 0.01 | |
| Week Change: 6.01% Year-to-date Change: 18.6% | |
| FWRG Links: Profile News Message Board | |
| Charts:- Daily , Weekly | |
| Add FWRG to Watchlist: View: Get Complete FWRG Trend Analysis ➞ | |
 | NCLH Norwegian Cruise Line Holdings Ltd. |
| Sector: Services & Goods | |
| SubSector: Resorts & Casinos | |
| MarketCap: 2895.54 Millions | |
| Recent Price: 19.04 Smart Investing & Trading Score: 73 | |
| Day Percent Change: -1.60% Day Change: -0.31 | |
| Week Change: 4.1% Year-to-date Change: -5.0% | |
| NCLH Links: Profile News Message Board | |
| Charts:- Daily , Weekly | |
| Add NCLH to Watchlist: View: Get Complete NCLH Trend Analysis ➞ | |
 | IHG InterContinental Hotels Group PLC |
| Sector: Services & Goods | |
| SubSector: Lodging | |
| MarketCap: 6387.46 Millions | |
| Recent Price: 100.93 Smart Investing & Trading Score: 73 | |
| Day Percent Change: 0.22% Day Change: 0.22 | |
| Week Change: 3.63% Year-to-date Change: 10.7% | |
| IHG Links: Profile News Message Board | |
| Charts:- Daily , Weekly | |
| Add IHG to Watchlist: View: Get Complete IHG Trend Analysis ➞ | |
 | BBSI Barrett Business Services, Inc. |
| Sector: Services & Goods | |
| SubSector: Staffing & Outsourcing Services | |
| MarketCap: 262.028 Millions | |
| Recent Price: 121.52 Smart Investing & Trading Score: 71 | |
| Day Percent Change: -1.29% Day Change: -1.59 | |
| Week Change: -0.68% Year-to-date Change: 4.9% | |
| BBSI Links: Profile News Message Board | |
| Charts:- Daily , Weekly | |
| Add BBSI to Watchlist: View: Get Complete BBSI Trend Analysis ➞ | |
 | WISH ContextLogic Inc. |
| Sector: Services & Goods | |
| SubSector: Internet Retail | |
| MarketCap: 165 Millions | |
| Recent Price: 5.70 Smart Investing & Trading Score: 71 | |
| Day Percent Change: -0.18% Day Change: -0.01 | |
| Week Change: -2.4% Year-to-date Change: -4.1% | |
| WISH Links: Profile News Message Board | |
| Charts:- Daily , Weekly | |
| Add WISH to Watchlist: View: Get Complete WISH Trend Analysis ➞ | |
 | WMT Walmart Inc. |
| Sector: Services & Goods | |
| SubSector: Discount, Variety Stores | |
| MarketCap: 355610 Millions | |
| Recent Price: 60.16 Smart Investing & Trading Score: 71 | |
| Day Percent Change: -0.08% Day Change: -0.05 | |
| Week Change: 1.06% Year-to-date Change: 14.5% | |
| WMT Links: Profile News Message Board | |
| Charts:- Daily , Weekly | |
| Add WMT to Watchlist: View: Get Complete WMT Trend Analysis ➞ | |
 | SHAK Shake Shack Inc. |
| Sector: Services & Goods | |
| SubSector: Specialty Eateries | |
| MarketCap: 1497.67 Millions | |
| Recent Price: 104.88 Smart Investing & Trading Score: 70 | |
| Day Percent Change: 3.45% Day Change: 3.50 | |
| Week Change: 11.1% Year-to-date Change: 41.5% | |
| SHAK Links: Profile News Message Board | |
| Charts:- Daily , Weekly | |
| Add SHAK to Watchlist: View: Get Complete SHAK Trend Analysis ➞ | |
 | JMIA Jumia Technologies AG |
| Sector: Services & Goods | |
| SubSector: Specialty Retail, Other | |
| MarketCap: 203.644 Millions | |
| Recent Price: 4.54 Smart Investing & Trading Score: 70 | |
| Day Percent Change: 2.95% Day Change: 0.13 | |
| Week Change: 15.23% Year-to-date Change: 28.6% | |
| JMIA Links: Profile News Message Board | |
| Charts:- Daily , Weekly | |
| Add JMIA to Watchlist: View: Get Complete JMIA Trend Analysis ➞ | |
 | PDD Pinduoduo Inc. |
| Sector: Services & Goods | |
| SubSector: Specialty Retail, Other | |
| MarketCap: 41696.2 Millions | |
| Recent Price: 129.30 Smart Investing & Trading Score: 70 | |
| Day Percent Change: 2.74% Day Change: 3.45 | |
| Week Change: 13.93% Year-to-date Change: -11.6% | |
| PDD Links: Profile News Message Board | |
| Charts:- Daily , Weekly | |
| Add PDD to Watchlist: View: Get Complete PDD Trend Analysis ➞ | |
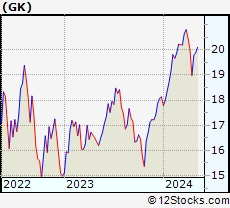 | GK G&K Services, Inc. |
| Sector: Services & Goods | |
| SubSector: Personal Services | |
| MarketCap: 1861.21 Millions | |
| Recent Price: 19.79 Smart Investing & Trading Score: 70 | |
| Day Percent Change: 1.98% Day Change: 0.39 | |
| Week Change: 4.22% Year-to-date Change: 9.1% | |
| GK Links: Profile News Message Board | |
| Charts:- Daily , Weekly | |
| Add GK to Watchlist: View: Get Complete GK Trend Analysis ➞ | |
 | H Hyatt Hotels Corporation |
| Sector: Services & Goods | |
| SubSector: Lodging | |
| MarketCap: 5525.56 Millions | |
| Recent Price: 151.32 Smart Investing & Trading Score: 70 | |
| Day Percent Change: 0.04% Day Change: 0.06 | |
| Week Change: 3.38% Year-to-date Change: 16.0% | |
| H Links: Profile News Message Board | |
| Charts:- Daily , Weekly | |
| Add H to Watchlist: View: Get Complete H Trend Analysis ➞ | |
| For tabular summary view of above stock list: Summary View ➞ 0 - 25 , 25 - 50 , 50 - 75 , 75 - 100 , 100 - 125 , 125 - 150 , 150 - 175 , 175 - 200 , 200 - 225 , 225 - 250 , 250 - 275 , 275 - 300 , 300 - 325 , 325 - 350 , 350 - 375 , 375 - 400 , 400 - 425 , 425 - 450 , 450 - 475 | ||
| Click To Change The Sort Order: By Market Cap or Company Size Performance: Year-to-date, Week and Day | |
| Select Chart Type: | ||
|
Best Stocks Today 12Stocks.com |
© 2024 12Stocks.com Terms & Conditions Privacy Contact Us
All Information Provided Only For Education And Not To Be Used For Investing or Trading. See Terms & Conditions


One More Thing ... Get Best Stocks Delivered Daily!
Never Ever Miss A Move With Our Top Ten Stocks Lists
Find Best Stocks In Any Market - Bull or Bear Market
Take A Peek At Our Top Ten Stocks Lists: Daily, Weekly, Year-to-Date & Top Trends
Find Best Stocks In Any Market - Bull or Bear Market
Take A Peek At Our Top Ten Stocks Lists: Daily, Weekly, Year-to-Date & Top Trends
Consumer Services Stocks With Best Up Trends [0-bearish to 100-bullish]: CAVA [100], Yatsen Holding[100], MINISO [100], Reservoir Media[100], AutoNation [100], Pactiv Evergreen[100], Gaia [100], Tractor Supply[100], Chipotle Mexican[100], Dada Nexus[100], Cheesecake Factory[100]
Best Consumer Services Stocks Year-to-Date:
U Power[2779.46%], Vroom [1804.53%], Yatsen Holding[558.83%], Fluent [337.31%], Codere Online[130.82%], Sweetgreen [116.99%], Research[106.23%], RealReal [78.11%], Carvana Co[59.26%], CAVA [59.06%], PaySign [57.5%] Best Consumer Services Stocks This Week:
Chicken Soup[214.9%], Yatsen Holding[33.33%], Sonic Automotive[28.14%], ATRenew [25.32%], Strategic Education[23.32%], Hibbett Sports[21.05%], Exponent [20.17%], Baozun [19.4%], Altisource Portfolio[19.39%], Golden Heaven[19.11%], Qurate Retail[18.83%] Best Consumer Services Stocks Daily:
ATRenew [22.98%], Exponent [19.40%], XPeng [12.38%], CAVA [10.50%], Sonic Automotive[9.93%], Fluent [9.74%], Yatsen Holding[9.30%], Kratos Defense[9.09%], WW [9.03%], Carvana Co[8.79%], Qurate Retail[8.74%]