
 Login Sign Up


| |||||
 |  | ||||

| 12Stocks.com Market Intelligence |
Best China Stocks
|
On this page, you will find the most comprehensive analysis of Chinese stocks and ETFs - from latest trends to performances to charts ➞. First, here are the year-to-date (YTD) performances of the most requested China stocks at 12Stocks.com (click stock for review):
| Sohu.com 17% | ||
| New Oriental 12% | ||
| NetEase 4% | ||
| JD.com 3% | ||
| Alibaba -1% | ||
| Vipshop -11% | ||
| Baidu -11% | ||
| JOYY -16% | ||
| Weibo -19% | ||
| In a hurry? China Stocks Lists: Performance Trends Table, Stock Charts
Sort China stocks: Daily, Weekly, Year-to-Date, Market Cap & Trends. Filter China stocks list by sector: Show all, Tech, Finance, Energy, Staples, Retail, Industrial, Materials, Utilities and HealthCare Filter China stocks list by size: All China Large Medium Small and MicroCap |
| April 30, 2024 - 12Stocks.com China Stocks Performances & Trends Daily | |||||||||
|
|  The overall Smart Investing & Trading Score is 100 (0-bearish to 100-bullish) which puts China index in short term bullish trend. The Smart Investing & Trading Score from previous trading session is 74 and an improvement of trend continues.
| ||||||||
| Here are the Smart Investing & Trading Scores of the most requested China stocks at 12Stocks.com (click stock name for detailed review): |


| 12Stocks.com: Top Performing China Index Stocks | ||||||||||||||||||||||||||||||||||||||||||||||||
 The top performing China Index stocks year to date are
Now, more recently, over last week, the top performing China Index stocks on the move are


|
||||||||||||||||||||||||||||||||||||||||||||||||
| 12Stocks.com: Investing in China Index with Stocks | |
|
The following table helps investors and traders sort through current performance and trends (as measured by Smart Investing & Trading Score) of various
stocks in the China Index. Quick View: Move mouse or cursor over stock symbol (ticker) to view short-term technical chart and over stock name to view long term chart. Click on  to add stock symbol to your watchlist and to add stock symbol to your watchlist and  to view watchlist. Click on any ticker or stock name for detailed market intelligence report for that stock. to view watchlist. Click on any ticker or stock name for detailed market intelligence report for that stock. |
12Stocks.com Performance of Stocks in China Index
| Ticker | Stock Name | Watchlist | Category | Recent Price | Smart Investing & Trading Score | Change % | YTD Change% |
| JD | JD.com |   | Technology | 29.89 | 93 | -1.48 | 3.46% |
| BNR | Burning Rock | | Health Care | 0.84 | 30 | -1.59 | -13.31% |
| HTHT | Huazhu | | Services & Goods | 39.42 | 76 | -1.60 | 17.88% |
| PDD | Pinduoduo | | Services & Goods | 126.97 | 52 | -1.81 | -13.22% |
| HOLO | MicroCloud Hologram | | Technology | 2.45 | 61 | -2.00 | 605.04% |
| MNSO | MINISO | | Services & Goods | 23.14 | 86 | -2.07 | 13.43% |
| CNF | CNFinance | | Financials | 1.83 | 27 | -2.14 | -17.57% |
| EBON | Ebang | | Technology | 7.60 | 20 | -2.63 | -50.25% |
| NOAH | Noah | | Financials | 12.38 | 80 | -2.67 | -10.35% |
| JFIN | Jiayin | | Technology | 6.45 | 73 | -2.86 | 24.52% |
| GDHG | Golden Heaven | | Services & Goods | 0.28 | 42 | -2.89 | -62.21% |
| TCOM | Trip.com | | Services & Goods | 49.10 | 51 | -2.95 | 36.36% |
| ATIF | ATIF | | Financials | 0.91 | 46 | -3.15 | -6.20% |
| LU | Lufax Holding | | Financials | 4.53 | 51 | -3.21 | 47.56% |
| OCFT | OneConnect Financial | | Technology | 1.93 | 35 | -3.50 | -38.73% |
| ATAT | Atour Lifestyle | | Services & Goods | 18.00 | 48 | -3.59 | 2.74% |
| GCT | GigaCloud | | Technology | 33.98 | 44 | -3.88 | 85.58% |
| TOP | TOP Financial | | Financials | 2.56 | 15 | -4.12 | -31.18% |
| BQ | Boqii Holding | | Services & Goods | 0.29 | 50 | -4.26 | -35.96% |
| HYW | Hywin | | Financials | 0.81 | 28 | -4.41 | -56.22% |
| LANV | Lanvin | | Services & Goods | 1.51 | 20 | -4.43 | -50.65% |
| SRL | Scully Royalty | | Financials | 6.45 | 47 | -4.73 | 5.74% |
| CMCM | Cheetah Mobile | | Technology | 4.04 | 61 | -5.16 | 77.19% |
| EDTK | Skillful Craftsman | | Consumer Staples | 0.90 | 40 | -5.25 | -28.57% |
| STG | Sunlands | | Services & Goods | 7.51 | 10 | -5.59 | -26.16% |
| For chart view version of above stock list: Chart View ➞ 0 - 25 , 25 - 50 , 50 - 75 , 75 - 100 , 100 - 125 , 125 - 150 | ||
 | Click To Change The Sort Order: By Market Cap or Company Size Performance: Year-to-date, Week and Day |  |
|
Get the most comprehensive stock market coverage daily at 12Stocks.com ➞ Best Stocks Today ➞ Best Stocks Weekly ➞ Best Stocks Year-to-Date ➞ Best Stocks Trends ➞  Best Stocks Today 12Stocks.com Best Nasdaq Stocks ➞ Best S&P 500 Stocks ➞ Best Tech Stocks ➞ Best Biotech Stocks ➞ |
| Detailed Overview of China Stocks |
| China Technical Overview, Leaders & Laggards, Top China ETF Funds & Detailed China Stocks List, Charts, Trends & More |
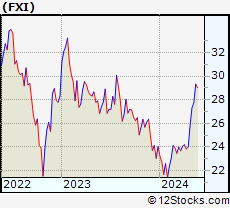
| China: Technical Analysis, Trends & YTD Performance | |
 FXI Weekly Chart |
|
| Long Term Trend: Very Good | |
| Medium Term Trend: Very Good | |
 FXI Daily Chart |
|
| Short Term Trend: Very Good | |
| Overall Trend Score: 100 | |
| YTD Performance: 8.66% | |
| **Trend Scores & Views Are Only For Educational Purposes And Not For Investing | |
| 12Stocks.com: Investing in China Index using Exchange Traded Funds | |
|
The following table shows list of key exchange traded funds (ETF) that
help investors play China stock market. For detailed view, check out our ETF Funds section of our website. Quick View: Move mouse or cursor over ETF symbol (ticker) to view short-term technical chart and over ETF name to view long term chart. Click on ticker or stock name for detailed view. Click on to add stock symbol to your watchlist and to view watchlist. |
12Stocks.com List of ETFs that track China Index
| Ticker | ETF Name | Watchlist | Recent Price | Smart Investing & Trading Score | Change % | Week % | Year-to-date % |
| FXI | China Large-Cap | | 26.11 | 100 | 0.93 | 0.93 | 8.66% |
| EWH | Hong Kong | | 16.24 | 100 | 1.63 | 1.63 | -6.51% |
| YINN | China Bull 3X | | 23.77 | 100 | 2.41 | 2.41 | 13.51% |
| YANG | China Bear 3X | | 9.09 | 0 | -2.68 | -2.68 | -28.98% |
| XPP | China 50 | | 15.21 | 100 | 1.20 | 1.2 | 10.66% |
| MCHI | China | | 42.77 | 100 | 0.99 | 0.99 | 4.98% |
| GXC | China | | 70.10 | 100 | 0.95 | 0.95 | 2.91% |
| CBON | ChinaAMC China Bond | | 21.86 | 18 | 0.11 | 0.11 | -1.07% |
| 12Stocks.com: Charts, Trends, Fundamental Data and Performances of China Stocks | |
|
We now take in-depth look at all China stocks including charts, multi-period performances and overall trends (as measured by Smart Investing & Trading Score). One can sort China stocks (click link to choose) by Daily, Weekly and by Year-to-Date performances. Also, one can sort by size of the company or by market capitalization. |
| Select Your Default Chart Type: | |||||
| |||||
| Click on stock symbol or name for detailed view. Click on to add stock symbol to your watchlist and to view watchlist. Quick View: Move mouse or cursor over "Daily" to quickly view daily technical stock chart and over "Weekly" to view weekly technical stock chart. | |||||

 | JD JD.com, Inc. |
| Sector: Technology | |
| SubSector: Internet Information Providers | |
| MarketCap: 59907.3 Millions | |
| Recent Price: 29.89 Smart Investing & Trading Score: 93 | |
| Day Percent Change: -1.48% Day Change: -0.45 | |
| Week Change: -1.48% Year-to-date Change: 3.5% | |
| JD Links: Profile News Message Board | |
| Charts:- Daily , Weekly | |
| Add JD to Watchlist: View: Get Complete JD Trend Analysis ➞ | |
 | BNR Burning Rock Biotech Limited |
| Sector: Health Care | |
| SubSector: Diagnostics & Research | |
| MarketCap: 27887 Millions | |
| Recent Price: 0.84 Smart Investing & Trading Score: 30 | |
| Day Percent Change: -1.59% Day Change: -0.01 | |
| Week Change: -1.59% Year-to-date Change: -13.3% | |
| BNR Links: Profile News Message Board | |
| Charts:- Daily , Weekly | |
| Add BNR to Watchlist: View: Get Complete BNR Trend Analysis ➞ | |
 | HTHT Huazhu Group Limited |
| Sector: Services & Goods | |
| SubSector: Lodging | |
| MarketCap: 9164.46 Millions | |
| Recent Price: 39.42 Smart Investing & Trading Score: 76 | |
| Day Percent Change: -1.60% Day Change: -0.64 | |
| Week Change: -1.6% Year-to-date Change: 17.9% | |
| HTHT Links: Profile News Message Board | |
| Charts:- Daily , Weekly | |
| Add HTHT to Watchlist: View: Get Complete HTHT Trend Analysis ➞ | |
 | PDD Pinduoduo Inc. |
| Sector: Services & Goods | |
| SubSector: Specialty Retail, Other | |
| MarketCap: 41696.2 Millions | |
| Recent Price: 126.97 Smart Investing & Trading Score: 52 | |
| Day Percent Change: -1.81% Day Change: -2.34 | |
| Week Change: -1.81% Year-to-date Change: -13.2% | |
| PDD Links: Profile News Message Board | |
| Charts:- Daily , Weekly | |
| Add PDD to Watchlist: View: Get Complete PDD Trend Analysis ➞ | |
 | HOLO MicroCloud Hologram Inc. |
| Sector: Technology | |
| SubSector: Electronic Components | |
| MarketCap: 159 Millions | |
| Recent Price: 2.45 Smart Investing & Trading Score: 61 | |
| Day Percent Change: -2.00% Day Change: -0.05 | |
| Week Change: -2% Year-to-date Change: 605.0% | |
| HOLO Links: Profile News Message Board | |
| Charts:- Daily , Weekly | |
| Add HOLO to Watchlist: View: Get Complete HOLO Trend Analysis ➞ | |
 | MNSO MINISO Group Holding Limited |
| Sector: Services & Goods | |
| SubSector: Specialty Retail | |
| MarketCap: 69427 Millions | |
| Recent Price: 23.14 Smart Investing & Trading Score: 86 | |
| Day Percent Change: -2.07% Day Change: -0.49 | |
| Week Change: -2.07% Year-to-date Change: 13.4% | |
| MNSO Links: Profile News Message Board | |
| Charts:- Daily , Weekly | |
| Add MNSO to Watchlist: View: Get Complete MNSO Trend Analysis ➞ | |
 | CNF CNFinance Holdings Limited |
| Sector: Financials | |
| SubSector: Credit Services | |
| MarketCap: 277.408 Millions | |
| Recent Price: 1.83 Smart Investing & Trading Score: 27 | |
| Day Percent Change: -2.14% Day Change: -0.04 | |
| Week Change: -2.14% Year-to-date Change: -17.6% | |
| CNF Links: Profile News Message Board | |
| Charts:- Daily , Weekly | |
| Add CNF to Watchlist: View: Get Complete CNF Trend Analysis ➞ | |
 | EBON Ebang International Holdings Inc. |
| Sector: Technology | |
| SubSector: Computer Hardware | |
| MarketCap: 33787 Millions | |
| Recent Price: 7.60 Smart Investing & Trading Score: 20 | |
| Day Percent Change: -2.63% Day Change: -0.21 | |
| Week Change: -2.63% Year-to-date Change: -50.3% | |
| EBON Links: Profile News Message Board | |
| Charts:- Daily , Weekly | |
| Add EBON to Watchlist: View: Get Complete EBON Trend Analysis ➞ | |
 | NOAH Noah Holdings Limited |
| Sector: Financials | |
| SubSector: Asset Management | |
| MarketCap: 1495.33 Millions | |
| Recent Price: 12.38 Smart Investing & Trading Score: 80 | |
| Day Percent Change: -2.67% Day Change: -0.34 | |
| Week Change: -2.67% Year-to-date Change: -10.4% | |
| NOAH Links: Profile News Message Board | |
| Charts:- Daily , Weekly | |
| Add NOAH to Watchlist: View: Get Complete NOAH Trend Analysis ➞ | |
 | JFIN Jiayin Group Inc. |
| Sector: Technology | |
| SubSector: Internet Information Providers | |
| MarketCap: 131.48 Millions | |
| Recent Price: 6.45 Smart Investing & Trading Score: 73 | |
| Day Percent Change: -2.86% Day Change: -0.19 | |
| Week Change: -2.86% Year-to-date Change: 24.5% | |
| JFIN Links: Profile News Message Board | |
| Charts:- Daily , Weekly | |
| Add JFIN to Watchlist: View: Get Complete JFIN Trend Analysis ➞ | |
 | GDHG Golden Heaven Group Holdings Ltd. |
| Sector: Services & Goods | |
| SubSector: Leisure | |
| MarketCap: 230 Millions | |
| Recent Price: 0.28 Smart Investing & Trading Score: 42 | |
| Day Percent Change: -2.89% Day Change: -0.01 | |
| Week Change: -2.89% Year-to-date Change: -62.2% | |
| GDHG Links: Profile News Message Board | |
| Charts:- Daily , Weekly | |
| Add GDHG to Watchlist: View: Get Complete GDHG Trend Analysis ➞ | |
 | TCOM Trip.com Group Limited |
| Sector: Services & Goods | |
| SubSector: Lodging | |
| MarketCap: 13449.6 Millions | |
| Recent Price: 49.10 Smart Investing & Trading Score: 51 | |
| Day Percent Change: -2.95% Day Change: -1.50 | |
| Week Change: -2.95% Year-to-date Change: 36.4% | |
| TCOM Links: Profile News Message Board | |
| Charts:- Daily , Weekly | |
| Add TCOM to Watchlist: View: Get Complete TCOM Trend Analysis ➞ | |
 | ATIF ATIF Holdings Limited |
| Sector: Financials | |
| SubSector: Asset Management | |
| MarketCap: 68.5203 Millions | |
| Recent Price: 0.91 Smart Investing & Trading Score: 46 | |
| Day Percent Change: -3.15% Day Change: -0.03 | |
| Week Change: -3.15% Year-to-date Change: -6.2% | |
| ATIF Links: Profile News Message Board | |
| Charts:- Daily , Weekly | |
| Add ATIF to Watchlist: View: Get Complete ATIF Trend Analysis ➞ | |
 | LU Lufax Holding Ltd |
| Sector: Financials | |
| SubSector: Credit Services | |
| MarketCap: 33457 Millions | |
| Recent Price: 4.53 Smart Investing & Trading Score: 51 | |
| Day Percent Change: -3.21% Day Change: -0.15 | |
| Week Change: -3.21% Year-to-date Change: 47.6% | |
| LU Links: Profile News Message Board | |
| Charts:- Daily , Weekly | |
| Add LU to Watchlist: View: Get Complete LU Trend Analysis ➞ | |
 | OCFT OneConnect Financial Technology Co., Ltd. |
| Sector: Technology | |
| SubSector: Software Application | |
| MarketCap: 80387 Millions | |
| Recent Price: 1.93 Smart Investing & Trading Score: 35 | |
| Day Percent Change: -3.50% Day Change: -0.07 | |
| Week Change: -3.5% Year-to-date Change: -38.7% | |
| OCFT Links: Profile News Message Board | |
| Charts:- Daily , Weekly | |
| Add OCFT to Watchlist: View: Get Complete OCFT Trend Analysis ➞ | |
 | ATAT Atour Lifestyle Holdings Limited |
| Sector: Services & Goods | |
| SubSector: Lodging | |
| MarketCap: 2120 Millions | |
| Recent Price: 18.00 Smart Investing & Trading Score: 48 | |
| Day Percent Change: -3.59% Day Change: -0.67 | |
| Week Change: -3.59% Year-to-date Change: 2.7% | |
| ATAT Links: Profile News Message Board | |
| Charts:- Daily , Weekly | |
| Add ATAT to Watchlist: View: Get Complete ATAT Trend Analysis ➞ | |
 | GCT GigaCloud Technology Inc. |
| Sector: Technology | |
| SubSector: Software - Infrastructure | |
| MarketCap: 240 Millions | |
| Recent Price: 33.98 Smart Investing & Trading Score: 44 | |
| Day Percent Change: -3.88% Day Change: -1.37 | |
| Week Change: -3.88% Year-to-date Change: 85.6% | |
| GCT Links: Profile News Message Board | |
| Charts:- Daily , Weekly | |
| Add GCT to Watchlist: View: Get Complete GCT Trend Analysis ➞ | |
 | TOP TOP Financial Group Limited |
| Sector: Financials | |
| SubSector: Capital Markets | |
| MarketCap: 329 Millions | |
| Recent Price: 2.56 Smart Investing & Trading Score: 15 | |
| Day Percent Change: -4.12% Day Change: -0.11 | |
| Week Change: -4.12% Year-to-date Change: -31.2% | |
| TOP Links: Profile News Message Board | |
| Charts:- Daily , Weekly | |
| Add TOP to Watchlist: View: Get Complete TOP Trend Analysis ➞ | |
 | BQ Boqii Holding Limited |
| Sector: Services & Goods | |
| SubSector: Specialty Retail | |
| MarketCap: 33027 Millions | |
| Recent Price: 0.29 Smart Investing & Trading Score: 50 | |
| Day Percent Change: -4.26% Day Change: -0.01 | |
| Week Change: -4.26% Year-to-date Change: -36.0% | |
| BQ Links: Profile News Message Board | |
| Charts:- Daily , Weekly | |
| Add BQ to Watchlist: View: Get Complete BQ Trend Analysis ➞ | |
 | HYW Hywin Holdings Ltd. |
| Sector: Financials | |
| SubSector: Asset Management | |
| MarketCap: 161 Millions | |
| Recent Price: 0.81 Smart Investing & Trading Score: 28 | |
| Day Percent Change: -4.41% Day Change: -0.04 | |
| Week Change: -4.41% Year-to-date Change: -56.2% | |
| HYW Links: Profile News Message Board | |
| Charts:- Daily , Weekly | |
| Add HYW to Watchlist: View: Get Complete HYW Trend Analysis ➞ | |
 | LANV Lanvin Group Holdings Limited |
| Sector: Services & Goods | |
| SubSector: Luxury Goods | |
| MarketCap: 712 Millions | |
| Recent Price: 1.51 Smart Investing & Trading Score: 20 | |
| Day Percent Change: -4.43% Day Change: -0.07 | |
| Week Change: -4.43% Year-to-date Change: -50.7% | |
| LANV Links: Profile News Message Board | |
| Charts:- Daily , Weekly | |
| Add LANV to Watchlist: View: Get Complete LANV Trend Analysis ➞ | |
 | SRL Scully Royalty Ltd. |
| Sector: Financials | |
| SubSector: Asset Management | |
| MarketCap: 88.3203 Millions | |
| Recent Price: 6.45 Smart Investing & Trading Score: 47 | |
| Day Percent Change: -4.73% Day Change: -0.32 | |
| Week Change: -4.73% Year-to-date Change: 5.7% | |
| SRL Links: Profile News Message Board | |
| Charts:- Daily , Weekly | |
| Add SRL to Watchlist: View: Get Complete SRL Trend Analysis ➞ | |
 | CMCM Cheetah Mobile Inc. |
| Sector: Technology | |
| SubSector: Application Software | |
| MarketCap: 343.362 Millions | |
| Recent Price: 4.04 Smart Investing & Trading Score: 61 | |
| Day Percent Change: -5.16% Day Change: -0.22 | |
| Week Change: -5.16% Year-to-date Change: 77.2% | |
| CMCM Links: Profile News Message Board | |
| Charts:- Daily , Weekly | |
| Add CMCM to Watchlist: View: Get Complete CMCM Trend Analysis ➞ | |
 | EDTK Skillful Craftsman Education Technology Limited |
| Sector: Consumer Staples | |
| SubSector: Education & Training Services | |
| MarketCap: 32347 Millions | |
| Recent Price: 0.90 Smart Investing & Trading Score: 40 | |
| Day Percent Change: -5.25% Day Change: -0.05 | |
| Week Change: -5.25% Year-to-date Change: -28.6% | |
| EDTK Links: Profile News Message Board | |
| Charts:- Daily , Weekly | |
| Add EDTK to Watchlist: View: Get Complete EDTK Trend Analysis ➞ | |
 | STG Sunlands Technology Group |
| Sector: Services & Goods | |
| SubSector: Education & Training Services | |
| MarketCap: 295.706 Millions | |
| Recent Price: 7.51 Smart Investing & Trading Score: 10 | |
| Day Percent Change: -5.59% Day Change: -0.45 | |
| Week Change: -5.59% Year-to-date Change: -26.2% | |
| STG Links: Profile News Message Board | |
| Charts:- Daily , Weekly | |
| Add STG to Watchlist: View: Get Complete STG Trend Analysis ➞ | |
| For tabular summary view of above stock list: Summary View ➞ 0 - 25 , 25 - 50 , 50 - 75 , 75 - 100 , 100 - 125 , 125 - 150 | ||
| Click To Change The Sort Order: By Market Cap or Company Size Performance: Year-to-date, Week and Day | |
| Select Chart Type: | ||
|
Best Stocks Today 12Stocks.com |
© 2024 12Stocks.com Terms & Conditions Privacy Contact Us
All Information Provided Only For Education And Not To Be Used For Investing or Trading. See Terms & Conditions


One More Thing ... Get Best Stocks Delivered Daily!
Never Ever Miss A Move With Our Top Ten Stocks Lists
Find Best Stocks In Any Market - Bull or Bear Market
Take A Peek At Our Top Ten Stocks Lists: Daily, Weekly, Year-to-Date & Top Trends
Find Best Stocks In Any Market - Bull or Bear Market
Take A Peek At Our Top Ten Stocks Lists: Daily, Weekly, Year-to-Date & Top Trends
China Stocks With Best Up Trends [0-bearish to 100-bullish]: GDS [100], Baidu [100], Hutchison China[100], BeiGene [100], Bilibili [100], Niu [100], Alibaba [100], Yum China[100], Full Truck[100], iQIYI [100], 21Vianet [95]
Best China Stocks Year-to-Date:
U Power[2997.1%], DouYu [805.26%], MicroCloud Hologram[605.04%], China Liberal[524.72%], Yatsen Holding[513.72%], Zhongchao [368.36%], Uxin [162.48%], QuantaSing [109.26%], GigaCloud [85.58%], Cheetah Mobile[77.19%], Yiren Digital[60.9%] Best China Stocks This Week:
Lixiang Education[28.05%], SunCar [14.33%], uCloudlink [12.41%], Viomi [11.66%], GDS [9.54%], Studio City[8.92%], 21Vianet [8.86%], U Power[8.4%], Hesai [7.84%], Li Auto[7.63%], Dingdong (Cayman)[6.35%] Best China Stocks Daily:
Lixiang Education[28.05%], SunCar [14.33%], uCloudlink [12.41%], Viomi [11.66%], GDS [9.54%], Studio City[8.92%], 21Vianet [8.86%], U Power[8.40%], Hesai [7.84%], Li Auto[7.63%], Dingdong (Cayman)[6.35%]