
 Login Sign Up


| |||||
 |  | ||||

| 12Stocks.com Market Intelligence |
Best China Stocks
|
On this page, you will find the most comprehensive analysis of Chinese stocks and ETFs - from latest trends to performances to charts ➞. First, here are the year-to-date (YTD) performances of the most requested China stocks at 12Stocks.com (click stock for review):
| New Oriental 20% | ||
| Sohu.com 12% | ||
| NetEase 2% | ||
| JD.com -7% | ||
| Alibaba -9% | ||
| Vipshop -12% | ||
| JOYY -17% | ||
| Baidu -18% | ||
| Weibo -26% | ||
| In a hurry? China Stocks Lists: Performance Trends Table, Stock Charts
Sort China stocks: Daily, Weekly, Year-to-Date, Market Cap & Trends. Filter China stocks list by sector: Show all, Tech, Finance, Energy, Staples, Retail, Industrial, Materials, Utilities and HealthCare Filter China stocks list by size: All China Large Medium Small and MicroCap |
| April 23, 2024 - 12Stocks.com China Stocks Performances & Trends Daily | |||||||||
|
|  The overall Smart Investing & Trading Score is 100 (0-bearish to 100-bullish) which puts China index in short term bullish trend. The Smart Investing & Trading Score from previous trading session is 74 and hence an improvement of trend.
| ||||||||
| Here are the Smart Investing & Trading Scores of the most requested China stocks at 12Stocks.com (click stock name for detailed review): |

| 12Stocks.com: Top Performing China Index Stocks | ||||||||||||||||||||||||||||||||||||||||||||||||
 The top performing China Index stocks year to date are
Now, more recently, over last week, the top performing China Index stocks on the move are


|
||||||||||||||||||||||||||||||||||||||||||||||||
| 12Stocks.com: Investing in China Index with Stocks | |
|
The following table helps investors and traders sort through current performance and trends (as measured by Smart Investing & Trading Score) of various
stocks in the China Index. Quick View: Move mouse or cursor over stock symbol (ticker) to view short-term technical chart and over stock name to view long term chart. Click on  to add stock symbol to your watchlist and to add stock symbol to your watchlist and  to view watchlist. Click on any ticker or stock name for detailed market intelligence report for that stock. to view watchlist. Click on any ticker or stock name for detailed market intelligence report for that stock. |
12Stocks.com Performance of Stocks in China Index
| Ticker | Stock Name | Watchlist | Category | Recent Price | Smart Investing & Trading Score | Change % | YTD Change% |
| HUIZ | Huize Holding |   | Financials | 0.63 | 57 | 2.06 | -30.03% |
| SDA | SunCar | | Services & Goods | 7.23 | 35 | 1.97 | -6.95% |
| YMM | Full Truck | | Technology | 7.92 | 100 | 1.93 | 13.22% |
| YY | JOYY | | Technology | 32.80 | 73 | 1.77 | -17.38% |
| HSAI | Hesai | | Services & Goods | 4.04 | 30 | 1.76 | -55.51% |
| TOP | TOP Financial | | Financials | 2.39 | 42 | 1.70 | -35.75% |
| ATHM | Autohome | | Technology | 24.69 | 32 | 1.69 | -12.01% |
| API | Agora | | Technology | 2.45 | 49 | 1.66 | -7.20% |
| QFIN | 360 Finance | | Financials | 18.29 | 68 | 1.61 | 15.61% |
| ATAT | Atour Lifestyle | | Services & Goods | 17.50 | 58 | 1.51 | -0.11% |
| NTES | NetEase | | Technology | 94.88 | 49 | 1.47 | 1.85% |
| LX | LexinFintech | | Financials | 1.65 | 32 | 1.23 | -10.33% |
| JKS | JinkoSolar Holding | | Technology | 21.82 | 38 | 1.21 | -40.93% |
| BGNE | BeiGene | | Health Care | 130.94 | 25 | 1.10 | -27.40% |
| SOHU | Sohu.com | | Technology | 11.08 | 68 | 1.00 | 11.58% |
| PT | Pintec | | Technology | 1.08 | 7 | 0.93 | -2.70% |
| LU | Lufax Holding | | Financials | 4.39 | 90 | 0.92 | 43.00% |
| THCH | TH | | Services & Goods | 1.24 | 60 | 0.81 | -28.74% |
| DQ | Daqo New | | Technology | 22.29 | 54 | 0.81 | -16.20% |
| ZTO | ZTO Express | | Transports | 20.10 | 75 | 0.80 | -5.55% |
| DADA | Dada Nexus | | Services & Goods | 1.90 | 73 | 0.80 | -42.77% |
| EM | Smart Share | | Services & Goods | 0.65 | 71 | 0.78 | 25.24% |
| LANV | Lanvin | | Services & Goods | 1.60 | 67 | 0.63 | -47.71% |
| DAO | Youdao | | Technology | 3.57 | 31 | 0.56 | -9.39% |
| CNF | CNFinance | | Financials | 1.85 | 10 | 0.54 | -16.67% |
| For chart view version of above stock list: Chart View ➞ 0 - 25 , 25 - 50 , 50 - 75 , 75 - 100 , 100 - 125 , 125 - 150 | ||
 | Click To Change The Sort Order: By Market Cap or Company Size Performance: Year-to-date, Week and Day |  |
|
Get the most comprehensive stock market coverage daily at 12Stocks.com ➞ Best Stocks Today ➞ Best Stocks Weekly ➞ Best Stocks Year-to-Date ➞ Best Stocks Trends ➞  Best Stocks Today 12Stocks.com Best Nasdaq Stocks ➞ Best S&P 500 Stocks ➞ Best Tech Stocks ➞ Best Biotech Stocks ➞ |
| Detailed Overview of China Stocks |
| China Technical Overview, Leaders & Laggards, Top China ETF Funds & Detailed China Stocks List, Charts, Trends & More |
| China: Technical Analysis, Trends & YTD Performance | |
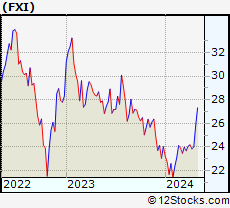
 FXI Weekly Chart |
|
| Long Term Trend: Very Good | |
| Medium Term Trend: Very Good | |
 FXI Daily Chart |
|
| Short Term Trend: Very Good | |
| Overall Trend Score: 100 | |
| YTD Performance: 1.62% | |
| **Trend Scores & Views Are Only For Educational Purposes And Not For Investing | |
| 12Stocks.com: Investing in China Index using Exchange Traded Funds | |
|
The following table shows list of key exchange traded funds (ETF) that
help investors play China stock market. For detailed view, check out our ETF Funds section of our website. Quick View: Move mouse or cursor over ETF symbol (ticker) to view short-term technical chart and over ETF name to view long term chart. Click on ticker or stock name for detailed view. Click on to add stock symbol to your watchlist and to view watchlist. |
12Stocks.com List of ETFs that track China Index
| Ticker | ETF Name | Watchlist | Recent Price | Smart Investing & Trading Score | Change % | Week % | Year-to-date % |
| FXI | China Large-Cap | | 24.42 | 100 | 1.71 | 1.71 | 1.62% |
| EWH | Hong Kong | | 14.99 | 42 | 1.97 | 1.97 | -13.7% |
| YINN | China Bull 3X | | 19.57 | 95 | 4.26 | 4.26 | -6.54% |
| YANG | China Bear 3X | | 11.13 | 10 | -4.63 | -4.63 | -13.05% |
| XPP | China 50 | | 13.37 | 95 | 3.10 | 3.1 | -2.73% |
| MCHI | China | | 39.85 | 88 | 1.12 | 1.12 | -2.18% |
| GXC | China | | 66.33 | 93 | 1.53 | 1.53 | -2.63% |
| CBON | ChinaAMC China Bond | | 21.95 | 65 | 0.11 | 0.11 | -0.68% |
| 12Stocks.com: Charts, Trends, Fundamental Data and Performances of China Stocks | |
|
We now take in-depth look at all China stocks including charts, multi-period performances and overall trends (as measured by Smart Investing & Trading Score). One can sort China stocks (click link to choose) by Daily, Weekly and by Year-to-Date performances. Also, one can sort by size of the company or by market capitalization. |
| Select Your Default Chart Type: | |||||
| |||||
| Click on stock symbol or name for detailed view. Click on to add stock symbol to your watchlist and to view watchlist. Quick View: Move mouse or cursor over "Daily" to quickly view daily technical stock chart and over "Weekly" to view weekly technical stock chart. | |||||

 | HUIZ Huize Holding Limited |
| Sector: Financials | |
| SubSector: Insurance Brokers | |
| MarketCap: 37157 Millions | |
| Recent Price: 0.63 Smart Investing & Trading Score: 57 | |
| Day Percent Change: 2.06% Day Change: 0.01 | |
| Week Change: 2.06% Year-to-date Change: -30.0% | |
| HUIZ Links: Profile News Message Board | |
| Charts:- Daily , Weekly | |
| Add HUIZ to Watchlist: View: Get Complete HUIZ Trend Analysis ➞ | |
 | SDA SunCar Technology Group Inc. |
| Sector: Services & Goods | |
| SubSector: Auto & Truck Dealerships | |
| MarketCap: 2680 Millions | |
| Recent Price: 7.23 Smart Investing & Trading Score: 35 | |
| Day Percent Change: 1.97% Day Change: 0.14 | |
| Week Change: 1.97% Year-to-date Change: -7.0% | |
| SDA Links: Profile News Message Board | |
| Charts:- Daily , Weekly | |
| Add SDA to Watchlist: View: Get Complete SDA Trend Analysis ➞ | |
 | YMM Full Truck Alliance Co. Ltd. |
| Sector: Technology | |
| SubSector: Software - Application | |
| MarketCap: 6960 Millions | |
| Recent Price: 7.92 Smart Investing & Trading Score: 100 | |
| Day Percent Change: 1.93% Day Change: 0.15 | |
| Week Change: 1.93% Year-to-date Change: 13.2% | |
| YMM Links: Profile News Message Board | |
| Charts:- Daily , Weekly | |
| Add YMM to Watchlist: View: Get Complete YMM Trend Analysis ➞ | |
 | YY JOYY Inc. |
| Sector: Technology | |
| SubSector: Internet Information Providers | |
| MarketCap: 3527.6 Millions | |
| Recent Price: 32.80 Smart Investing & Trading Score: 73 | |
| Day Percent Change: 1.77% Day Change: 0.57 | |
| Week Change: 1.77% Year-to-date Change: -17.4% | |
| YY Links: Profile News Message Board | |
| Charts:- Daily , Weekly | |
| Add YY to Watchlist: View: Get Complete YY Trend Analysis ➞ | |
 | HSAI Hesai Group |
| Sector: Services & Goods | |
| SubSector: Auto Parts | |
| MarketCap: 1330 Millions | |
| Recent Price: 4.04 Smart Investing & Trading Score: 30 | |
| Day Percent Change: 1.76% Day Change: 0.07 | |
| Week Change: 1.76% Year-to-date Change: -55.5% | |
| HSAI Links: Profile News Message Board | |
| Charts:- Daily , Weekly | |
| Add HSAI to Watchlist: View: Get Complete HSAI Trend Analysis ➞ | |
 | TOP TOP Financial Group Limited |
| Sector: Financials | |
| SubSector: Capital Markets | |
| MarketCap: 329 Millions | |
| Recent Price: 2.39 Smart Investing & Trading Score: 42 | |
| Day Percent Change: 1.70% Day Change: 0.04 | |
| Week Change: 1.7% Year-to-date Change: -35.8% | |
| TOP Links: Profile News Message Board | |
| Charts:- Daily , Weekly | |
| Add TOP to Watchlist: View: Get Complete TOP Trend Analysis ➞ | |
 | ATHM Autohome Inc. |
| Sector: Technology | |
| SubSector: Internet Information Providers | |
| MarketCap: 7984.2 Millions | |
| Recent Price: 24.69 Smart Investing & Trading Score: 32 | |
| Day Percent Change: 1.69% Day Change: 0.41 | |
| Week Change: 1.69% Year-to-date Change: -12.0% | |
| ATHM Links: Profile News Message Board | |
| Charts:- Daily , Weekly | |
| Add ATHM to Watchlist: View: Get Complete ATHM Trend Analysis ➞ | |
 | API Agora, Inc. |
| Sector: Technology | |
| SubSector: Software Application | |
| MarketCap: 42787 Millions | |
| Recent Price: 2.45 Smart Investing & Trading Score: 49 | |
| Day Percent Change: 1.66% Day Change: 0.04 | |
| Week Change: 1.66% Year-to-date Change: -7.2% | |
| API Links: Profile News Message Board | |
| Charts:- Daily , Weekly | |
| Add API to Watchlist: View: Get Complete API Trend Analysis ➞ | |
 | QFIN 360 Finance, Inc. |
| Sector: Financials | |
| SubSector: Credit Services | |
| MarketCap: 956.208 Millions | |
| Recent Price: 18.29 Smart Investing & Trading Score: 68 | |
| Day Percent Change: 1.61% Day Change: 0.29 | |
| Week Change: 1.61% Year-to-date Change: 15.6% | |
| QFIN Links: Profile News Message Board | |
| Charts:- Daily , Weekly | |
| Add QFIN to Watchlist: View: Get Complete QFIN Trend Analysis ➞ | |
 | ATAT Atour Lifestyle Holdings Limited |
| Sector: Services & Goods | |
| SubSector: Lodging | |
| MarketCap: 2120 Millions | |
| Recent Price: 17.50 Smart Investing & Trading Score: 58 | |
| Day Percent Change: 1.51% Day Change: 0.26 | |
| Week Change: 1.51% Year-to-date Change: -0.1% | |
| ATAT Links: Profile News Message Board | |
| Charts:- Daily , Weekly | |
| Add ATAT to Watchlist: View: Get Complete ATAT Trend Analysis ➞ | |
 | NTES NetEase, Inc. |
| Sector: Technology | |
| SubSector: Internet Software & Services | |
| MarketCap: 40105.1 Millions | |
| Recent Price: 94.88 Smart Investing & Trading Score: 49 | |
| Day Percent Change: 1.47% Day Change: 1.37 | |
| Week Change: 1.47% Year-to-date Change: 1.9% | |
| NTES Links: Profile News Message Board | |
| Charts:- Daily , Weekly | |
| Add NTES to Watchlist: View: Get Complete NTES Trend Analysis ➞ | |
 | LX LexinFintech Holdings Ltd. |
| Sector: Financials | |
| SubSector: Credit Services | |
| MarketCap: 1674.18 Millions | |
| Recent Price: 1.65 Smart Investing & Trading Score: 32 | |
| Day Percent Change: 1.23% Day Change: 0.02 | |
| Week Change: 1.23% Year-to-date Change: -10.3% | |
| LX Links: Profile News Message Board | |
| Charts:- Daily , Weekly | |
| Add LX to Watchlist: View: Get Complete LX Trend Analysis ➞ | |
 | JKS JinkoSolar Holding Co., Ltd. |
| Sector: Technology | |
| SubSector: Semiconductor - Specialized | |
| MarketCap: 629.36 Millions | |
| Recent Price: 21.82 Smart Investing & Trading Score: 38 | |
| Day Percent Change: 1.21% Day Change: 0.26 | |
| Week Change: 1.21% Year-to-date Change: -40.9% | |
| JKS Links: Profile News Message Board | |
| Charts:- Daily , Weekly | |
| Add JKS to Watchlist: View: Get Complete JKS Trend Analysis ➞ | |
 | BGNE BeiGene, Ltd. |
| Sector: Health Care | |
| SubSector: Biotechnology | |
| MarketCap: 10838.5 Millions | |
| Recent Price: 130.94 Smart Investing & Trading Score: 25 | |
| Day Percent Change: 1.10% Day Change: 1.42 | |
| Week Change: 1.1% Year-to-date Change: -27.4% | |
| BGNE Links: Profile News Message Board | |
| Charts:- Daily , Weekly | |
| Add BGNE to Watchlist: View: Get Complete BGNE Trend Analysis ➞ | |
 | SOHU Sohu.com Limited |
| Sector: Technology | |
| SubSector: Internet Information Providers | |
| MarketCap: 243.48 Millions | |
| Recent Price: 11.08 Smart Investing & Trading Score: 68 | |
| Day Percent Change: 1.00% Day Change: 0.11 | |
| Week Change: 1% Year-to-date Change: 11.6% | |
| SOHU Links: Profile News Message Board | |
| Charts:- Daily , Weekly | |
| Add SOHU to Watchlist: View: Get Complete SOHU Trend Analysis ➞ | |
 | PT Pintec Technology Holdings Limited |
| Sector: Technology | |
| SubSector: Wireless Communications | |
| MarketCap: 87.7827 Millions | |
| Recent Price: 1.08 Smart Investing & Trading Score: 7 | |
| Day Percent Change: 0.93% Day Change: 0.01 | |
| Week Change: 0.93% Year-to-date Change: -2.7% | |
| PT Links: Profile News Message Board | |
| Charts:- Daily , Weekly | |
| Add PT to Watchlist: View: Get Complete PT Trend Analysis ➞ | |
 | LU Lufax Holding Ltd |
| Sector: Financials | |
| SubSector: Credit Services | |
| MarketCap: 33457 Millions | |
| Recent Price: 4.39 Smart Investing & Trading Score: 90 | |
| Day Percent Change: 0.92% Day Change: 0.04 | |
| Week Change: 0.92% Year-to-date Change: 43.0% | |
| LU Links: Profile News Message Board | |
| Charts:- Daily , Weekly | |
| Add LU to Watchlist: View: Get Complete LU Trend Analysis ➞ | |
 | THCH TH International Limited |
| Sector: Services & Goods | |
| SubSector: Restaurants | |
| MarketCap: 452 Millions | |
| Recent Price: 1.24 Smart Investing & Trading Score: 60 | |
| Day Percent Change: 0.81% Day Change: 0.01 | |
| Week Change: 0.81% Year-to-date Change: -28.7% | |
| THCH Links: Profile News Message Board | |
| Charts:- Daily , Weekly | |
| Add THCH to Watchlist: View: Get Complete THCH Trend Analysis ➞ | |
 | DQ Daqo New Energy Corp. |
| Sector: Technology | |
| SubSector: Semiconductor Equipment & Materials | |
| MarketCap: 660.918 Millions | |
| Recent Price: 22.29 Smart Investing & Trading Score: 54 | |
| Day Percent Change: 0.81% Day Change: 0.18 | |
| Week Change: 0.81% Year-to-date Change: -16.2% | |
| DQ Links: Profile News Message Board | |
| Charts:- Daily , Weekly | |
| Add DQ to Watchlist: View: Get Complete DQ Trend Analysis ➞ | |
 | ZTO ZTO Express (Cayman) Inc. |
| Sector: Transports | |
| SubSector: Air Delivery & Freight Services | |
| MarketCap: 20507 Millions | |
| Recent Price: 20.10 Smart Investing & Trading Score: 75 | |
| Day Percent Change: 0.80% Day Change: 0.16 | |
| Week Change: 0.8% Year-to-date Change: -5.6% | |
| ZTO Links: Profile News Message Board | |
| Charts:- Daily , Weekly | |
| Add ZTO to Watchlist: View: Get Complete ZTO Trend Analysis ➞ | |
 | DADA Dada Nexus Limited |
| Sector: Services & Goods | |
| SubSector: Internet Retail | |
| MarketCap: 98527 Millions | |
| Recent Price: 1.90 Smart Investing & Trading Score: 73 | |
| Day Percent Change: 0.80% Day Change: 0.01 | |
| Week Change: 0.8% Year-to-date Change: -42.8% | |
| DADA Links: Profile News Message Board | |
| Charts:- Daily , Weekly | |
| Add DADA to Watchlist: View: Get Complete DADA Trend Analysis ➞ | |
 | EM Smart Share Global Limited |
| Sector: Services & Goods | |
| SubSector: Personal Services | |
| MarketCap: 238 Millions | |
| Recent Price: 0.65 Smart Investing & Trading Score: 71 | |
| Day Percent Change: 0.78% Day Change: 0.01 | |
| Week Change: 0.78% Year-to-date Change: 25.2% | |
| EM Links: Profile News Message Board | |
| Charts:- Daily , Weekly | |
| Add EM to Watchlist: View: Get Complete EM Trend Analysis ➞ | |
 | LANV Lanvin Group Holdings Limited |
| Sector: Services & Goods | |
| SubSector: Luxury Goods | |
| MarketCap: 712 Millions | |
| Recent Price: 1.60 Smart Investing & Trading Score: 67 | |
| Day Percent Change: 0.63% Day Change: 0.01 | |
| Week Change: 0.63% Year-to-date Change: -47.7% | |
| LANV Links: Profile News Message Board | |
| Charts:- Daily , Weekly | |
| Add LANV to Watchlist: View: Get Complete LANV Trend Analysis ➞ | |
 | DAO Youdao, Inc. |
| Sector: Technology | |
| SubSector: Internet Information Providers | |
| MarketCap: 2073.2 Millions | |
| Recent Price: 3.57 Smart Investing & Trading Score: 31 | |
| Day Percent Change: 0.56% Day Change: 0.02 | |
| Week Change: 0.56% Year-to-date Change: -9.4% | |
| DAO Links: Profile News Message Board | |
| Charts:- Daily , Weekly | |
| Add DAO to Watchlist: View: Get Complete DAO Trend Analysis ➞ | |
 | CNF CNFinance Holdings Limited |
| Sector: Financials | |
| SubSector: Credit Services | |
| MarketCap: 277.408 Millions | |
| Recent Price: 1.85 Smart Investing & Trading Score: 10 | |
| Day Percent Change: 0.54% Day Change: 0.01 | |
| Week Change: 0.54% Year-to-date Change: -16.7% | |
| CNF Links: Profile News Message Board | |
| Charts:- Daily , Weekly | |
| Add CNF to Watchlist: View: Get Complete CNF Trend Analysis ➞ | |
| For tabular summary view of above stock list: Summary View ➞ 0 - 25 , 25 - 50 , 50 - 75 , 75 - 100 , 100 - 125 , 125 - 150 | ||
| Click To Change The Sort Order: By Market Cap or Company Size Performance: Year-to-date, Week and Day | |
| Select Chart Type: | ||
|
Best Stocks Today 12Stocks.com |
© 2024 12Stocks.com Terms & Conditions Privacy Contact Us
All Information Provided Only For Education And Not To Be Used For Investing or Trading. See Terms & Conditions


One More Thing ... Get Best Stocks Delivered Daily!
Never Ever Miss A Move With Our Top Ten Stocks Lists
Find Best Stocks In Any Market - Bull or Bear Market
Take A Peek At Our Top Ten Stocks Lists: Daily, Weekly, Year-to-Date & Top Trends
Find Best Stocks In Any Market - Bull or Bear Market
Take A Peek At Our Top Ten Stocks Lists: Daily, Weekly, Year-to-Date & Top Trends
China Stocks With Best Up Trends [0-bearish to 100-bullish]: Bilibili [100], JD.com [100], MOGU [100], Full Truck[100], So-Young [90], TAL Education[90], Tencent Music[90], New Oriental[90], Lufax Holding[90], Baozun [88], Yatsen Holding[88]
Best China Stocks Year-to-Date:
U Power[2612.05%], DouYu [772.63%], MicroCloud Hologram[659.71%], China Liberal[509.62%], Yatsen Holding[419.41%], Zhongchao [335.5%], Uxin [116.83%], GigaCloud [102.57%], QuantaSing [102.47%], Cheetah Mobile[63.6%], Bright Scholar[61.6%] Best China Stocks This Week:
Regencell Bioscience[16.04%], So-Young [12.45%], Pinduoduo [9.38%], Hywin [8.88%], Fangdd Network[7.74%], Bilibili [7.61%], Burning Rock[7.5%], GigaCloud [6.92%], Niu [6.46%], Zai Lab[6.46%], Tuya [6.37%] Best China Stocks Daily:
Regencell Bioscience[16.04%], So-Young [12.45%], Pinduoduo [9.38%], Hywin [8.88%], Fangdd Network[7.74%], Bilibili [7.61%], Burning Rock[7.50%], GigaCloud [6.92%], Niu [6.46%], Zai Lab[6.46%], Tuya [6.37%]