
 Login Sign Up


| |||||
 |  | ||||

| 12Stocks.com Market Intelligence |
Best China Stocks
|
On this page, you will find the most comprehensive analysis of Chinese stocks and ETFs - from latest trends to performances to charts ➞. First, here are the year-to-date (YTD) performances of the most requested China stocks at 12Stocks.com (click stock for review):
| Sohu.com 16% | ||
| New Oriental 5% | ||
| NetEase 0% | ||
| JD.com 0% | ||
| Alibaba -3% | ||
| Baidu -13% | ||
| Vipshop -15% | ||
| JOYY -18% | ||
| Weibo -21% | ||
| In a hurry? China Stocks Lists: Performance Trends Table, Stock Charts
Sort China stocks: Daily, Weekly, Year-to-Date, Market Cap & Trends. Filter China stocks list by sector: Show all, Tech, Finance, Energy, Staples, Retail, Industrial, Materials, Utilities and HealthCare Filter China stocks list by size: All China Large Medium Small and MicroCap |
| May 1, 2024 - 12Stocks.com China Stocks Performances & Trends Daily | |||||||||
|
|  The overall Smart Investing & Trading Score is 76 (0-bearish to 100-bullish) which puts China index in short term neutral to bullish trend. The Smart Investing & Trading Score from previous trading session is 100 and hence a deterioration of trend.
| ||||||||
| Here are the Smart Investing & Trading Scores of the most requested China stocks at 12Stocks.com (click stock name for detailed review): |

| 12Stocks.com: Top Performing China Index Stocks | ||||||||||||||||||||||||||||||||||||||||||||||||
 The top performing China Index stocks year to date are
Now, more recently, over last week, the top performing China Index stocks on the move are


|
||||||||||||||||||||||||||||||||||||||||||||||||
| 12Stocks.com: Investing in China Index with Stocks | |
|
The following table helps investors and traders sort through current performance and trends (as measured by Smart Investing & Trading Score) of various
stocks in the China Index. Quick View: Move mouse or cursor over stock symbol (ticker) to view short-term technical chart and over stock name to view long term chart. Click on  to add stock symbol to your watchlist and to add stock symbol to your watchlist and  to view watchlist. Click on any ticker or stock name for detailed market intelligence report for that stock. to view watchlist. Click on any ticker or stock name for detailed market intelligence report for that stock. |
12Stocks.com Performance of Stocks in China Index
| Ticker | Stock Name | Watchlist | Category | Recent Price | Smart Investing & Trading Score | Change % | YTD Change% |
| JD | JD.com |   | Technology | 28.89 | 78 | -3.35 | 0.00% |
| UCAR | U Power | | Services & Goods | 5.36 | 85 | -3.42 | NA |
| KNDI | Kandi | | Consumer Staples | 2.54 | 42 | -3.79 | -9.29% |
| GDS | GDS | | Technology | 8.16 | 100 | -4.00 | -10.53% |
| MSC | Studio City | | Services & Goods | 7.44 | 61 | -4.00 | 14.81% |
| LX | LexinFintech | | Financials | 1.68 | 17 | -4.00 | -8.70% |
| BZUN | Baozun | | Services & Goods | 2.60 | 58 | -4.41 | -5.11% |
| EH | EHang | | Industrials | 17.82 | 58 | -4.60 | 6.07% |
| QD | Qudian | | Technology | 2.38 | 33 | -4.80 | 16.67% |
| TAL | TAL Education | | Services & Goods | 12.04 | 58 | -4.90 | -4.67% |
| SDA | SunCar | | Services & Goods | 7.89 | 74 | -4.94 | 1.54% |
| BILI | Bilibili | | Technology | 12.64 | 83 | -5.32 | 3.86% |
| VIPS | Vipshop | | Services & Goods | 15.04 | 0 | -5.35 | -15.32% |
| HOLI | Hollysys Automation | | Industrials | 23.29 | 0 | -5.40 | -11.61% |
| LXEH | Lixiang Education | | Consumer Staples | 0.50 | 59 | -5.62 | -54.33% |
| JG | Aurora Mobile | | Technology | 2.95 | 5 | -5.75 | 3.44% |
| AIXI | Xiao-I | | Technology | 1.22 | 20 | -6.15 | -45.78% |
| ZCMD | Zhongchao | | Health Care | 1.60 | 41 | -6.32 | 338.78% |
| EDU | New Oriental | | Services & Goods | 77.10 | 13 | -6.33 | 5.21% |
| GCT | GigaCloud | | Technology | 31.79 | 36 | -6.44 | 73.62% |
| LKCO | Luokung | | Technology | 0.48 | 33 | -6.70 | -3.22% |
| XNET | Xunlei | | Technology | 1.53 | 32 | -6.71 | -5.56% |
| HTHT | Huazhu | | Services & Goods | 36.71 | 36 | -6.87 | 9.78% |
| YQ | 17 Education | | Consumer Staples | 2.67 | 41 | -8.00 | 30.78% |
| YUMC | Yum China | | Services & Goods | 36.51 | 36 | -8.82 | -13.95% |
| For chart view version of above stock list: Chart View ➞ 0 - 25 , 25 - 50 , 50 - 75 , 75 - 100 , 100 - 125 , 125 - 150 | ||
 | Click To Change The Sort Order: By Market Cap or Company Size Performance: Year-to-date, Week and Day |  |
|
Get the most comprehensive stock market coverage daily at 12Stocks.com ➞ Best Stocks Today ➞ Best Stocks Weekly ➞ Best Stocks Year-to-Date ➞ Best Stocks Trends ➞  Best Stocks Today 12Stocks.com Best Nasdaq Stocks ➞ Best S&P 500 Stocks ➞ Best Tech Stocks ➞ Best Biotech Stocks ➞ |
| Detailed Overview of China Stocks |
| China Technical Overview, Leaders & Laggards, Top China ETF Funds & Detailed China Stocks List, Charts, Trends & More |
| China: Technical Analysis, Trends & YTD Performance | |
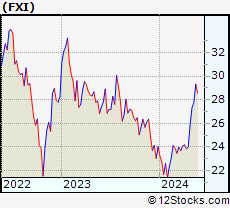
 FXI Weekly Chart |
|
| Long Term Trend: Very Good | |
| Medium Term Trend: Very Good | |
 FXI Daily Chart |
|
| Short Term Trend: Good | |
| Overall Trend Score: 76 | |
| YTD Performance: 6.08% | |
| **Trend Scores & Views Are Only For Educational Purposes And Not For Investing | |
| 12Stocks.com: Investing in China Index using Exchange Traded Funds | |
|
The following table shows list of key exchange traded funds (ETF) that
help investors play China stock market. For detailed view, check out our ETF Funds section of our website. Quick View: Move mouse or cursor over ETF symbol (ticker) to view short-term technical chart and over ETF name to view long term chart. Click on ticker or stock name for detailed view. Click on to add stock symbol to your watchlist and to view watchlist. |
12Stocks.com List of ETFs that track China Index
| Ticker | ETF Name | Watchlist | Recent Price | Smart Investing & Trading Score | Change % | Week % | Year-to-date % |
| FXI | China Large-Cap | | 25.49 | 76 | -2.37 | -1.47 | 6.08% |
| EWH | Hong Kong | | 16.04 | 88 | -1.23 | 0.38 | -7.66% |
| YINN | China Bull 3X | | 22.22 | 76 | -6.52 | -4.27 | 6.11% |
| YANG | China Bear 3X | | 9.67 | 27 | 6.38 | 3.53 | -24.45% |
| XPP | China 50 | | 14.54 | 76 | -4.40 | -3.25 | 5.79% |
| MCHI | China | | 41.88 | 83 | -2.08 | -1.11 | 2.8% |
| GXC | China | | 68.89 | 83 | -1.73 | -0.79 | 1.13% |
| CBON | ChinaAMC China Bond | | 21.86 | 38 | -0.02 | 0.09 | -1.08% |
| 12Stocks.com: Charts, Trends, Fundamental Data and Performances of China Stocks | |
|
We now take in-depth look at all China stocks including charts, multi-period performances and overall trends (as measured by Smart Investing & Trading Score). One can sort China stocks (click link to choose) by Daily, Weekly and by Year-to-Date performances. Also, one can sort by size of the company or by market capitalization. |
| Select Your Default Chart Type: | |||||
| |||||
| Click on stock symbol or name for detailed view. Click on to add stock symbol to your watchlist and to view watchlist. Quick View: Move mouse or cursor over "Daily" to quickly view daily technical stock chart and over "Weekly" to view weekly technical stock chart. | |||||

 | JD JD.com, Inc. |
| Sector: Technology | |
| SubSector: Internet Information Providers | |
| MarketCap: 59907.3 Millions | |
| Recent Price: 28.89 Smart Investing & Trading Score: 78 | |
| Day Percent Change: -3.35% Day Change: -1.00 | |
| Week Change: -4.78% Year-to-date Change: 0.0% | |
| JD Links: Profile News Message Board | |
| Charts:- Daily , Weekly | |
| Add JD to Watchlist: View: Get Complete JD Trend Analysis ➞ | |
 | UCAR U Power Limited |
| Sector: Services & Goods | |
| SubSector: Auto & Truck Dealerships | |
| MarketCap: 372 Millions | |
| Recent Price: 5.36 Smart Investing & Trading Score: 85 | |
| Day Percent Change: -3.42% Day Change: -0.19 | |
| Week Change: 4.69% Year-to-date Change: 2,891.1% | |
| UCAR Links: Profile News Message Board | |
| Charts:- Daily , Weekly | |
| Add UCAR to Watchlist: View: Get Complete UCAR Trend Analysis ➞ | |
 | KNDI Kandi Technologies Group, Inc. |
| Sector: Consumer Staples | |
| SubSector: Auto Manufacturers - Major | |
| MarketCap: 137.471 Millions | |
| Recent Price: 2.54 Smart Investing & Trading Score: 42 | |
| Day Percent Change: -3.79% Day Change: -0.10 | |
| Week Change: -2.68% Year-to-date Change: -9.3% | |
| KNDI Links: Profile News Message Board | |
| Charts:- Daily , Weekly | |
| Add KNDI to Watchlist: View: Get Complete KNDI Trend Analysis ➞ | |
 | GDS GDS Holdings Limited |
| Sector: Technology | |
| SubSector: Data Storage Devices | |
| MarketCap: 8597.99 Millions | |
| Recent Price: 8.16 Smart Investing & Trading Score: 100 | |
| Day Percent Change: -4.00% Day Change: -0.34 | |
| Week Change: 5.15% Year-to-date Change: -10.5% | |
| GDS Links: Profile News Message Board | |
| Charts:- Daily , Weekly | |
| Add GDS to Watchlist: View: Get Complete GDS Trend Analysis ➞ | |
 | MSC Studio City International Holdings Limited |
| Sector: Services & Goods | |
| SubSector: Resorts & Casinos | |
| MarketCap: 1420.54 Millions | |
| Recent Price: 7.44 Smart Investing & Trading Score: 61 | |
| Day Percent Change: -4.00% Day Change: -0.31 | |
| Week Change: 4.57% Year-to-date Change: 14.8% | |
| MSC Links: Profile News Message Board | |
| Charts:- Daily , Weekly | |
| Add MSC to Watchlist: View: Get Complete MSC Trend Analysis ➞ | |
 | LX LexinFintech Holdings Ltd. |
| Sector: Financials | |
| SubSector: Credit Services | |
| MarketCap: 1674.18 Millions | |
| Recent Price: 1.68 Smart Investing & Trading Score: 17 | |
| Day Percent Change: -4.00% Day Change: -0.07 | |
| Week Change: -1.75% Year-to-date Change: -8.7% | |
| LX Links: Profile News Message Board | |
| Charts:- Daily , Weekly | |
| Add LX to Watchlist: View: Get Complete LX Trend Analysis ➞ | |
 | BZUN Baozun Inc. |
| Sector: Services & Goods | |
| SubSector: Catalog & Mail Order Houses | |
| MarketCap: 1668.92 Millions | |
| Recent Price: 2.60 Smart Investing & Trading Score: 58 | |
| Day Percent Change: -4.41% Day Change: -0.12 | |
| Week Change: -5.45% Year-to-date Change: -5.1% | |
| BZUN Links: Profile News Message Board | |
| Charts:- Daily , Weekly | |
| Add BZUN to Watchlist: View: Get Complete BZUN Trend Analysis ➞ | |
 | EH EHang Holdings Limited |
| Sector: Industrials | |
| SubSector: Aerospace/Defense Products & Services | |
| MarketCap: 513.401 Millions | |
| Recent Price: 17.82 Smart Investing & Trading Score: 58 | |
| Day Percent Change: -4.60% Day Change: -0.86 | |
| Week Change: -2.3% Year-to-date Change: 6.1% | |
| EH Links: Profile News Message Board | |
| Charts:- Daily , Weekly | |
| Add EH to Watchlist: View: Get Complete EH Trend Analysis ➞ | |
 | QD Qudian Inc. |
| Sector: Technology | |
| SubSector: Information Technology Services | |
| MarketCap: 544.968 Millions | |
| Recent Price: 2.38 Smart Investing & Trading Score: 33 | |
| Day Percent Change: -4.80% Day Change: -0.12 | |
| Week Change: -3.25% Year-to-date Change: 16.7% | |
| QD Links: Profile News Message Board | |
| Charts:- Daily , Weekly | |
| Add QD to Watchlist: View: Get Complete QD Trend Analysis ➞ | |
 | TAL TAL Education Group |
| Sector: Services & Goods | |
| SubSector: Education & Training Services | |
| MarketCap: 30103.1 Millions | |
| Recent Price: 12.04 Smart Investing & Trading Score: 58 | |
| Day Percent Change: -4.90% Day Change: -0.62 | |
| Week Change: -10.22% Year-to-date Change: -4.7% | |
| TAL Links: Profile News Message Board | |
| Charts:- Daily , Weekly | |
| Add TAL to Watchlist: View: Get Complete TAL Trend Analysis ➞ | |
 | SDA SunCar Technology Group Inc. |
| Sector: Services & Goods | |
| SubSector: Auto & Truck Dealerships | |
| MarketCap: 2680 Millions | |
| Recent Price: 7.89 Smart Investing & Trading Score: 74 | |
| Day Percent Change: -4.94% Day Change: -0.41 | |
| Week Change: 8.68% Year-to-date Change: 1.5% | |
| SDA Links: Profile News Message Board | |
| Charts:- Daily , Weekly | |
| Add SDA to Watchlist: View: Get Complete SDA Trend Analysis ➞ | |
 | BILI Bilibili Inc. |
| Sector: Technology | |
| SubSector: Internet Information Providers | |
| MarketCap: 7043.1 Millions | |
| Recent Price: 12.64 Smart Investing & Trading Score: 83 | |
| Day Percent Change: -5.32% Day Change: -0.71 | |
| Week Change: -3.66% Year-to-date Change: 3.9% | |
| BILI Links: Profile News Message Board | |
| Charts:- Daily , Weekly | |
| Add BILI to Watchlist: View: Get Complete BILI Trend Analysis ➞ | |
 | VIPS Vipshop Holdings Limited |
| Sector: Services & Goods | |
| SubSector: Catalog & Mail Order Houses | |
| MarketCap: 10496.2 Millions | |
| Recent Price: 15.04 Smart Investing & Trading Score: 0 | |
| Day Percent Change: -5.35% Day Change: -0.85 | |
| Week Change: -4.39% Year-to-date Change: -15.3% | |
| VIPS Links: Profile News Message Board | |
| Charts:- Daily , Weekly | |
| Add VIPS to Watchlist: View: Get Complete VIPS Trend Analysis ➞ | |
 | HOLI Hollysys Automation Technologies Ltd. |
| Sector: Industrials | |
| SubSector: Industrial Electrical Equipment | |
| MarketCap: 668.379 Millions | |
| Recent Price: 23.29 Smart Investing & Trading Score: 0 | |
| Day Percent Change: -5.40% Day Change: -1.33 | |
| Week Change: -5.13% Year-to-date Change: -11.6% | |
| HOLI Links: Profile News Message Board | |
| Charts:- Daily , Weekly | |
| Add HOLI to Watchlist: View: Get Complete HOLI Trend Analysis ➞ | |
 | LXEH Lixiang Education Holding Co., Ltd. |
| Sector: Consumer Staples | |
| SubSector: Education & Training Services | |
| MarketCap: 12347 Millions | |
| Recent Price: 0.50 Smart Investing & Trading Score: 59 | |
| Day Percent Change: -5.62% Day Change: -0.03 | |
| Week Change: 20.85% Year-to-date Change: -54.3% | |
| LXEH Links: Profile News Message Board | |
| Charts:- Daily , Weekly | |
| Add LXEH to Watchlist: View: Get Complete LXEH Trend Analysis ➞ | |
 | JG Aurora Mobile Limited |
| Sector: Technology | |
| SubSector: Application Software | |
| MarketCap: 268.762 Millions | |
| Recent Price: 2.95 Smart Investing & Trading Score: 5 | |
| Day Percent Change: -5.75% Day Change: -0.18 | |
| Week Change: -1.99% Year-to-date Change: 3.4% | |
| JG Links: Profile News Message Board | |
| Charts:- Daily , Weekly | |
| Add JG to Watchlist: View: Get Complete JG Trend Analysis ➞ | |
 | AIXI Xiao-I Corporation |
| Sector: Technology | |
| SubSector: Software - Application | |
| MarketCap: 431 Millions | |
| Recent Price: 1.22 Smart Investing & Trading Score: 20 | |
| Day Percent Change: -6.15% Day Change: -0.08 | |
| Week Change: -4.69% Year-to-date Change: -45.8% | |
| AIXI Links: Profile News Message Board | |
| Charts:- Daily , Weekly | |
| Add AIXI to Watchlist: View: Get Complete AIXI Trend Analysis ➞ | |
 | ZCMD Zhongchao Inc. |
| Sector: Health Care | |
| SubSector: Health Information Services | |
| MarketCap: 41487 Millions | |
| Recent Price: 1.60 Smart Investing & Trading Score: 41 | |
| Day Percent Change: -6.32% Day Change: -0.11 | |
| Week Change: -5.21% Year-to-date Change: 338.8% | |
| ZCMD Links: Profile News Message Board | |
| Charts:- Daily , Weekly | |
| Add ZCMD to Watchlist: View: Get Complete ZCMD Trend Analysis ➞ | |
 | EDU New Oriental Education & Technology Group Inc. |
| Sector: Services & Goods | |
| SubSector: Education & Training Services | |
| MarketCap: 18673.7 Millions | |
| Recent Price: 77.10 Smart Investing & Trading Score: 13 | |
| Day Percent Change: -6.33% Day Change: -5.21 | |
| Week Change: -7.4% Year-to-date Change: 5.2% | |
| EDU Links: Profile News Message Board | |
| Charts:- Daily , Weekly | |
| Add EDU to Watchlist: View: Get Complete EDU Trend Analysis ➞ | |
 | GCT GigaCloud Technology Inc. |
| Sector: Technology | |
| SubSector: Software - Infrastructure | |
| MarketCap: 240 Millions | |
| Recent Price: 31.79 Smart Investing & Trading Score: 36 | |
| Day Percent Change: -6.44% Day Change: -2.19 | |
| Week Change: -10.07% Year-to-date Change: 73.6% | |
| GCT Links: Profile News Message Board | |
| Charts:- Daily , Weekly | |
| Add GCT to Watchlist: View: Get Complete GCT Trend Analysis ➞ | |
 | LKCO Luokung Technology Corp. |
| Sector: Technology | |
| SubSector: Application Software | |
| MarketCap: 84 Millions | |
| Recent Price: 0.48 Smart Investing & Trading Score: 33 | |
| Day Percent Change: -6.70% Day Change: -0.03 | |
| Week Change: -1.61% Year-to-date Change: -3.2% | |
| LKCO Links: Profile News Message Board | |
| Charts:- Daily , Weekly | |
| Add LKCO to Watchlist: View: Get Complete LKCO Trend Analysis ➞ | |
 | XNET Xunlei Limited |
| Sector: Technology | |
| SubSector: Application Software | |
| MarketCap: 203.662 Millions | |
| Recent Price: 1.53 Smart Investing & Trading Score: 32 | |
| Day Percent Change: -6.71% Day Change: -0.11 | |
| Week Change: -2.24% Year-to-date Change: -5.6% | |
| XNET Links: Profile News Message Board | |
| Charts:- Daily , Weekly | |
| Add XNET to Watchlist: View: Get Complete XNET Trend Analysis ➞ | |
 | HTHT Huazhu Group Limited |
| Sector: Services & Goods | |
| SubSector: Lodging | |
| MarketCap: 9164.46 Millions | |
| Recent Price: 36.71 Smart Investing & Trading Score: 36 | |
| Day Percent Change: -6.87% Day Change: -2.71 | |
| Week Change: -8.36% Year-to-date Change: 9.8% | |
| HTHT Links: Profile News Message Board | |
| Charts:- Daily , Weekly | |
| Add HTHT to Watchlist: View: Get Complete HTHT Trend Analysis ➞ | |
 | YQ 17 Education & Technology Group Inc. |
| Sector: Consumer Staples | |
| SubSector: Education & Training Services | |
| MarketCap: 32347 Millions | |
| Recent Price: 2.67 Smart Investing & Trading Score: 41 | |
| Day Percent Change: -8.00% Day Change: -0.23 | |
| Week Change: -7.68% Year-to-date Change: 30.8% | |
| YQ Links: Profile News Message Board | |
| Charts:- Daily , Weekly | |
| Add YQ to Watchlist: View: Get Complete YQ Trend Analysis ➞ | |
 | YUMC Yum China Holdings, Inc. |
| Sector: Services & Goods | |
| SubSector: Restaurants | |
| MarketCap: 16284.5 Millions | |
| Recent Price: 36.51 Smart Investing & Trading Score: 36 | |
| Day Percent Change: -8.82% Day Change: -3.53 | |
| Week Change: -7.92% Year-to-date Change: -14.0% | |
| YUMC Links: Profile News Message Board | |
| Charts:- Daily , Weekly | |
| Add YUMC to Watchlist: View: Get Complete YUMC Trend Analysis ➞ | |
| For tabular summary view of above stock list: Summary View ➞ 0 - 25 , 25 - 50 , 50 - 75 , 75 - 100 , 100 - 125 , 125 - 150 | ||
| Click To Change The Sort Order: By Market Cap or Company Size Performance: Year-to-date, Week and Day | |
| Select Chart Type: | ||
|
Best Stocks Today 12Stocks.com |
© 2024 12Stocks.com Terms & Conditions Privacy Contact Us
All Information Provided Only For Education And Not To Be Used For Investing or Trading. See Terms & Conditions


One More Thing ... Get Best Stocks Delivered Daily!
Never Ever Miss A Move With Our Top Ten Stocks Lists
Find Best Stocks In Any Market - Bull or Bear Market
Take A Peek At Our Top Ten Stocks Lists: Daily, Weekly, Year-to-Date & Top Trends
Find Best Stocks In Any Market - Bull or Bear Market
Take A Peek At Our Top Ten Stocks Lists: Daily, Weekly, Year-to-Date & Top Trends
China Stocks With Best Up Trends [0-bearish to 100-bullish]: Smart Share[100], ATRenew [100], GDS [100], MOGU [93], Niu [93], BeiGene [93], Kanzhun [90], Autohome [88], Sohu.com [88], KE [88], Weibo [88]
Best China Stocks Year-to-Date:
U Power[2891.07%], DouYu [803.16%], MicroCloud Hologram[628.06%], China Liberal[504.03%], Yatsen Holding[497.32%], Zhongchao [338.78%], Uxin [163.91%], QuantaSing [85.8%], GigaCloud [73.62%], Cheetah Mobile[71.49%], Yiren Digital[61.54%] Best China Stocks This Week:
Golden Heaven[22.28%], Lixiang Education[20.85%], Viomi [16.39%], Smart Share[14.54%], Lanvin [13.92%], uCloudlink [9.49%], MOGU [9.03%], Dingdong (Cayman)[8.73%], SunCar [8.68%], China Online[7.72%], 21Vianet [6.96%] Best China Stocks Daily:
Golden Heaven[25.92%], Lanvin [19.21%], Regencell Bioscience[13.33%], Smart Share[11.15%], MOGU [10.22%], Skillful Craftsman[7.89%], China Online[6.43%], Sunlands [6.39%], Yunji [5.43%], OneConnect Financial[5.18%], Cango [4.90%]