
 Login Sign Up


| |||||
 |  | ||||

| 12Stocks.com Market Intelligence |
Best China Stocks
|
On this page, you will find the most comprehensive analysis of Chinese stocks and ETFs - from latest trends to performances to charts ➞. First, here are the year-to-date (YTD) performances of the most requested China stocks at 12Stocks.com (click stock for review):
| New Oriental 19% | ||
| Sohu.com 10% | ||
| NetEase -1% | ||
| Alibaba -11% | ||
| JD.com -12% | ||
| Vipshop -15% | ||
| JOYY -18% | ||
| Baidu -20% | ||
| Weibo -26% | ||
| In a hurry? China Stocks Lists: Performance Trends Table, Stock Charts
Sort China stocks: Daily, Weekly, Year-to-Date, Market Cap & Trends. Filter China stocks list by sector: Show all, Tech, Finance, Energy, Staples, Retail, Industrial, Materials, Utilities and HealthCare Filter China stocks list by size: All China Large Medium Small and MicroCap |
| April 19, 2024 - 12Stocks.com China Stocks Performances & Trends Daily | |||||||||
|
|  The overall Smart Investing & Trading Score is 73 (0-bearish to 100-bullish) which puts China index in short term neutral to bullish trend. The Smart Investing & Trading Score from previous trading session is 36 and hence an improvement of trend.
| ||||||||
| Here are the Smart Investing & Trading Scores of the most requested China stocks at 12Stocks.com (click stock name for detailed review): |


| 12Stocks.com: Top Performing China Index Stocks | ||||||||||||||||||||||||||||||||||||||||||||||||
 The top performing China Index stocks year to date are
Now, more recently, over last week, the top performing China Index stocks on the move are


|
||||||||||||||||||||||||||||||||||||||||||||||||
| 12Stocks.com: Investing in China Index with Stocks | |
|
The following table helps investors and traders sort through current performance and trends (as measured by Smart Investing & Trading Score) of various
stocks in the China Index. Quick View: Move mouse or cursor over stock symbol (ticker) to view short-term technical chart and over stock name to view long term chart. Click on  to add stock symbol to your watchlist and to add stock symbol to your watchlist and  to view watchlist. Click on any ticker or stock name for detailed market intelligence report for that stock. to view watchlist. Click on any ticker or stock name for detailed market intelligence report for that stock. |
12Stocks.com Performance of Stocks in China Index
| Ticker | Stock Name | Watchlist | Category | Recent Price | Smart Investing & Trading Score | Change % | YTD Change% |
| LKCO | Luokung |   | Technology | 0.54 | 58 | 0.00 | 8.94% |
| PT | Pintec | | Technology | 1.06 | 0 | 0.00 | -4.05% |
| KRKR | 36Kr | | Technology | 0.38 | 50 | 0.00 | -32.63% |
| COE | China Online | | Services & Goods | 6.60 | 20 | 0.00 | -17.82% |
| SVA | Sinovac Biotech | | Health Care | 6.47 | 27 | 0.00 | 0.00% |
| VNET | 21Vianet | | Technology | 1.47 | 5 | 0.00 | -48.78% |
| ATHM | Autohome | | Technology | 24.26 | 10 | -0.04 | -13.54% |
| BEST | BEST | | Consumer Staples | 2.08 | 10 | -0.05 | -18.48% |
| JKS | JinkoSolar Holding | | Technology | 21.66 | 10 | -0.14 | -41.36% |
| ZH | Zhihu | | Services & Goods | 0.66 | 12 | -0.14 | -30.52% |
| JFIN | Jiayin | | Technology | 6.36 | 36 | -0.24 | 22.68% |
| XYF | X Financial | | Financials | 3.78 | 10 | -0.26 | 3.28% |
| EDTK | Skillful Craftsman | | Consumer Staples | 0.92 | 18 | -0.27 | -26.98% |
| RERE | ATRenew | | Services & Goods | 1.59 | 36 | -0.31 | -16.14% |
| BZ | Kanzhun | | Industrials | 18.02 | 51 | -0.50 | 9.08% |
| IMAB | I Mab | | Health Care | 1.80 | 48 | -0.55 | -5.26% |
| HCM | Hutchison China | | Health Care | 16.36 | 31 | -0.55 | -9.66% |
| AIXI | Xiao-I | | Technology | 1.49 | 10 | -0.67 | -33.78% |
| FENG | Phoenix New | | Technology | 1.88 | 44 | -0.79 | 37.87% |
| WDH | Waterdrop | | Financials | 1.22 | 53 | -0.81 | 16.52% |
| YSG | Yatsen Holding | | Services & Goods | 3.58 | 83 | -0.83 | 389.34% |
| DDL | Dingdong (Cayman) | | Consumer Staples | 1.12 | 5 | -0.88 | -26.32% |
| QD | Qudian | | Technology | 2.25 | 26 | -0.88 | 10.29% |
| SOHU | Sohu.com | | Technology | 10.91 | 51 | -0.91 | 9.87% |
| NIU | Niu | | Consumer Staples | 2.03 | 61 | -0.98 | -7.31% |
| For chart view version of above stock list: Chart View ➞ 0 - 25 , 25 - 50 , 50 - 75 , 75 - 100 , 100 - 125 , 125 - 150 | ||
 | Click To Change The Sort Order: By Market Cap or Company Size Performance: Year-to-date, Week and Day |  |
|
Get the most comprehensive stock market coverage daily at 12Stocks.com ➞ Best Stocks Today ➞ Best Stocks Weekly ➞ Best Stocks Year-to-Date ➞ Best Stocks Trends ➞  Best Stocks Today 12Stocks.com Best Nasdaq Stocks ➞ Best S&P 500 Stocks ➞ Best Tech Stocks ➞ Best Biotech Stocks ➞ |
| Detailed Overview of China Stocks |
| China Technical Overview, Leaders & Laggards, Top China ETF Funds & Detailed China Stocks List, Charts, Trends & More |
| China: Technical Analysis, Trends & YTD Performance | |
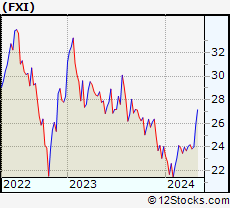
 FXI Weekly Chart |
|
| Long Term Trend: Very Good | |
| Medium Term Trend: Good | |
 FXI Daily Chart |
|
| Short Term Trend: Very Good | |
| Overall Trend Score: 73 | |
| YTD Performance: 0.21% | |
| **Trend Scores & Views Are Only For Educational Purposes And Not For Investing | |
| 12Stocks.com: Investing in China Index using Exchange Traded Funds | |
|
The following table shows list of key exchange traded funds (ETF) that
help investors play China stock market. For detailed view, check out our ETF Funds section of our website. Quick View: Move mouse or cursor over ETF symbol (ticker) to view short-term technical chart and over ETF name to view long term chart. Click on ticker or stock name for detailed view. Click on to add stock symbol to your watchlist and to view watchlist. |
12Stocks.com List of ETFs that track China Index
| Ticker | ETF Name | Watchlist | Recent Price | Smart Investing & Trading Score | Change % | Week % | Year-to-date % |
| FXI | China Large-Cap | | 24.08 | 73 | 1.82 | 1.01 | 0.21% |
| EWH | Hong Kong | | 14.74 | 17 | 0.61 | -2.77 | -15.14% |
| YINN | China Bull 3X | | 18.81 | 73 | 5.08 | 2.28 | -10.17% |
| YANG | China Bear 3X | | 11.58 | 25 | -5.47 | -2.61 | -9.53% |
| XPP | China 50 | | 12.99 | 66 | 3.16 | 1.64 | -5.49% |
| MCHI | China | | 39.54 | 73 | 1.28 | 0.66 | -2.95% |
| GXC | China | | 65.52 | 73 | 1.02 | 0.69 | -3.82% |
| CBON | ChinaAMC China Bond | | 21.92 | 55 | -0.15 | 0.26 | -0.83% |
| 12Stocks.com: Charts, Trends, Fundamental Data and Performances of China Stocks | |
|
We now take in-depth look at all China stocks including charts, multi-period performances and overall trends (as measured by Smart Investing & Trading Score). One can sort China stocks (click link to choose) by Daily, Weekly and by Year-to-Date performances. Also, one can sort by size of the company or by market capitalization. |
| Select Your Default Chart Type: | |||||
| |||||
| Click on stock symbol or name for detailed view. Click on to add stock symbol to your watchlist and to view watchlist. Quick View: Move mouse or cursor over "Daily" to quickly view daily technical stock chart and over "Weekly" to view weekly technical stock chart. | |||||

 | LKCO Luokung Technology Corp. |
| Sector: Technology | |
| SubSector: Application Software | |
| MarketCap: 84 Millions | |
| Recent Price: 0.54 Smart Investing & Trading Score: 58 | |
| Day Percent Change: 0.00% Day Change: 0.00 | |
| Week Change: 1.26% Year-to-date Change: 8.9% | |
| LKCO Links: Profile News Message Board | |
| Charts:- Daily , Weekly | |
| Add LKCO to Watchlist: View: Get Complete LKCO Trend Analysis ➞ | |
 | PT Pintec Technology Holdings Limited |
| Sector: Technology | |
| SubSector: Wireless Communications | |
| MarketCap: 87.7827 Millions | |
| Recent Price: 1.06 Smart Investing & Trading Score: 0 | |
| Day Percent Change: 0.00% Day Change: 0.00 | |
| Week Change: -2.29% Year-to-date Change: -4.1% | |
| PT Links: Profile News Message Board | |
| Charts:- Daily , Weekly | |
| Add PT to Watchlist: View: Get Complete PT Trend Analysis ➞ | |
 | KRKR 36Kr Holdings Inc. |
| Sector: Technology | |
| SubSector: Internet Information Providers | |
| MarketCap: 173.18 Millions | |
| Recent Price: 0.38 Smart Investing & Trading Score: 50 | |
| Day Percent Change: 0.00% Day Change: 0.00 | |
| Week Change: 1.81% Year-to-date Change: -32.6% | |
| KRKR Links: Profile News Message Board | |
| Charts:- Daily , Weekly | |
| Add KRKR to Watchlist: View: Get Complete KRKR Trend Analysis ➞ | |
 | COE China Online Education Group |
| Sector: Services & Goods | |
| SubSector: Education & Training Services | |
| MarketCap: 643.406 Millions | |
| Recent Price: 6.60 Smart Investing & Trading Score: 20 | |
| Day Percent Change: 0.00% Day Change: 0.00 | |
| Week Change: 1.38% Year-to-date Change: -17.8% | |
| COE Links: Profile News Message Board | |
| Charts:- Daily , Weekly | |
| Add COE to Watchlist: View: Get Complete COE Trend Analysis ➞ | |
 | SVA Sinovac Biotech Ltd. |
| Sector: Health Care | |
| SubSector: Biotechnology | |
| MarketCap: 336.88 Millions | |
| Recent Price: 6.47 Smart Investing & Trading Score: 27 | |
| Day Percent Change: 0.00% Day Change: 0.00 | |
| Week Change: 0% Year-to-date Change: 0.0% | |
| SVA Links: Profile News Message Board | |
| Charts:- Daily , Weekly | |
| Add SVA to Watchlist: View: Get Complete SVA Trend Analysis ➞ | |
 | VNET 21Vianet Group, Inc. |
| Sector: Technology | |
| SubSector: Information Technology Services | |
| MarketCap: 1846.98 Millions | |
| Recent Price: 1.47 Smart Investing & Trading Score: 5 | |
| Day Percent Change: 0.00% Day Change: 0.00 | |
| Week Change: -8.7% Year-to-date Change: -48.8% | |
| VNET Links: Profile News Message Board | |
| Charts:- Daily , Weekly | |
| Add VNET to Watchlist: View: Get Complete VNET Trend Analysis ➞ | |
 | ATHM Autohome Inc. |
| Sector: Technology | |
| SubSector: Internet Information Providers | |
| MarketCap: 7984.2 Millions | |
| Recent Price: 24.26 Smart Investing & Trading Score: 10 | |
| Day Percent Change: -0.04% Day Change: -0.01 | |
| Week Change: -3.88% Year-to-date Change: -13.5% | |
| ATHM Links: Profile News Message Board | |
| Charts:- Daily , Weekly | |
| Add ATHM to Watchlist: View: Get Complete ATHM Trend Analysis ➞ | |
 | BEST BEST Inc. |
| Sector: Consumer Staples | |
| SubSector: Packaging & Containers | |
| MarketCap: 1981.73 Millions | |
| Recent Price: 2.08 Smart Investing & Trading Score: 10 | |
| Day Percent Change: -0.05% Day Change: 0.00 | |
| Week Change: -0.95% Year-to-date Change: -18.5% | |
| BEST Links: Profile News Message Board | |
| Charts:- Daily , Weekly | |
| Add BEST to Watchlist: View: Get Complete BEST Trend Analysis ➞ | |
 | JKS JinkoSolar Holding Co., Ltd. |
| Sector: Technology | |
| SubSector: Semiconductor - Specialized | |
| MarketCap: 629.36 Millions | |
| Recent Price: 21.66 Smart Investing & Trading Score: 10 | |
| Day Percent Change: -0.14% Day Change: -0.03 | |
| Week Change: -5.91% Year-to-date Change: -41.4% | |
| JKS Links: Profile News Message Board | |
| Charts:- Daily , Weekly | |
| Add JKS to Watchlist: View: Get Complete JKS Trend Analysis ➞ | |
 | ZH Zhihu Inc. |
| Sector: Services & Goods | |
| SubSector: Internet Content & Information | |
| MarketCap: 741 Millions | |
| Recent Price: 0.66 Smart Investing & Trading Score: 12 | |
| Day Percent Change: -0.14% Day Change: 0.00 | |
| Week Change: -6.13% Year-to-date Change: -30.5% | |
| ZH Links: Profile News Message Board | |
| Charts:- Daily , Weekly | |
| Add ZH to Watchlist: View: Get Complete ZH Trend Analysis ➞ | |
 | JFIN Jiayin Group Inc. |
| Sector: Technology | |
| SubSector: Internet Information Providers | |
| MarketCap: 131.48 Millions | |
| Recent Price: 6.36 Smart Investing & Trading Score: 36 | |
| Day Percent Change: -0.24% Day Change: -0.01 | |
| Week Change: -1.63% Year-to-date Change: 22.7% | |
| JFIN Links: Profile News Message Board | |
| Charts:- Daily , Weekly | |
| Add JFIN to Watchlist: View: Get Complete JFIN Trend Analysis ➞ | |
 | XYF X Financial |
| Sector: Financials | |
| SubSector: Credit Services | |
| MarketCap: 168.008 Millions | |
| Recent Price: 3.78 Smart Investing & Trading Score: 10 | |
| Day Percent Change: -0.26% Day Change: -0.01 | |
| Week Change: -0.26% Year-to-date Change: 3.3% | |
| XYF Links: Profile News Message Board | |
| Charts:- Daily , Weekly | |
| Add XYF to Watchlist: View: Get Complete XYF Trend Analysis ➞ | |
 | EDTK Skillful Craftsman Education Technology Limited |
| Sector: Consumer Staples | |
| SubSector: Education & Training Services | |
| MarketCap: 32347 Millions | |
| Recent Price: 0.92 Smart Investing & Trading Score: 18 | |
| Day Percent Change: -0.27% Day Change: 0.00 | |
| Week Change: 0% Year-to-date Change: -27.0% | |
| EDTK Links: Profile News Message Board | |
| Charts:- Daily , Weekly | |
| Add EDTK to Watchlist: View: Get Complete EDTK Trend Analysis ➞ | |
 | RERE ATRenew Inc. |
| Sector: Services & Goods | |
| SubSector: Internet Retail | |
| MarketCap: 672 Millions | |
| Recent Price: 1.59 Smart Investing & Trading Score: 36 | |
| Day Percent Change: -0.31% Day Change: -0.01 | |
| Week Change: -8.91% Year-to-date Change: -16.1% | |
| RERE Links: Profile News Message Board | |
| Charts:- Daily , Weekly | |
| Add RERE to Watchlist: View: Get Complete RERE Trend Analysis ➞ | |
 | BZ Kanzhun Limited |
| Sector: Industrials | |
| SubSector: Staffing & Employment Services | |
| MarketCap: 6680 Millions | |
| Recent Price: 18.02 Smart Investing & Trading Score: 51 | |
| Day Percent Change: -0.50% Day Change: -0.09 | |
| Week Change: -3.82% Year-to-date Change: 9.1% | |
| BZ Links: Profile News Message Board | |
| Charts:- Daily , Weekly | |
| Add BZ to Watchlist: View: Get Complete BZ Trend Analysis ➞ | |
 | IMAB I Mab |
| Sector: Health Care | |
| SubSector: Biotechnology | |
| MarketCap: 26187 Millions | |
| Recent Price: 1.80 Smart Investing & Trading Score: 48 | |
| Day Percent Change: -0.55% Day Change: -0.01 | |
| Week Change: -0.55% Year-to-date Change: -5.3% | |
| IMAB Links: Profile News Message Board | |
| Charts:- Daily , Weekly | |
| Add IMAB to Watchlist: View: Get Complete IMAB Trend Analysis ➞ | |
 | HCM Hutchison China MediTech Limited |
| Sector: Health Care | |
| SubSector: Drug Manufacturers - Major | |
| MarketCap: 2324.43 Millions | |
| Recent Price: 16.36 Smart Investing & Trading Score: 31 | |
| Day Percent Change: -0.55% Day Change: -0.09 | |
| Week Change: -8.5% Year-to-date Change: -9.7% | |
| HCM Links: Profile News Message Board | |
| Charts:- Daily , Weekly | |
| Add HCM to Watchlist: View: Get Complete HCM Trend Analysis ➞ | |
 | AIXI Xiao-I Corporation |
| Sector: Technology | |
| SubSector: Software - Application | |
| MarketCap: 431 Millions | |
| Recent Price: 1.49 Smart Investing & Trading Score: 10 | |
| Day Percent Change: -0.67% Day Change: -0.01 | |
| Week Change: -11.31% Year-to-date Change: -33.8% | |
| AIXI Links: Profile News Message Board | |
| Charts:- Daily , Weekly | |
| Add AIXI to Watchlist: View: Get Complete AIXI Trend Analysis ➞ | |
 | FENG Phoenix New Media Limited |
| Sector: Technology | |
| SubSector: Internet Information Providers | |
| MarketCap: 107.08 Millions | |
| Recent Price: 1.88 Smart Investing & Trading Score: 44 | |
| Day Percent Change: -0.79% Day Change: -0.01 | |
| Week Change: -7.64% Year-to-date Change: 37.9% | |
| FENG Links: Profile News Message Board | |
| Charts:- Daily , Weekly | |
| Add FENG to Watchlist: View: Get Complete FENG Trend Analysis ➞ | |
 | WDH Waterdrop Inc. |
| Sector: Financials | |
| SubSector: Insurance - Diversified | |
| MarketCap: 874 Millions | |
| Recent Price: 1.22 Smart Investing & Trading Score: 53 | |
| Day Percent Change: -0.81% Day Change: -0.01 | |
| Week Change: -2.4% Year-to-date Change: 16.5% | |
| WDH Links: Profile News Message Board | |
| Charts:- Daily , Weekly | |
| Add WDH to Watchlist: View: Get Complete WDH Trend Analysis ➞ | |
 | YSG Yatsen Holding Limited |
| Sector: Services & Goods | |
| SubSector: Specialty Retail | |
| MarketCap: 11827 Millions | |
| Recent Price: 3.58 Smart Investing & Trading Score: 83 | |
| Day Percent Change: -0.83% Day Change: -0.03 | |
| Week Change: 18.94% Year-to-date Change: 389.3% | |
| YSG Links: Profile News Message Board | |
| Charts:- Daily , Weekly | |
| Add YSG to Watchlist: View: Get Complete YSG Trend Analysis ➞ | |
 | DDL Dingdong (Cayman) Limited |
| Sector: Consumer Staples | |
| SubSector: Grocery Stores | |
| MarketCap: 708 Millions | |
| Recent Price: 1.12 Smart Investing & Trading Score: 5 | |
| Day Percent Change: -0.88% Day Change: -0.01 | |
| Week Change: -7.44% Year-to-date Change: -26.3% | |
| DDL Links: Profile News Message Board | |
| Charts:- Daily , Weekly | |
| Add DDL to Watchlist: View: Get Complete DDL Trend Analysis ➞ | |
 | QD Qudian Inc. |
| Sector: Technology | |
| SubSector: Information Technology Services | |
| MarketCap: 544.968 Millions | |
| Recent Price: 2.25 Smart Investing & Trading Score: 26 | |
| Day Percent Change: -0.88% Day Change: -0.02 | |
| Week Change: -7.02% Year-to-date Change: 10.3% | |
| QD Links: Profile News Message Board | |
| Charts:- Daily , Weekly | |
| Add QD to Watchlist: View: Get Complete QD Trend Analysis ➞ | |
 | SOHU Sohu.com Limited |
| Sector: Technology | |
| SubSector: Internet Information Providers | |
| MarketCap: 243.48 Millions | |
| Recent Price: 10.91 Smart Investing & Trading Score: 51 | |
| Day Percent Change: -0.91% Day Change: -0.10 | |
| Week Change: -4.55% Year-to-date Change: 9.9% | |
| SOHU Links: Profile News Message Board | |
| Charts:- Daily , Weekly | |
| Add SOHU to Watchlist: View: Get Complete SOHU Trend Analysis ➞ | |
 | NIU Niu Technologies |
| Sector: Consumer Staples | |
| SubSector: Auto Manufacturers - Major | |
| MarketCap: 543.271 Millions | |
| Recent Price: 2.03 Smart Investing & Trading Score: 61 | |
| Day Percent Change: -0.98% Day Change: -0.02 | |
| Week Change: -7.73% Year-to-date Change: -7.3% | |
| NIU Links: Profile News Message Board | |
| Charts:- Daily , Weekly | |
| Add NIU to Watchlist: View: Get Complete NIU Trend Analysis ➞ | |
| For tabular summary view of above stock list: Summary View ➞ 0 - 25 , 25 - 50 , 50 - 75 , 75 - 100 , 100 - 125 , 125 - 150 | ||
| Click To Change The Sort Order: By Market Cap or Company Size Performance: Year-to-date, Week and Day | |
| Select Chart Type: | ||
|
Best Stocks Today 12Stocks.com |
© 2024 12Stocks.com Terms & Conditions Privacy Contact Us
All Information Provided Only For Education And Not To Be Used For Investing or Trading. See Terms & Conditions


One More Thing ... Get Best Stocks Delivered Daily!
Never Ever Miss A Move With Our Top Ten Stocks Lists
Find Best Stocks In Any Market - Bull or Bear Market
Take A Peek At Our Top Ten Stocks Lists: Daily, Weekly, Year-to-Date & Top Trends
Find Best Stocks In Any Market - Bull or Bear Market
Take A Peek At Our Top Ten Stocks Lists: Daily, Weekly, Year-to-Date & Top Trends
China Stocks With Best Up Trends [0-bearish to 100-bullish]: Zhongchao [100], GigaCloud [100], Smart Share[93], DouYu [90], So-Young [88], GDS [88], JOYY [88], U Power[83], Tencent Music[83], Lufax Holding[83], Yatsen Holding[83]
Best China Stocks Year-to-Date:
U Power[2874.33%], Zhongchao [825.77%], DouYu [745.26%], MicroCloud Hologram[734.53%], China Liberal[459.28%], Yatsen Holding[389.34%], Uxin [136.8%], QuantaSing [112.65%], GigaCloud [100.82%], Yiren Digital[55.45%], Bright Scholar[50.4%] Best China Stocks This Week:
Zhongchao [106.1%], Regencell Bioscience[37.01%], Yatsen Holding[18.94%], TH [18.18%], Secoo Holding[11.83%], Smart Share[9.93%], GigaCloud [8.8%], EHang [8.29%], Momo [7.17%], SunCar [7%], Quhuo [6.85%] Best China Stocks Daily:
Zhongchao [146.72%], MicroCloud Hologram[30.04%], TH [25.00%], Golden Heaven[21.20%], Regencell Bioscience[10.20%], MingZhu Logistics[9.54%], Secoo Holding[9.32%], Cheetah Mobile[9.06%], Quhuo [8.36%], U Power[8.11%], 17 Education[7.05%]