
 Login Sign Up


| |||||
 |  | ||||

| 12Stocks.com Market Intelligence |
Best Biotech Stocks
|
|
| Quick Read: Best Biotech Stocks List By Performances & Trends: Daily, Weekly, Year-to-Date, Market Cap (Size) & Technical Trends | |||
| Best Biotech Stocks Views: Quick Browse View, Summary & Slide Show View | |||
| 12Stocks.com Biotech Stocks Performances & Trends Daily | |||||||||
|
|  The overall market intelligence score is 50 (0-bearish to 100-bullish) which puts Biotech sector in short term neutral trend. The market intelligence score from previous trading session is 49 and hence an improvement of trend.
| ||||||||
Here are the market intelligence trend scores of the most requested Biotech stocks at 12Stocks.com (click stock name for detailed review):
|


| 12Stocks.com: Investing in Biotech sector with Stocks | |
|
The following table helps investors and traders sort through current performance and trends (as measured by market intelligence score) of various
stocks in the Biotech sector. Quick View: Move mouse or cursor over stock symbol (ticker) to view short-term Technical chart and over stock name to view long term chart. Click on  to add stock symbol to your watchlist and to add stock symbol to your watchlist and  to view watchlist. Click on any ticker or stock name for detailed market intelligence report for that stock. to view watchlist. Click on any ticker or stock name for detailed market intelligence report for that stock. |
12Stocks.com Performance of Stocks in Biotech Sector
| Ticker | Stock Name | Watchlist | Category | Recent Price | Market Intelligence Score | Change % | YTD Change% |
| SNDX | Syndax |   | Biotechnology | 21.87 | 57 | -0.46 | 1.20% |
| ILMN | Illumina | | Biotechnology | 124.10 | 52 | -0.47 | -10.87% |
| KALV | KalVista | | Biotechnology | 12.12 | 57 | -0.49 | -1.06% |
| AVIR | Atea | | Biotechnology | 3.83 | 47 | -0.52 | 25.57% |
| VRTX | Vertex | | Biotechnology | 399.98 | 57 | -0.54 | -1.70% |
| MIRM | Mirum | | Biotechnology | 25.58 | 52 | -0.54 | -13.35% |
| EWTX | Edgewise | | Biotechnology | 18.89 | 83 | -0.61 | 66.43% |
| ALKS | Alkermes | | Biotechnology | 23.86 | 0 | -0.62 | -13.99% |
| OCS | Oculis Holding | | Biotechnology | 12.81 | 66 | -0.62 | 15.40% |
| RVNC | Revance | | Biotechnology | 3.77 | 39 | -0.66 | -57.11% |
| AUPH | Aurinia | | Biotechnology | 5.17 | 74 | -0.67 | -42.55% |
| GHRS | GH Research | | Biotechnology | 11.83 | 88 | -0.67 | 115.88% |
| CRBU | Caribou | | Biotechnology | 3.65 | 15 | -0.68 | -35.99% |
| BHVN | Biohaven | | Biotechnology | 39.90 | 25 | -0.70 | -6.78% |
| PASG | Passage Bio | | Biotechnology | 1.34 | 52 | -0.74 | 32.67% |
| RAPT | RAPT | | Biotechnology | 8.12 | 49 | -0.79 | -67.34% |
| AXSM | Axsome | | Biotechnology | 74.28 | 45 | -0.81 | -6.67% |
| APTO | Aptose | | Biotechnology | 1.20 | 20 | -0.83 | -52.76% |
| BLUE | bluebird bio | | Biotechnology | 0.90 | 22 | -0.85 | -34.67% |
| RNA | Avidity | | Biotechnology | 25.58 | 90 | -0.85 | 182.96% |
| INBX | Inhibrx | | Biotechnology | 34.01 | 24 | -0.85 | -10.52% |
| VKTX | Viking | | Biotechnology | 75.77 | 40 | -0.86 | 307.15% |
| JAZZ | Jazz | | Biotechnology | 109.34 | 52 | -0.88 | -11.11% |
| PHVS | Pharvaris N.V | | Biotechnology | 24.16 | 71 | -0.88 | -14.70% |
| VERA | Vera | | Biotechnology | 41.91 | 44 | -0.95 | 170.74% |
| To view more stocks, click on Next / Previous arrows or select different range: 0 - 25 , 25 - 50 , 50 - 75 , 75 - 100 , 100 - 125 , 125 - 150 , 150 - 175 , 175 - 200 , 200 - 225 , 225 - 250 , 250 - 275 , 275 - 300 , 300 - 325 , 325 - 350 , 350 - 375 , 375 - 400 | ||
 | Click To Change The Sort Order: By Market Cap or Company Size Performance: Year-to-date, Week and Day |  |
|
Get the most comprehensive stock market coverage daily at 12Stocks.com ➞ Best Stocks Today ➞ Best Stocks Weekly ➞ Best Stocks Year-to-Date ➞ Best Stocks Trends ➞  Best Stocks Today 12Stocks.com Best Nasdaq Stocks ➞ Best S&P 500 Stocks ➞ Best Tech Stocks ➞ Best Biotech Stocks ➞ |
| Detailed Overview of Biotech Stocks |
| Biotech Technical Overview, Leaders & Laggards, Top Biotech ETF Funds & Detailed Biotech Stocks List, Charts, Trends & More |
| Biotech Sector: Technical Analysis, Trends & YTD Performance | |
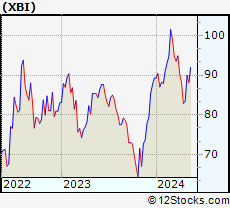
| Biotech sector, as represented by XBI, an exchange-traded fund [ETF] that holds basket of Biotech stocks (e.g, Amgen, Celgene) is down by -1.06% and is currently underperforming the overall market by -6.68% year-to-date. Below is a quick view of Technical charts and trends: | |
 XBI Weekly Chart |
|
| Long Term Trend: Not Good | |
| Medium Term Trend: Deteriorating | |
 XBI Daily Chart |
|
| Short Term Trend: Very Good | |
| Overall Trend Score: 50 | |
| YTD Performance: -1.06% | |
| **Trend Scores & Views Are Only For Educational Purposes And Not For Investing | |
| 12Stocks.com: Top Performing Biotech Sector Stocks | ||||||||||||||||||||||||||||||||||||||||||||||||
 The top performing Biotech sector stocks year to date are
Now, more recently, over last week, the top performing Biotech sector stocks on the move are


|
||||||||||||||||||||||||||||||||||||||||||||||||
| 12Stocks.com: Investing in Biotech Sector using Exchange Traded Funds | |
|
The following table shows list of key exchange traded funds (ETF) that
help investors track Biotech Index. For detailed view, check out our ETF Funds section of our website. Quick View: Move mouse or cursor over ETF symbol (ticker) to view short-term Technical chart and over ETF name to view long term chart. Click on ticker or stock name for detailed view. Click on to add stock symbol to your watchlist and to view watchlist. |
12Stocks.com List of ETFs that track Biotech Index
| Ticker | ETF Name | Watchlist | Recent Price | Market Intelligence Score | Change % | Week % | Year-to-date % |
| XBI | Biotech | | 88.34 | 50 | 1.16 | 5.81 | -1.06% |
| LABD | Biotech Bear 3X | | 8.76 | 44 | -2.99 | -16.73 | -9.6% |
| IBB | Biotechnology | | 130.64 | 64 | 0.89 | 3.28 | -3.84% |
| LABU | Biotech Bull 3X | | 102.99 | 42 | 3.19 | 17.69 | -15.56% |
| IYH | Healthcare | | 59.12 | 37 | -0.10 | 0.87 | 3.27% |
| IHF | Healthcare Providers | | 51.64 | 15 | 0.39 | -0.54 | -1.66% |
| IXJ | Global Healthcare | | 89.41 | 37 | -0.17 | 0.33 | 3.1% |
| CURE | Healthcare Bull 3X | | 105.11 | 40 | -1.36 | -0.19 | 3.31% |
| FBT | First NYSE | | 147.18 | 29 | 0.79 | 2.46 | -6.88% |
| BIB | Biotechnology | | 52.58 | 57 | 0.00 | 5.88 | -7.84% |
| PBE | Biotech & Genome | | 63.57 | 44 | 1.13 | 5.28 | -3.45% |
| PTH | DWA Healthcare Momentum | | 41.27 | 22 | 0.00 | 3.46 | 5.44% |
| BBH | Biotech | | 160.51 | 64 | 1.18 | 3.12 | -2.9% |
| BIS | Short Biotech | | 18.61 | 36 | -2.62 | -7.96 | 2.99% |
| BBC | Bio Biotechnology Clinical | | 27.15 | 42 | 0.20 | 6.35 | 11.03% |
| BTEC | Principal Healthcare Innovators | | 35.90 | 42 | 0.00 | 4.81 | -1.19% |
| BBP | Bio Biotechnology Products | | 54.35 | 45 | 0.00 | 5.56 | -6.45% |
| 12Stocks.com: Charts, Trends, Fundamental Data and Performances of Biotech Stocks | |
|
We now take in-depth look at all Biotech stocks including charts, multi-period performances and overall trends (as measured by market intelligence score). One can sort Biotech stocks (click link to choose) by Daily, Weekly and by Year-to-Date performances. Also, one can sort by size of the company or by market capitalization. |
| Select Your Default Chart Type: | |||||
| |||||
| Click on stock symbol or name for detailed view. Click on to add stock symbol to your watchlist and to view watchlist. Quick View: Move mouse or cursor over "Daily" to quickly view daily Technical stock chart and over "Weekly" to view weekly Technical stock chart. | |||||

 | SNDX Syndax Pharmaceuticals, Inc. |
| Sector: Health Care | |
| SubSector: Biotechnology | |
| MarketCap: 365.985 Millions | |
| Recent Price: 21.87 Market Intelligence Score: 57 | |
| Day Percent Change: -0.46% Day Change: -0.10 | |
| Week Change: 3.85% Year-to-date Change: 1.2% | |
| SNDX Links: Profile News Message Board | |
| Charts:- Daily , Weekly | |
| Add SNDX to Watchlist: View: Get Complete SNDX Trend Analysis ➞ | |
 | ILMN Illumina, Inc. |
| Sector: Health Care | |
| SubSector: Biotechnology | |
| MarketCap: 39194.3 Millions | |
| Recent Price: 124.10 Market Intelligence Score: 52 | |
| Day Percent Change: -0.47% Day Change: -0.58 | |
| Week Change: 1.49% Year-to-date Change: -10.9% | |
| ILMN Links: Profile News Message Board | |
| Charts:- Daily , Weekly | |
| Add ILMN to Watchlist: View: Get Complete ILMN Trend Analysis ➞ | |
 | KALV KalVista Pharmaceuticals, Inc. |
| Sector: Health Care | |
| SubSector: Biotechnology | |
| MarketCap: 138.385 Millions | |
| Recent Price: 12.12 Market Intelligence Score: 57 | |
| Day Percent Change: -0.49% Day Change: -0.06 | |
| Week Change: 12.43% Year-to-date Change: -1.1% | |
| KALV Links: Profile News Message Board | |
| Charts:- Daily , Weekly | |
| Add KALV to Watchlist: View: Get Complete KALV Trend Analysis ➞ | |
 | AVIR Atea Pharmaceuticals, Inc. |
| Sector: Health Care | |
| SubSector: Biotechnology | |
| MarketCap: 22587 Millions | |
| Recent Price: 3.83 Market Intelligence Score: 47 | |
| Day Percent Change: -0.52% Day Change: -0.02 | |
| Week Change: 3.23% Year-to-date Change: 25.6% | |
| AVIR Links: Profile News Message Board | |
| Charts:- Daily , Weekly | |
| Add AVIR to Watchlist: View: Get Complete AVIR Trend Analysis ➞ | |
 | VRTX Vertex Pharmaceuticals Incorporated |
| Sector: Health Care | |
| SubSector: Biotechnology | |
| MarketCap: 57669.6 Millions | |
| Recent Price: 399.98 Market Intelligence Score: 57 | |
| Day Percent Change: -0.54% Day Change: -2.16 | |
| Week Change: 0.63% Year-to-date Change: -1.7% | |
| VRTX Links: Profile News Message Board | |
| Charts:- Daily , Weekly | |
| Add VRTX to Watchlist: View: Get Complete VRTX Trend Analysis ➞ | |
 | MIRM Mirum Pharmaceuticals, Inc. |
| Sector: Health Care | |
| SubSector: Biotechnology | |
| MarketCap: 309.585 Millions | |
| Recent Price: 25.58 Market Intelligence Score: 52 | |
| Day Percent Change: -0.54% Day Change: -0.14 | |
| Week Change: 4.58% Year-to-date Change: -13.4% | |
| MIRM Links: Profile News Message Board | |
| Charts:- Daily , Weekly | |
| Add MIRM to Watchlist: View: Get Complete MIRM Trend Analysis ➞ | |
 | EWTX Edgewise Therapeutics, Inc. |
| Sector: Health Care | |
| SubSector: Biotechnology | |
| MarketCap: 492 Millions | |
| Recent Price: 18.89 Market Intelligence Score: 83 | |
| Day Percent Change: -0.61% Day Change: -0.11 | |
| Week Change: 16.79% Year-to-date Change: 66.4% | |
| EWTX Links: Profile News Message Board | |
| Charts:- Daily , Weekly | |
| Add EWTX to Watchlist: View: Get Complete EWTX Trend Analysis ➞ | |
 | ALKS Alkermes plc |
| Sector: Health Care | |
| SubSector: Biotechnology | |
| MarketCap: 2311.95 Millions | |
| Recent Price: 23.86 Market Intelligence Score: 0 | |
| Day Percent Change: -0.62% Day Change: -0.15 | |
| Week Change: -3.32% Year-to-date Change: -14.0% | |
| ALKS Links: Profile News Message Board | |
| Charts:- Daily , Weekly | |
| Add ALKS to Watchlist: View: Get Complete ALKS Trend Analysis ➞ | |
 | OCS Oculis Holding AG |
| Sector: Health Care | |
| SubSector: Biotechnology | |
| MarketCap: 460 Millions | |
| Recent Price: 12.81 Market Intelligence Score: 66 | |
| Day Percent Change: -0.62% Day Change: -0.08 | |
| Week Change: 6.57% Year-to-date Change: 15.4% | |
| OCS Links: Profile News Message Board | |
| Charts:- Daily , Weekly | |
| Add OCS to Watchlist: View: Get Complete OCS Trend Analysis ➞ | |
 | RVNC Revance Therapeutics, Inc. |
| Sector: Health Care | |
| SubSector: Biotechnology | |
| MarketCap: 854.185 Millions | |
| Recent Price: 3.77 Market Intelligence Score: 39 | |
| Day Percent Change: -0.66% Day Change: -0.02 | |
| Week Change: 10.88% Year-to-date Change: -57.1% | |
| RVNC Links: Profile News Message Board | |
| Charts:- Daily , Weekly | |
| Add RVNC to Watchlist: View: Get Complete RVNC Trend Analysis ➞ | |
 | AUPH Aurinia Pharmaceuticals Inc. |
| Sector: Health Care | |
| SubSector: Biotechnology | |
| MarketCap: 1319.75 Millions | |
| Recent Price: 5.17 Market Intelligence Score: 74 | |
| Day Percent Change: -0.67% Day Change: -0.04 | |
| Week Change: 5.19% Year-to-date Change: -42.6% | |
| AUPH Links: Profile News Message Board | |
| Charts:- Daily , Weekly | |
| Add AUPH to Watchlist: View: Get Complete AUPH Trend Analysis ➞ | |
 | GHRS GH Research PLC |
| Sector: Health Care | |
| SubSector: Biotechnology | |
| MarketCap: 614 Millions | |
| Recent Price: 11.83 Market Intelligence Score: 88 | |
| Day Percent Change: -0.67% Day Change: -0.08 | |
| Week Change: 12.45% Year-to-date Change: 115.9% | |
| GHRS Links: Profile News Message Board | |
| Charts:- Daily , Weekly | |
| Add GHRS to Watchlist: View: Get Complete GHRS Trend Analysis ➞ | |
 | CRBU Caribou Biosciences, Inc. |
| Sector: Health Care | |
| SubSector: Biotechnology | |
| MarketCap: 258 Millions | |
| Recent Price: 3.65 Market Intelligence Score: 15 | |
| Day Percent Change: -0.68% Day Change: -0.03 | |
| Week Change: -1.48% Year-to-date Change: -36.0% | |
| CRBU Links: Profile News Message Board | |
| Charts:- Daily , Weekly | |
| Add CRBU to Watchlist: View: Get Complete CRBU Trend Analysis ➞ | |
 | BHVN Biohaven Pharmaceutical Holding Company Ltd. |
| Sector: Health Care | |
| SubSector: Biotechnology | |
| MarketCap: 2024.25 Millions | |
| Recent Price: 39.90 Market Intelligence Score: 25 | |
| Day Percent Change: -0.70% Day Change: -0.28 | |
| Week Change: 2.39% Year-to-date Change: -6.8% | |
| BHVN Links: Profile News Message Board | |
| Charts:- Daily , Weekly | |
| Add BHVN to Watchlist: View: Get Complete BHVN Trend Analysis ➞ | |
 | PASG Passage Bio, Inc. |
| Sector: Health Care | |
| SubSector: Biotechnology | |
| MarketCap: 12787 Millions | |
| Recent Price: 1.34 Market Intelligence Score: 52 | |
| Day Percent Change: -0.74% Day Change: -0.01 | |
| Week Change: 1.52% Year-to-date Change: 32.7% | |
| PASG Links: Profile News Message Board | |
| Charts:- Daily , Weekly | |
| Add PASG to Watchlist: View: Get Complete PASG Trend Analysis ➞ | |
 | RAPT RAPT Therapeutics, Inc. |
| Sector: Health Care | |
| SubSector: Biotechnology | |
| MarketCap: 368.785 Millions | |
| Recent Price: 8.12 Market Intelligence Score: 49 | |
| Day Percent Change: -0.79% Day Change: -0.06 | |
| Week Change: 0.19% Year-to-date Change: -67.3% | |
| RAPT Links: Profile News Message Board | |
| Charts:- Daily , Weekly | |
| Add RAPT to Watchlist: View: Get Complete RAPT Trend Analysis ➞ | |
 | AXSM Axsome Therapeutics, Inc. |
| Sector: Health Care | |
| SubSector: Biotechnology | |
| MarketCap: 2284.25 Millions | |
| Recent Price: 74.28 Market Intelligence Score: 45 | |
| Day Percent Change: -0.81% Day Change: -0.61 | |
| Week Change: 3.58% Year-to-date Change: -6.7% | |
| AXSM Links: Profile News Message Board | |
| Charts:- Daily , Weekly | |
| Add AXSM to Watchlist: View: Get Complete AXSM Trend Analysis ➞ | |
 | APTO Aptose Biosciences Inc. |
| Sector: Health Care | |
| SubSector: Biotechnology | |
| MarketCap: 484.585 Millions | |
| Recent Price: 1.20 Market Intelligence Score: 20 | |
| Day Percent Change: -0.83% Day Change: -0.01 | |
| Week Change: -1.64% Year-to-date Change: -52.8% | |
| APTO Links: Profile News Message Board | |
| Charts:- Daily , Weekly | |
| Add APTO to Watchlist: View: Get Complete APTO Trend Analysis ➞ | |
 | BLUE bluebird bio, Inc. |
| Sector: Health Care | |
| SubSector: Biotechnology | |
| MarketCap: 3365.05 Millions | |
| Recent Price: 0.90 Market Intelligence Score: 22 | |
| Day Percent Change: -0.85% Day Change: -0.01 | |
| Week Change: -2.3% Year-to-date Change: -34.7% | |
| BLUE Links: Profile News Message Board | |
| Charts:- Daily , Weekly | |
| Add BLUE to Watchlist: View: Get Complete BLUE Trend Analysis ➞ | |
 | RNA Avidity Biosciences, Inc. |
| Sector: Health Care | |
| SubSector: Biotechnology | |
| MarketCap: 12287 Millions | |
| Recent Price: 25.58 Market Intelligence Score: 90 | |
| Day Percent Change: -0.85% Day Change: -0.22 | |
| Week Change: 5.01% Year-to-date Change: 183.0% | |
| RNA Links: Profile News Message Board | |
| Charts:- Daily , Weekly | |
| Add RNA to Watchlist: View: Get Complete RNA Trend Analysis ➞ | |
 | INBX Inhibrx, Inc. |
| Sector: Health Care | |
| SubSector: Biotechnology | |
| MarketCap: 14187 Millions | |
| Recent Price: 34.01 Market Intelligence Score: 24 | |
| Day Percent Change: -0.85% Day Change: -0.29 | |
| Week Change: -0.15% Year-to-date Change: -10.5% | |
| INBX Links: Profile News Message Board | |
| Charts:- Daily , Weekly | |
| Add INBX to Watchlist: View: Get Complete INBX Trend Analysis ➞ | |
 | VKTX Viking Therapeutics, Inc. |
| Sector: Health Care | |
| SubSector: Biotechnology | |
| MarketCap: 388.585 Millions | |
| Recent Price: 75.77 Market Intelligence Score: 40 | |
| Day Percent Change: -0.86% Day Change: -0.66 | |
| Week Change: 1.96% Year-to-date Change: 307.2% | |
| VKTX Links: Profile News Message Board | |
| Charts:- Daily , Weekly | |
| Add VKTX to Watchlist: View: Get Complete VKTX Trend Analysis ➞ | |
 | JAZZ Jazz Pharmaceuticals plc |
| Sector: Health Care | |
| SubSector: Biotechnology | |
| MarketCap: 5576.05 Millions | |
| Recent Price: 109.34 Market Intelligence Score: 52 | |
| Day Percent Change: -0.88% Day Change: -0.97 | |
| Week Change: -0.11% Year-to-date Change: -11.1% | |
| JAZZ Links: Profile News Message Board | |
| Charts:- Daily , Weekly | |
| Add JAZZ to Watchlist: View: Get Complete JAZZ Trend Analysis ➞ | |
 | PHVS Pharvaris N.V. |
| Sector: Health Care | |
| SubSector: Biotechnology | |
| MarketCap: 475 Millions | |
| Recent Price: 24.16 Market Intelligence Score: 71 | |
| Day Percent Change: -0.88% Day Change: -0.21 | |
| Week Change: 3.47% Year-to-date Change: -14.7% | |
| PHVS Links: Profile News Message Board | |
| Charts:- Daily , Weekly | |
| Add PHVS to Watchlist: View: Get Complete PHVS Trend Analysis ➞ | |
 | VERA Vera Therapeutics, Inc. |
| Sector: Health Care | |
| SubSector: Biotechnology | |
| MarketCap: 746 Millions | |
| Recent Price: 41.91 Market Intelligence Score: 44 | |
| Day Percent Change: -0.95% Day Change: -0.40 | |
| Week Change: 5.65% Year-to-date Change: 170.7% | |
| VERA Links: Profile News Message Board | |
| Charts:- Daily , Weekly | |
| Add VERA to Watchlist: View: Get Complete VERA Trend Analysis ➞ | |
| To view more stocks, click on Next / Previous arrows or select different range: 0 - 25 , 25 - 50 , 50 - 75 , 75 - 100 , 100 - 125 , 125 - 150 , 150 - 175 , 175 - 200 , 200 - 225 , 225 - 250 , 250 - 275 , 275 - 300 , 300 - 325 , 325 - 350 , 350 - 375 , 375 - 400 | ||
| Click To Change The Sort Order: By Market Cap or Company Size Performance: Year-to-date, Week and Day | |
| Select Chart Type: | ||
|
Best Stocks Today 12Stocks.com |
© 2024 12Stocks.com Terms & Conditions Privacy Contact Us
All Information Provided Only For Education And Not To Be Used For Investing or Trading. See Terms & Conditions


One More Thing ... Get Best Stocks Delivered Daily!
Never Ever Miss A Move With Our Top Ten Stocks Lists
Find Best Stocks In Any Market - Bull or Bear Market
Take A Peek At Our Top Ten Stocks Lists: Daily, Weekly, Year-to-Date & Top Trends
Find Best Stocks In Any Market - Bull or Bear Market
Take A Peek At Our Top Ten Stocks Lists: Daily, Weekly, Year-to-Date & Top Trends
Biotech Stocks With Best Up Trends [0-bearish to 100-bullish]: Emergent Bio[100], Blueprint Medicines[100], Corcept [100], Anika [100], Bio-Techne [100], Agios [100], Reneo [100], United [100], Mesoblast [100], AnaptysBio [100], Revolution Medicines[100]
Best Biotech Stocks Year-to-Date:
Pieris [6064.83%], Avenue [2924.84%], Precision [2842.47%], Inovio [2249.02%], Assembly [1493.71%], Agenus [1414.68%], NuCana [1245.5%], Adverum nologies[1228.37%], Affimed N.V[740%], Mesoblast [562.73%], Corbus [533.61%] Best Biotech Stocks This Week:
CytomX [182.08%], Deciphera [73.17%], Emergent Bio[71.88%], Cue Biopharma[36.26%], Seres [33.33%], Poseida [31.22%], Exscientia [26.77%], Personalis [26.48%], Wave Life[26.18%], Nektar [26.14%], Codexis [25.56%] Best Biotech Stocks Daily:
Emergent Bio[70.98%], Orchestra BioMed[18.83%], Ocular Therapeutix[16.53%], Cellectis S.A[14.75%], Blueprint Medicines[12.75%], Moderna [12.70%], Mustang Bio[12.65%], Black Diamond[11.53%], EyePoint [10.53%], iBio [9.73%], Omeros [9.71%]