
 Login Sign Up


| |||||
 |  | ||||

| 12Stocks.com Market Intelligence |
Best Biotech Stocks
|
|
| Quick Read: Best Biotech Stocks List By Performances & Trends: Daily, Weekly, Year-to-Date, Market Cap (Size) & Technical Trends | |||
| Best Biotech Stocks Views: Quick Browse View, Summary & Slide Show View | |||
| 12Stocks.com Biotech Stocks Performances & Trends Daily | |||||||||
|
|  The overall market intelligence score is 10 (0-bearish to 100-bullish) which puts Biotech sector in short term bearish trend. The market intelligence score from previous trading session is 0 and hence an improvement of trend.
| ||||||||
Here are the market intelligence trend scores of the most requested Biotech stocks at 12Stocks.com (click stock name for detailed review):
|


| 12Stocks.com: Investing in Biotech sector with Stocks | |
|
The following table helps investors and traders sort through current performance and trends (as measured by market intelligence score) of various
stocks in the Biotech sector. Quick View: Move mouse or cursor over stock symbol (ticker) to view short-term Technical chart and over stock name to view long term chart. Click on  to add stock symbol to your watchlist and to add stock symbol to your watchlist and  to view watchlist. Click on any ticker or stock name for detailed market intelligence report for that stock. to view watchlist. Click on any ticker or stock name for detailed market intelligence report for that stock. |
12Stocks.com Performance of Stocks in Biotech Sector
| Ticker | Stock Name | Watchlist | Category | Recent Price | Market Intelligence Score | Change % | YTD Change% |
| CRNX | Crinetics |   | Biotechnology | 42.98 | 41 | -0.07 | 20.80% |
| XOMAO | XOMA | | Biotechnology | 25.09 | 48 | -0.08 | 0.40% |
| FUSN | Fusion | | Biotechnology | 21.22 | 61 | -0.09 | 121.04% |
| DAWN | Day One | | Biotechnology | 14.96 | 55 | -0.13 | 1.84% |
| TECH | Bio-Techne | | Biotechnology | 62.12 | 27 | -0.14 | -19.49% |
| RPTX | Repare | | Biotechnology | 3.02 | 10 | -0.17 | -58.63% |
| GBIO | Generation Bio | | Biotechnology | 2.77 | 36 | -0.18 | 67.88% |
| XCUR | Exicure | | Biotechnology | 0.58 | 53 | -0.22 | 0.38% |
| PLRX | Pliant | | Biotechnology | 12.20 | 0 | -0.25 | -32.67% |
| RVNC | Revance | | Biotechnology | 3.78 | 27 | -0.26 | -57.00% |
| VCEL | Vericel | | Biotechnology | 43.74 | 26 | -0.27 | 22.83% |
| KZR | Kezar Life | | Biotechnology | 0.79 | 20 | -0.27 | -16.88% |
| SMMT | Summit | | Biotechnology | 3.50 | 0 | -0.28 | 34.10% |
| IMVT | Immunovant | | Biotechnology | 28.24 | 10 | -0.28 | -32.97% |
| AVDL | Avadel | | Biotechnology | 17.33 | 68 | -0.29 | 22.73% |
| KALA | Kala | | Biotechnology | 6.81 | 28 | -0.29 | -2.71% |
| GALT | Galectin | | Biotechnology | 3.37 | 51 | -0.30 | 103.01% |
| IONS | Ionis | | Biotechnology | 40.68 | 10 | -0.32 | -19.59% |
| RYTM | Rhythm | | Biotechnology | 37.98 | 7 | -0.35 | -17.39% |
| ABUS | Arbutus Biopharma | | Biotechnology | 2.72 | 51 | -0.37 | 8.80% |
| NBIX | Neurocrine | | Biotechnology | 132.00 | 18 | -0.41 | 0.18% |
| GRTS | Gritstone Oncology | | Biotechnology | 0.74 | 17 | -0.43 | -63.66% |
| RNA | Avidity | | Biotechnology | 22.93 | 46 | -0.48 | 153.65% |
| MOR | MorphoSys AG | | Biotechnology | 17.96 | 49 | -0.50 | 81.41% |
| GHRS | GH Research | | Biotechnology | 11.03 | 66 | -0.50 | 101.28% |
| To view more stocks, click on Next / Previous arrows or select different range: 0 - 25 , 25 - 50 , 50 - 75 , 75 - 100 , 100 - 125 , 125 - 150 , 150 - 175 , 175 - 200 , 200 - 225 , 225 - 250 , 250 - 275 , 275 - 300 , 300 - 325 , 325 - 350 , 350 - 375 , 375 - 400 | ||
 | Click To Change The Sort Order: By Market Cap or Company Size Performance: Year-to-date, Week and Day |  |
|
Get the most comprehensive stock market coverage daily at 12Stocks.com ➞ Best Stocks Today ➞ Best Stocks Weekly ➞ Best Stocks Year-to-Date ➞ Best Stocks Trends ➞  Best Stocks Today 12Stocks.com Best Nasdaq Stocks ➞ Best S&P 500 Stocks ➞ Best Tech Stocks ➞ Best Biotech Stocks ➞ |
| Detailed Overview of Biotech Stocks |
| Biotech Technical Overview, Leaders & Laggards, Top Biotech ETF Funds & Detailed Biotech Stocks List, Charts, Trends & More |
| Biotech Sector: Technical Analysis, Trends & YTD Performance | |
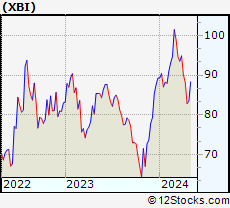
| Biotech sector, as represented by XBI, an exchange-traded fund [ETF] that holds basket of Biotech stocks (e.g, Amgen, Celgene) is down by -7.23% and is currently underperforming the overall market by -10.61% year-to-date. Below is a quick view of Technical charts and trends: | |
 XBI Weekly Chart |
|
| Long Term Trend: Not Good | |
| Medium Term Trend: Not Good | |
 XBI Daily Chart |
|
| Short Term Trend: Not Good | |
| Overall Trend Score: 10 | |
| YTD Performance: -7.23% | |
| **Trend Scores & Views Are Only For Educational Purposes And Not For Investing | |
| 12Stocks.com: Top Performing Biotech Sector Stocks | ||||||||||||||||||||||||||||||||||||||||||||||||
 The top performing Biotech sector stocks year to date are
Now, more recently, over last week, the top performing Biotech sector stocks on the move are


|
||||||||||||||||||||||||||||||||||||||||||||||||
| 12Stocks.com: Investing in Biotech Sector using Exchange Traded Funds | |
|
The following table shows list of key exchange traded funds (ETF) that
help investors track Biotech Index. For detailed view, check out our ETF Funds section of our website. Quick View: Move mouse or cursor over ETF symbol (ticker) to view short-term Technical chart and over ETF name to view long term chart. Click on ticker or stock name for detailed view. Click on to add stock symbol to your watchlist and to view watchlist. |
12Stocks.com List of ETFs that track Biotech Index
| Ticker | ETF Name | Watchlist | Recent Price | Market Intelligence Score | Change % | Week % | Year-to-date % |
| LABD | Biotech Bear 3X | | 10.80 | 100 | 2.66 | 20.27 | 11.46% |
| XBI | Biotech | | 82.83 | 10 | -0.78 | -6.04 | -7.23% |
| LABU | Biotech Bull 3X | | 86.05 | 10 | -2.26 | -17.54 | -29.45% |
| IBB | Biotechnology | | 124.72 | 10 | 0.06 | -3.75 | -8.19% |
| IYH | Healthcare | | 58.16 | 18 | 0.19 | -0.41 | 1.59% |
| IXJ | Global Healthcare | | 87.75 | 25 | 0.39 | -0.26 | 1.19% |
| IHF | Healthcare Providers | | 52.21 | 62 | 1.29 | 3.3 | -0.57% |
| CURE | Healthcare Bull 3X | | 103.33 | 25 | 1.09 | -0.06 | 1.56% |
| FBT | First NYSE | | 141.68 | 10 | 0.11 | -3.83 | -10.36% |
| BIB | Biotechnology | | 48.20 | 10 | 0.54 | -6.21 | -15.51% |
| BIS | Short Biotech | | 20.90 | 95 | 0.14 | 6.61 | 15.63% |
| PTH | DWA Healthcare Momentum | | 39.53 | 23 | -0.10 | -5.5 | 1% |
| BBH | Biotech | | 152.36 | 10 | 0.01 | -3.32 | -7.83% |
| PBE | Biotech & Genome | | 59.85 | 10 | 0.39 | -2.29 | -9.1% |
| BBC | Bio Biotechnology Clinical | | 24.71 | 0 | -3.02 | -8.9 | 1.05% |
| BBP | Bio Biotechnology Products | | 50.43 | 0 | -0.34 | -5.02 | -13.19% |
| BTEC | Principal Healthcare Innovators | | 33.86 | 0 | -0.67 | -5.92 | -6.8% |
| 12Stocks.com: Charts, Trends, Fundamental Data and Performances of Biotech Stocks | |
|
We now take in-depth look at all Biotech stocks including charts, multi-period performances and overall trends (as measured by market intelligence score). One can sort Biotech stocks (click link to choose) by Daily, Weekly and by Year-to-Date performances. Also, one can sort by size of the company or by market capitalization. |
| Select Your Default Chart Type: | |||||
| |||||
| Click on stock symbol or name for detailed view. Click on to add stock symbol to your watchlist and to view watchlist. Quick View: Move mouse or cursor over "Daily" to quickly view daily Technical stock chart and over "Weekly" to view weekly Technical stock chart. | |||||

 | CRNX Crinetics Pharmaceuticals, Inc. |
| Sector: Health Care | |
| SubSector: Biotechnology | |
| MarketCap: 381.085 Millions | |
| Recent Price: 42.98 Market Intelligence Score: 41 | |
| Day Percent Change: -0.07% Day Change: -0.03 | |
| Week Change: -3.61% Year-to-date Change: 20.8% | |
| CRNX Links: Profile News Message Board | |
| Charts:- Daily , Weekly | |
| Add CRNX to Watchlist: View: Get Complete CRNX Trend Analysis ➞ | |
 | XOMAO XOMA Corporation |
| Sector: Health Care | |
| SubSector: Biotechnology | |
| MarketCap: 217 Millions | |
| Recent Price: 25.09 Market Intelligence Score: 48 | |
| Day Percent Change: -0.08% Day Change: -0.02 | |
| Week Change: 0.28% Year-to-date Change: 0.4% | |
| XOMAO Links: Profile News Message Board | |
| Charts:- Daily , Weekly | |
| Add XOMAO to Watchlist: View: Get Complete XOMAO Trend Analysis ➞ | |
 | FUSN Fusion Pharmaceuticals Inc. |
| Sector: Health Care | |
| SubSector: Biotechnology | |
| MarketCap: 52487 Millions | |
| Recent Price: 21.22 Market Intelligence Score: 61 | |
| Day Percent Change: -0.09% Day Change: -0.02 | |
| Week Change: -0.66% Year-to-date Change: 121.0% | |
| FUSN Links: Profile News Message Board | |
| Charts:- Daily , Weekly | |
| Add FUSN to Watchlist: View: Get Complete FUSN Trend Analysis ➞ | |
 | DAWN Day One Biopharmaceuticals, Inc. |
| Sector: Health Care | |
| SubSector: Biotechnology | |
| MarketCap: 1040 Millions | |
| Recent Price: 14.96 Market Intelligence Score: 55 | |
| Day Percent Change: -0.13% Day Change: -0.02 | |
| Week Change: 8.64% Year-to-date Change: 1.8% | |
| DAWN Links: Profile News Message Board | |
| Charts:- Daily , Weekly | |
| Add DAWN to Watchlist: View: Get Complete DAWN Trend Analysis ➞ | |
 | TECH Bio-Techne Corporation |
| Sector: Health Care | |
| SubSector: Biotechnology | |
| MarketCap: 6958.05 Millions | |
| Recent Price: 62.12 Market Intelligence Score: 27 | |
| Day Percent Change: -0.14% Day Change: -0.09 | |
| Week Change: -6.91% Year-to-date Change: -19.5% | |
| TECH Links: Profile News Message Board | |
| Charts:- Daily , Weekly | |
| Add TECH to Watchlist: View: Get Complete TECH Trend Analysis ➞ | |
 | RPTX Repare Therapeutics Inc. |
| Sector: Health Care | |
| SubSector: Biotechnology | |
| MarketCap: 13687 Millions | |
| Recent Price: 3.02 Market Intelligence Score: 10 | |
| Day Percent Change: -0.17% Day Change: 0.00 | |
| Week Change: -17.26% Year-to-date Change: -58.6% | |
| RPTX Links: Profile News Message Board | |
| Charts:- Daily , Weekly | |
| Add RPTX to Watchlist: View: Get Complete RPTX Trend Analysis ➞ | |
 | GBIO Generation Bio Co. |
| Sector: Health Care | |
| SubSector: Biotechnology | |
| MarketCap: 17487 Millions | |
| Recent Price: 2.77 Market Intelligence Score: 36 | |
| Day Percent Change: -0.18% Day Change: 0.00 | |
| Week Change: -30.75% Year-to-date Change: 67.9% | |
| GBIO Links: Profile News Message Board | |
| Charts:- Daily , Weekly | |
| Add GBIO to Watchlist: View: Get Complete GBIO Trend Analysis ➞ | |
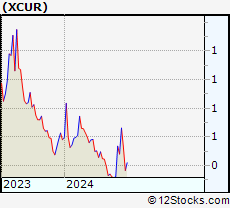 | XCUR Exicure, Inc. |
| Sector: Health Care | |
| SubSector: Biotechnology | |
| MarketCap: 113.785 Millions | |
| Recent Price: 0.58 Market Intelligence Score: 53 | |
| Day Percent Change: -0.22% Day Change: 0.00 | |
| Week Change: 0.43% Year-to-date Change: 0.4% | |
| XCUR Links: Profile News Message Board | |
| Charts:- Daily , Weekly | |
| Add XCUR to Watchlist: View: Get Complete XCUR Trend Analysis ➞ | |
 | PLRX Pliant Therapeutics, Inc. |
| Sector: Health Care | |
| SubSector: Biotechnology | |
| MarketCap: 96487 Millions | |
| Recent Price: 12.20 Market Intelligence Score: 0 | |
| Day Percent Change: -0.25% Day Change: -0.03 | |
| Week Change: -13.78% Year-to-date Change: -32.7% | |
| PLRX Links: Profile News Message Board | |
| Charts:- Daily , Weekly | |
| Add PLRX to Watchlist: View: Get Complete PLRX Trend Analysis ➞ | |
 | RVNC Revance Therapeutics, Inc. |
| Sector: Health Care | |
| SubSector: Biotechnology | |
| MarketCap: 854.185 Millions | |
| Recent Price: 3.78 Market Intelligence Score: 27 | |
| Day Percent Change: -0.26% Day Change: -0.01 | |
| Week Change: -8.47% Year-to-date Change: -57.0% | |
| RVNC Links: Profile News Message Board | |
| Charts:- Daily , Weekly | |
| Add RVNC to Watchlist: View: Get Complete RVNC Trend Analysis ➞ | |
 | VCEL Vericel Corporation |
| Sector: Health Care | |
| SubSector: Biotechnology | |
| MarketCap: 391.885 Millions | |
| Recent Price: 43.74 Market Intelligence Score: 26 | |
| Day Percent Change: -0.27% Day Change: -0.12 | |
| Week Change: -8.68% Year-to-date Change: 22.8% | |
| VCEL Links: Profile News Message Board | |
| Charts:- Daily , Weekly | |
| Add VCEL to Watchlist: View: Get Complete VCEL Trend Analysis ➞ | |
 | KZR Kezar Life Sciences, Inc. |
| Sector: Health Care | |
| SubSector: Biotechnology | |
| MarketCap: 174.885 Millions | |
| Recent Price: 0.79 Market Intelligence Score: 20 | |
| Day Percent Change: -0.27% Day Change: 0.00 | |
| Week Change: -8.72% Year-to-date Change: -16.9% | |
| KZR Links: Profile News Message Board | |
| Charts:- Daily , Weekly | |
| Add KZR to Watchlist: View: Get Complete KZR Trend Analysis ➞ | |
 | SMMT Summit Therapeutics plc |
| Sector: Health Care | |
| SubSector: Biotechnology | |
| MarketCap: 156.985 Millions | |
| Recent Price: 3.50 Market Intelligence Score: 0 | |
| Day Percent Change: -0.28% Day Change: -0.01 | |
| Week Change: -4.5% Year-to-date Change: 34.1% | |
| SMMT Links: Profile News Message Board | |
| Charts:- Daily , Weekly | |
| Add SMMT to Watchlist: View: Get Complete SMMT Trend Analysis ➞ | |
 | IMVT Immunovant, Inc. |
| Sector: Health Care | |
| SubSector: Biotechnology | |
| MarketCap: 552.885 Millions | |
| Recent Price: 28.24 Market Intelligence Score: 10 | |
| Day Percent Change: -0.28% Day Change: -0.08 | |
| Week Change: -3.78% Year-to-date Change: -33.0% | |
| IMVT Links: Profile News Message Board | |
| Charts:- Daily , Weekly | |
| Add IMVT to Watchlist: View: Get Complete IMVT Trend Analysis ➞ | |
 | AVDL Avadel Pharmaceuticals plc |
| Sector: Health Care | |
| SubSector: Biotechnology | |
| MarketCap: 354.485 Millions | |
| Recent Price: 17.33 Market Intelligence Score: 68 | |
| Day Percent Change: -0.29% Day Change: -0.05 | |
| Week Change: 8.38% Year-to-date Change: 22.7% | |
| AVDL Links: Profile News Message Board | |
| Charts:- Daily , Weekly | |
| Add AVDL to Watchlist: View: Get Complete AVDL Trend Analysis ➞ | |
 | KALA Kala Pharmaceuticals, Inc. |
| Sector: Health Care | |
| SubSector: Biotechnology | |
| MarketCap: 276.485 Millions | |
| Recent Price: 6.81 Market Intelligence Score: 28 | |
| Day Percent Change: -0.29% Day Change: -0.02 | |
| Week Change: -5.42% Year-to-date Change: -2.7% | |
| KALA Links: Profile News Message Board | |
| Charts:- Daily , Weekly | |
| Add KALA to Watchlist: View: Get Complete KALA Trend Analysis ➞ | |
 | GALT Galectin Therapeutics, Inc. |
| Sector: Health Care | |
| SubSector: Biotechnology | |
| MarketCap: 114.185 Millions | |
| Recent Price: 3.37 Market Intelligence Score: 51 | |
| Day Percent Change: -0.30% Day Change: -0.01 | |
| Week Change: -15.11% Year-to-date Change: 103.0% | |
| GALT Links: Profile News Message Board | |
| Charts:- Daily , Weekly | |
| Add GALT to Watchlist: View: Get Complete GALT Trend Analysis ➞ | |
 | IONS Ionis Pharmaceuticals, Inc. |
| Sector: Health Care | |
| SubSector: Biotechnology | |
| MarketCap: 6725.05 Millions | |
| Recent Price: 40.68 Market Intelligence Score: 10 | |
| Day Percent Change: -0.32% Day Change: -0.13 | |
| Week Change: -2.54% Year-to-date Change: -19.6% | |
| IONS Links: Profile News Message Board | |
| Charts:- Daily , Weekly | |
| Add IONS to Watchlist: View: Get Complete IONS Trend Analysis ➞ | |
 | RYTM Rhythm Pharmaceuticals, Inc. |
| Sector: Health Care | |
| SubSector: Biotechnology | |
| MarketCap: 643.685 Millions | |
| Recent Price: 37.98 Market Intelligence Score: 7 | |
| Day Percent Change: -0.35% Day Change: -0.13 | |
| Week Change: -5.84% Year-to-date Change: -17.4% | |
| RYTM Links: Profile News Message Board | |
| Charts:- Daily , Weekly | |
| Add RYTM to Watchlist: View: Get Complete RYTM Trend Analysis ➞ | |
 | ABUS Arbutus Biopharma Corporation |
| Sector: Health Care | |
| SubSector: Biotechnology | |
| MarketCap: 110.885 Millions | |
| Recent Price: 2.72 Market Intelligence Score: 51 | |
| Day Percent Change: -0.37% Day Change: -0.01 | |
| Week Change: -6.53% Year-to-date Change: 8.8% | |
| ABUS Links: Profile News Message Board | |
| Charts:- Daily , Weekly | |
| Add ABUS to Watchlist: View: Get Complete ABUS Trend Analysis ➞ | |
 | NBIX Neurocrine Biosciences, Inc. |
| Sector: Health Care | |
| SubSector: Biotechnology | |
| MarketCap: 7897.85 Millions | |
| Recent Price: 132.00 Market Intelligence Score: 18 | |
| Day Percent Change: -0.41% Day Change: -0.54 | |
| Week Change: -1.98% Year-to-date Change: 0.2% | |
| NBIX Links: Profile News Message Board | |
| Charts:- Daily , Weekly | |
| Add NBIX to Watchlist: View: Get Complete NBIX Trend Analysis ➞ | |
 | GRTS Gritstone Oncology, Inc. |
| Sector: Health Care | |
| SubSector: Biotechnology | |
| MarketCap: 240.085 Millions | |
| Recent Price: 0.74 Market Intelligence Score: 17 | |
| Day Percent Change: -0.43% Day Change: 0.00 | |
| Week Change: -11.85% Year-to-date Change: -63.7% | |
| GRTS Links: Profile News Message Board | |
| Charts:- Daily , Weekly | |
| Add GRTS to Watchlist: View: Get Complete GRTS Trend Analysis ➞ | |
 | RNA Avidity Biosciences, Inc. |
| Sector: Health Care | |
| SubSector: Biotechnology | |
| MarketCap: 12287 Millions | |
| Recent Price: 22.93 Market Intelligence Score: 46 | |
| Day Percent Change: -0.48% Day Change: -0.11 | |
| Week Change: -4.82% Year-to-date Change: 153.7% | |
| RNA Links: Profile News Message Board | |
| Charts:- Daily , Weekly | |
| Add RNA to Watchlist: View: Get Complete RNA Trend Analysis ➞ | |
 | MOR MorphoSys AG |
| Sector: Health Care | |
| SubSector: Biotechnology | |
| MarketCap: 2636.85 Millions | |
| Recent Price: 17.96 Market Intelligence Score: 49 | |
| Day Percent Change: -0.50% Day Change: -0.09 | |
| Week Change: -0.55% Year-to-date Change: 81.4% | |
| MOR Links: Profile News Message Board | |
| Charts:- Daily , Weekly | |
| Add MOR to Watchlist: View: Get Complete MOR Trend Analysis ➞ | |
 | GHRS GH Research PLC |
| Sector: Health Care | |
| SubSector: Biotechnology | |
| MarketCap: 614 Millions | |
| Recent Price: 11.03 Market Intelligence Score: 66 | |
| Day Percent Change: -0.50% Day Change: -0.06 | |
| Week Change: 0.27% Year-to-date Change: 101.3% | |
| GHRS Links: Profile News Message Board | |
| Charts:- Daily , Weekly | |
| Add GHRS to Watchlist: View: Get Complete GHRS Trend Analysis ➞ | |
| To view more stocks, click on Next / Previous arrows or select different range: 0 - 25 , 25 - 50 , 50 - 75 , 75 - 100 , 100 - 125 , 125 - 150 , 150 - 175 , 175 - 200 , 200 - 225 , 225 - 250 , 250 - 275 , 275 - 300 , 300 - 325 , 325 - 350 , 350 - 375 , 375 - 400 | ||
| Click To Change The Sort Order: By Market Cap or Company Size Performance: Year-to-date, Week and Day | |
| Select Chart Type: | ||
|
Best Stocks Today 12Stocks.com |
© 2024 12Stocks.com Terms & Conditions Privacy Contact Us
All Information Provided Only For Education And Not To Be Used For Investing or Trading. See Terms & Conditions


One More Thing ... Get Best Stocks Delivered Daily!
Never Ever Miss A Move With Our Top Ten Stocks Lists
Find Best Stocks In Any Market - Bull or Bear Market
Take A Peek At Our Top Ten Stocks Lists: Daily, Weekly, Year-to-Date & Top Trends
Find Best Stocks In Any Market - Bull or Bear Market
Take A Peek At Our Top Ten Stocks Lists: Daily, Weekly, Year-to-Date & Top Trends
Biotech Stocks With Best Up Trends [0-bearish to 100-bullish]: Vanda [100], Rani [95], Humacyte [95], ALX Oncology[95], United [93], Mesoblast [88], OPKO Health[88], Reneo [86], Silence [85], XOMA [83], Third Harmonic[83]
Best Biotech Stocks Year-to-Date:
Precision [2571.23%], Inovio [1798.04%], Assembly [1535.17%], Adverum nologies[1406.38%], NuCana [1188.03%], Affimed N.V[724%], Corbus [549.67%], Agenus [541.38%], Mesoblast [373.64%], Janux [353.14%], Addex [244.17%] Best Biotech Stocks This Week:
NuCana [1601.65%], Rani [30.93%], Humacyte [28.47%], Vanda [24.03%], ALX Oncology[22.49%], ProKidney [16.57%], Galera [15.36%], ADC [10.93%], Intra-Cellular Therapies[9.85%], VBI Vaccines[9.26%], Day One[8.64%] Best Biotech Stocks Daily:
Rani [15.71%], Genelux [14.25%], Humacyte [14.02%], Emergent Bio[9.68%], Adaptimmune [8.72%], BioXcel [8.63%], Corbus [7.42%], RedHill Biopharma[7.41%], bluebird bio[7.03%], ProQR [6.99%], Agenus [6.84%]