
![]()
Stocks with best trends & most momentum Starts at $49.99/Mo Subscribe ➞
| Terms & Conditions | Follow @DozenStocks | 12Stocks.com - Best Performing Stocks |
|
 Login Sign Up
| |||||
 |  | ||||
| 12Stocks.com Market Intelligence |
Nasdaq 100 Stocks Trends Browser
| INTU - Intuit Inc | |||||||||
 Previous Stock |
 |
|  Next Stock | ||||||
| INTU - Weekly & Daily Technical Charts | |||||||||
| |||||||||
; ?>)
; ?>)
| INTU - Technical Opinion | |||
|
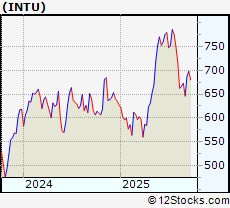
October 4, 2025 - Although mid term i.e weekly trends for Intuit Inc are improving, the long and short term trends are deteriorating. The overall 12Stocks.com market intelligence score is 40 (measures stock trend from 0-bearish to 100-bullish) which puts INTU in short term bearish to neutral trend. The market intelligence score from previous trading session is 50 and hence a deterioration of trend. | |||
| INTU Performance Review | |
| Name: Intuit Inc | |
| Sector: Technology | |
| SubSector: Software - Application | |
| Recent Price: 679.94 | |
| MarketCap: 187586 Millions | |
| Day Percent Change: -0.28% | |
| Day Change: -1.92 | |
| Week Change: -1.83923% | |
| Year-to-date Change: 9.69817% | |
| Continue to view next (or previous) Nasdaq 100 stocks | |

|


© 2025 12Stocks.com Terms & Conditions Privacy Contact Us
All Information Provided Only For Education And Not To Be Used For Investing or Trading. See Terms & Conditions
| ||||||||||||||||


One More Thing ... Get Best Stocks Delivered Daily!
Never Ever Miss A Move With Our Top Ten Stocks Lists
Get Best Performing Stocks, Daily Market Trends & Insight
Take A Peek At Our Top Ten Stocks Lists: Daily, Weekly, Year-to-Date & Top Trends
Get Best Performing Stocks, Daily Market Trends & Insight
Take A Peek At Our Top Ten Stocks Lists: Daily, Weekly, Year-to-Date & Top Trends
Dow Stocks With Best Current Trends [0-bearish to 100-bullish]: Unitedhealth Group Inc [100], Travelers Companies Inc [100], Caterpillar Inc [100], Johnson & Johnson [100], Dow30 2x [100], AMGEN Inc [100], Merck & Co Inc [100], Business Machines Corp [90], S&P 500 [90], 3M Co [90] Best S&P 500 Stocks Year-to-Date Update:
Seagate Technology Holdings [196.578%], Western Digital Corp [181.311%], Newmont Corp [128.804%], Micron Technology Inc [115.564%], Lam Research Corp [102.394%], Intel Corp [82.0722%], CVS Health Corp [81.2496%], NRG Energy Inc [81.2539%], Corning Inc [80.9332%], Warner Bros. Discovery Inc [80.46%] Best Nasdaq 100 Stocks Weekly Update:
Micron Technology Inc [19.7666%], Electronic Arts Inc [19.2312%], Biogen Inc [17.8448%], Astrazeneca ADR [16.0057%], Moderna Inc [15.7659%], Lam Research Corp [13.7985%], Datadog Inc [11.142%], Illumina Inc [10.7712%], Constellation Energy [10.3178%], Trade Desk Inc [10.2438%] Today's Stock Market In A Nutshell:Gold [0.8%], US Small Cap [0.7%], Europe [0.6%], US Mid Cap [0.3%], Emerging Markets [0.3%], Oil [0.2%], Euro [0.2%], India [0.1%], US Large Cap [0%], Bonds [-0.1%], US Dollar [-0.2%], China [-0.8%],