
 Login Sign Up


| |||||
 |  | ||||

| 12Stocks.com Market Intelligence |
Best Tech Stocks
| In a hurry? Tech Stocks Lists: Performance & Trends, Stock Charts, FANG Stocks
Sort Tech stocks: Daily, Weekly, Year-to-Date, Market Cap & Trends. Filter Tech stocks list by size:All Tech Large Mid-Range Small and MicroCap |
| 12Stocks.com Tech Stocks Performances & Trends Daily | |||||||||
|
|  The overall Smart Investing & Trading Score is 10 (0-bearish to 100-bullish) which puts Technology sector in short term bearish trend. The Smart Investing & Trading Score from previous trading session is 0 and hence an improvement of trend.
| ||||||||
Here are the Smart Investing & Trading Scores of the most requested Technology stocks at 12Stocks.com (click stock name for detailed review):
|


| 12Stocks.com: Investing in Technology sector with Stocks | |
|
The following table helps investors and traders sort through current performance and trends (as measured by Smart Investing & Trading Score) of various
stocks in the Tech sector. Quick View: Move mouse or cursor over stock symbol (ticker) to view short-term technical chart and over stock name to view long term chart. Click on  to add stock symbol to your watchlist and to add stock symbol to your watchlist and  to view watchlist. Click on any ticker or stock name for detailed market intelligence report for that stock. to view watchlist. Click on any ticker or stock name for detailed market intelligence report for that stock. |
12Stocks.com Performance of Stocks in Tech Sector
| Ticker | Stock Name | Watchlist | Category | Recent Price | Smart Investing & Trading Score | Change % | YTD Change% |
| PGNY | Progyny |   | Healthcare Information | 32.07 | 10 | -0.68% | -13.74% |
| FLYW | Flywire | | Software - Infrastructure | 20.18 | 10 | -1.03% | -13.87% |
| LOGI | Logitech | | Computer | 81.77 | 49 | 3.49% | -13.98% |
| CWAN | Clearwater Analytics | | Software - | 17.20 | 77 | 8.72% | -14.06% |
| GTLB | GitLab | | Software - | 54.36 | 27 | 2.86% | -14.22% |
| RAMP | LiveRamp | | IT | 32.48 | 20 | 0.59% | -14.26% |
| TDC | Teradata | | IT | 37.26 | 32 | -0.29% | -14.36% |
| YY | JOYY | | Internet | 33.82 | 90 | 5.00% | -14.81% |
| QLYS | Qualys | | Software | 166.00 | 18 | 0.43% | -15.43% |
| YOU | Clear Secure | | Software - | 17.52 | 18 | -0.11% | -15.44% |
| YELP | Yelp | | Internet | 40.00 | 43 | -1.09% | -15.50% |
| LITE | Lumentum | | Communication | 44.29 | 67 | 1.77% | -15.51% |
| OLO | Olo | | Software - | 4.83 | 38 | -1.83% | -15.56% |
| COMP | Compass | | Software - | 3.15 | 10 | 0.48% | -15.57% |
| HKD | AMTD Digital | | Software - | 3.48 | 69 | -4.40% | -15.74% |
| KLIC | Kulicke and | | Semiconductor | 46.02 | 27 | 3.74% | -15.90% |
| DT | Dynatrace | | Software | 45.84 | 18 | 0.57% | -16.18% |
| ON | ON Semiconductor | | Semiconductor | 70.01 | 47 | 1.45% | -16.19% |
| EVCM | EverCommerce | | Software - Infrastructure | 9.31 | 57 | 1.09% | -16.31% |
| CCOI | Cogent | | Communication | 63.51 | 32 | -2.14% | -16.50% |
| SRAD | Sportradar | | Software - | 9.30 | 17 | 0.59% | -16.55% |
| POWI | Power Integrations | | Semiconductor | 67.97 | 52 | 3.38% | -17.22% |
| DXC | DXC | | IT | 18.90 | 0 | -0.53% | -17.36% |
| DV | DoubleVerify | | Software - | 30.34 | 27 | 2.09% | -17.51% |
| BB | BlackBerry | | Communication | 2.92 | 85 | 2.82% | -17.51% |
| For chart view version of above stock list: Chart View ➞ 0 - 25 , 25 - 50 , 50 - 75 , 75 - 100 , 100 - 125 , 125 - 150 , 150 - 175 , 175 - 200 , 200 - 225 , 225 - 250 | ||
 | Click To Change The Sort Order: By Market Cap or Company Size Performance: Year-to-date, Week and Day |  |
|
Get the most comprehensive stock market coverage daily at 12Stocks.com ➞ Best Stocks Today ➞ Best Stocks Weekly ➞ Best Stocks Year-to-Date ➞ Best Stocks Trends ➞  Best Stocks Today 12Stocks.com Best Nasdaq Stocks ➞ Best S&P 500 Stocks ➞ Best Tech Stocks ➞ Best Biotech Stocks ➞ |
| Detailed Overview of Tech Stocks |
| Tech Technical Overview, Leaders & Laggards, Top Tech ETF Funds & Detailed Tech Stocks List, Charts, Trends & More |
| Tech Sector: Technical Analysis, Trends & YTD Performance | |
| Technology sector is composed of stocks
from semiconductors, software, web, social media
and services subsectors. Technology sector, as represented by XLK, an exchange-traded fund [ETF] that holds basket of tech stocks (e.g, Intel, Google) is up by 2.38% and is currently underperforming the overall market by -3.24% year-to-date. Below is a quick view of technical charts and trends: |
|
 XLK Weekly Chart |
|
| Long Term Trend: Not Good | |
| Medium Term Trend: Not Good | |
 XLK Daily Chart |
|
| Short Term Trend: Deteriorating | |
| Overall Trend Score: 10 | |
| YTD Performance: 2.38% | |
| **Trend Scores & Views Are Only For Educational Purposes And Not For Investing | |
| 12Stocks.com: Top Performing Technology Sector Stocks | ||||||||||||||||||||||||||||||||||||||||||||||||
 The top performing Technology sector stocks year to date are
Now, more recently, over last week, the top performing Technology sector stocks on the move are


|
||||||||||||||||||||||||||||||||||||||||||||||||
| 12Stocks.com: Investing in Tech Sector using Exchange Traded Funds | |
|
The following table shows list of key exchange traded funds (ETF) that
help investors track Tech Index. For detailed view, check out our ETF Funds section of our website. Quick View: Move mouse or cursor over ETF symbol (ticker) to view short-term technical chart and over ETF name to view long term chart. Click on ticker or stock name for detailed view. Click on to add stock symbol to your watchlist and to view watchlist. |
12Stocks.com List of ETFs that track Tech Index
| Ticker | ETF Name | Watchlist | Recent Price | Smart Investing & Trading Score | Change % | Week % | Year-to-date % |
| XLK | Technology | | 197.06 | 10 | 1.44 | -1.39 | 2.38% |
| QQQ | QQQ | | 426.90 | 17 | 1.28 | -0.95 | 4.24% |
| IYW | Technology | | 129.01 | 10 | 1.62 | -1.48 | 5.1% |
| VGT | Information Technology | | 496.06 | 17 | 1.37 | -1.56 | 2.49% |
| IXN | Global Tech | | 70.86 | 10 | 1.48 | -1.31 | 3.93% |
| IGV | Tech-Software | | 79.91 | 10 | 1.06 | -1.46 | -1.5% |
| XSD | Semiconductor | | 221.13 | 48 | 1.75 | -1.58 | -1.63% |
| TQQQ | QQQ | | 53.53 | 17 | 3.74 | -3.17 | 5.58% |
| SQQQ | Short QQQ | | 11.78 | 78 | -3.60 | 3.06 | -12.42% |
| SOXL | Semicondct Bull 3X | | 36.45 | 17 | 6.05 | -8.3 | 16.08% |
| SOXS | Semicondct Bear 3X | | 37.60 | 66 | -6.54 | 7.12 | 546.05% |
| SOXX | PHLX Semiconductor | | 211.41 | 17 | 2.25 | -2.53 | 10.09% |
| QTEC | First -100-Tech | | 180.14 | 10 | 1.58 | -2.09 | 2.66% |
| SMH | Semiconductor | | 212.03 | 30 | 2.01 | -2.58 | 21.25% |
| 12Stocks.com: Charts, Trends, Fundamental Data and Performances of Tech Stocks | |
|
We now take in-depth look at all Tech stocks including charts, multi-period performances and overall trends (as measured by Smart Investing & Trading Score). One can sort Tech stocks (click link to choose) by Daily, Weekly and by Year-to-Date performances. Also, one can sort by size of the company or by market capitalization. |
| Select Your Default Chart Type: | |||||
| |||||
| Click on stock symbol or name for detailed view. Click on to add stock symbol to your watchlist and to view watchlist. Quick View: Move mouse or cursor over "Daily" to quickly view daily technical stock chart and over "Weekly" to view weekly technical stock chart. | |||||


 | PGNY Progyny, Inc. |
| Sector: Technology | |
| SubSector: Healthcare Information Services | |
| MarketCap: 1839.05 Millions | |
| Recent Price: 32.07 Smart Investing & Trading Score: 10 | |
| Day Percent Change: -0.68% Day Change: -0.22 | |
| Week Change: 0.09% Year-to-date Change: -13.7% | |
| PGNY Links: Profile News Message Board | |
| Charts:- Daily , Weekly | |
| Add PGNY to Watchlist: View: Get Complete PGNY Trend Analysis ➞ | |
 | FLYW Flywire Corporation |
| Sector: Technology | |
| SubSector: Software - Infrastructure | |
| MarketCap: 3390 Millions | |
| Recent Price: 20.18 Smart Investing & Trading Score: 10 | |
| Day Percent Change: -1.03% Day Change: -0.21 | |
| Week Change: -2.93% Year-to-date Change: -13.9% | |
| FLYW Links: Profile News Message Board | |
| Charts:- Daily , Weekly | |
| Add FLYW to Watchlist: View: Get Complete FLYW Trend Analysis ➞ | |
 | LOGI Logitech International S.A. |
| Sector: Technology | |
| SubSector: Computer Peripherals | |
| MarketCap: 7998.19 Millions | |
| Recent Price: 81.77 Smart Investing & Trading Score: 49 | |
| Day Percent Change: 3.49% Day Change: 2.76 | |
| Week Change: 3.17% Year-to-date Change: -14.0% | |
| LOGI Links: Profile News Message Board | |
| Charts:- Daily , Weekly | |
| Add LOGI to Watchlist: View: Get Complete LOGI Trend Analysis ➞ | |
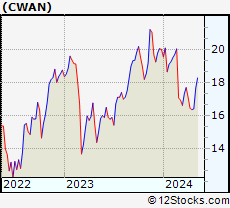 | CWAN Clearwater Analytics Holdings, Inc. |
| Sector: Technology | |
| SubSector: Software - Application | |
| MarketCap: 3830 Millions | |
| Recent Price: 17.20 Smart Investing & Trading Score: 77 | |
| Day Percent Change: 8.72% Day Change: 1.38 | |
| Week Change: 4.88% Year-to-date Change: -14.1% | |
| CWAN Links: Profile News Message Board | |
| Charts:- Daily , Weekly | |
| Add CWAN to Watchlist: View: Get Complete CWAN Trend Analysis ➞ | |
 | GTLB GitLab Inc. |
| Sector: Technology | |
| SubSector: Software - Application | |
| MarketCap: 7840 Millions | |
| Recent Price: 54.36 Smart Investing & Trading Score: 27 | |
| Day Percent Change: 2.86% Day Change: 1.51 | |
| Week Change: -1.98% Year-to-date Change: -14.2% | |
| GTLB Links: Profile News Message Board | |
| Charts:- Daily , Weekly | |
| Add GTLB to Watchlist: View: Get Complete GTLB Trend Analysis ➞ | |
 | RAMP LiveRamp Holdings, Inc. |
| Sector: Technology | |
| SubSector: Information Technology Services | |
| MarketCap: 2124.38 Millions | |
| Recent Price: 32.48 Smart Investing & Trading Score: 20 | |
| Day Percent Change: 0.59% Day Change: 0.19 | |
| Week Change: -0.49% Year-to-date Change: -14.3% | |
| RAMP Links: Profile News Message Board | |
| Charts:- Daily , Weekly | |
| Add RAMP to Watchlist: View: Get Complete RAMP Trend Analysis ➞ | |
 | TDC Teradata Corporation |
| Sector: Technology | |
| SubSector: Information Technology Services | |
| MarketCap: 2229.48 Millions | |
| Recent Price: 37.26 Smart Investing & Trading Score: 32 | |
| Day Percent Change: -0.29% Day Change: -0.11 | |
| Week Change: -1.09% Year-to-date Change: -14.4% | |
| TDC Links: Profile News Message Board | |
| Charts:- Daily , Weekly | |
| Add TDC to Watchlist: View: Get Complete TDC Trend Analysis ➞ | |
 | YY JOYY Inc. |
| Sector: Technology | |
| SubSector: Internet Information Providers | |
| MarketCap: 3527.6 Millions | |
| Recent Price: 33.82 Smart Investing & Trading Score: 90 | |
| Day Percent Change: 5.00% Day Change: 1.61 | |
| Week Change: 1.32% Year-to-date Change: -14.8% | |
| YY Links: Profile News Message Board | |
| Charts:- Daily , Weekly | |
| Add YY to Watchlist: View: Get Complete YY Trend Analysis ➞ | |
 | QLYS Qualys, Inc. |
| Sector: Technology | |
| SubSector: Application Software | |
| MarketCap: 3475.02 Millions | |
| Recent Price: 166.00 Smart Investing & Trading Score: 18 | |
| Day Percent Change: 0.43% Day Change: 0.71 | |
| Week Change: -2.56% Year-to-date Change: -15.4% | |
| QLYS Links: Profile News Message Board | |
| Charts:- Daily , Weekly | |
| Add QLYS to Watchlist: View: Get Complete QLYS Trend Analysis ➞ | |
 | YOU Clear Secure, Inc. |
| Sector: Technology | |
| SubSector: Software - Application | |
| MarketCap: 3510 Millions | |
| Recent Price: 17.52 Smart Investing & Trading Score: 18 | |
| Day Percent Change: -0.11% Day Change: -0.02 | |
| Week Change: -0.11% Year-to-date Change: -15.4% | |
| YOU Links: Profile News Message Board | |
| Charts:- Daily , Weekly | |
| Add YOU to Watchlist: View: Get Complete YOU Trend Analysis ➞ | |
 | YELP Yelp Inc. |
| Sector: Technology | |
| SubSector: Internet Information Providers | |
| MarketCap: 1430.1 Millions | |
| Recent Price: 40.00 Smart Investing & Trading Score: 43 | |
| Day Percent Change: -1.09% Day Change: -0.44 | |
| Week Change: -2.01% Year-to-date Change: -15.5% | |
| YELP Links: Profile News Message Board | |
| Charts:- Daily , Weekly | |
| Add YELP to Watchlist: View: Get Complete YELP Trend Analysis ➞ | |
 | LITE Lumentum Holdings Inc. |
| Sector: Technology | |
| SubSector: Communication Equipment | |
| MarketCap: 4990.49 Millions | |
| Recent Price: 44.29 Smart Investing & Trading Score: 67 | |
| Day Percent Change: 1.77% Day Change: 0.77 | |
| Week Change: 2% Year-to-date Change: -15.5% | |
| LITE Links: Profile News Message Board | |
| Charts:- Daily , Weekly | |
| Add LITE to Watchlist: View: Get Complete LITE Trend Analysis ➞ | |
 | OLO Olo Inc. |
| Sector: Technology | |
| SubSector: Software - Application | |
| MarketCap: 1030 Millions | |
| Recent Price: 4.83 Smart Investing & Trading Score: 38 | |
| Day Percent Change: -1.83% Day Change: -0.09 | |
| Week Change: -3.4% Year-to-date Change: -15.6% | |
| OLO Links: Profile News Message Board | |
| Charts:- Daily , Weekly | |
| Add OLO to Watchlist: View: Get Complete OLO Trend Analysis ➞ | |
 | COMP Compass, Inc. |
| Sector: Technology | |
| SubSector: Software - Application | |
| MarketCap: 1580 Millions | |
| Recent Price: 3.15 Smart Investing & Trading Score: 10 | |
| Day Percent Change: 0.48% Day Change: 0.02 | |
| Week Change: -4.7% Year-to-date Change: -15.6% | |
| COMP Links: Profile News Message Board | |
| Charts:- Daily , Weekly | |
| Add COMP to Watchlist: View: Get Complete COMP Trend Analysis ➞ | |
 | HKD AMTD Digital Inc. |
| Sector: Technology | |
| SubSector: Software - Application | |
| MarketCap: 1200 Millions | |
| Recent Price: 3.48 Smart Investing & Trading Score: 69 | |
| Day Percent Change: -4.40% Day Change: -0.16 | |
| Week Change: 7.41% Year-to-date Change: -15.7% | |
| HKD Links: Profile News Message Board | |
| Charts:- Daily , Weekly | |
| Add HKD to Watchlist: View: Get Complete HKD Trend Analysis ➞ | |
 | KLIC Kulicke and Soffa Industries, Inc. |
| Sector: Technology | |
| SubSector: Semiconductor Equipment & Materials | |
| MarketCap: 1336.68 Millions | |
| Recent Price: 46.02 Smart Investing & Trading Score: 27 | |
| Day Percent Change: 3.74% Day Change: 1.66 | |
| Week Change: -2.13% Year-to-date Change: -15.9% | |
| KLIC Links: Profile News Message Board | |
| Charts:- Daily , Weekly | |
| Add KLIC to Watchlist: View: Get Complete KLIC Trend Analysis ➞ | |
 | DT Dynatrace, Inc. |
| Sector: Technology | |
| SubSector: Application Software | |
| MarketCap: 7007.12 Millions | |
| Recent Price: 45.84 Smart Investing & Trading Score: 18 | |
| Day Percent Change: 0.57% Day Change: 0.26 | |
| Week Change: -2.68% Year-to-date Change: -16.2% | |
| DT Links: Profile News Message Board | |
| Charts:- Daily , Weekly | |
| Add DT to Watchlist: View: Get Complete DT Trend Analysis ➞ | |
 | ON ON Semiconductor Corporation |
| Sector: Technology | |
| SubSector: Semiconductor - Broad Line | |
| MarketCap: 5183.82 Millions | |
| Recent Price: 70.01 Smart Investing & Trading Score: 47 | |
| Day Percent Change: 1.45% Day Change: 1.00 | |
| Week Change: 2.87% Year-to-date Change: -16.2% | |
| ON Links: Profile News Message Board | |
| Charts:- Daily , Weekly | |
| Add ON to Watchlist: View: Get Complete ON Trend Analysis ➞ | |
 | EVCM EverCommerce Inc. |
| Sector: Technology | |
| SubSector: Software - Infrastructure | |
| MarketCap: 2210 Millions | |
| Recent Price: 9.31 Smart Investing & Trading Score: 57 | |
| Day Percent Change: 1.09% Day Change: 0.10 | |
| Week Change: 1.31% Year-to-date Change: -16.3% | |
| EVCM Links: Profile News Message Board | |
| Charts:- Daily , Weekly | |
| Add EVCM to Watchlist: View: Get Complete EVCM Trend Analysis ➞ | |
 | CCOI Cogent Communications Holdings, Inc. |
| Sector: Technology | |
| SubSector: Diversified Communication Services | |
| MarketCap: 3868.14 Millions | |
| Recent Price: 63.51 Smart Investing & Trading Score: 32 | |
| Day Percent Change: -2.14% Day Change: -1.39 | |
| Week Change: -3.47% Year-to-date Change: -16.5% | |
| CCOI Links: Profile News Message Board | |
| Charts:- Daily , Weekly | |
| Add CCOI to Watchlist: View: Get Complete CCOI Trend Analysis ➞ | |
 | SRAD Sportradar Group AG |
| Sector: Technology | |
| SubSector: Software - Application | |
| MarketCap: 3900 Millions | |
| Recent Price: 9.30 Smart Investing & Trading Score: 17 | |
| Day Percent Change: 0.59% Day Change: 0.05 | |
| Week Change: -2.77% Year-to-date Change: -16.6% | |
| SRAD Links: Profile News Message Board | |
| Charts:- Daily , Weekly | |
| Add SRAD to Watchlist: View: Get Complete SRAD Trend Analysis ➞ | |
 | POWI Power Integrations, Inc. |
| Sector: Technology | |
| SubSector: Semiconductor - Integrated Circuits | |
| MarketCap: 2612.1 Millions | |
| Recent Price: 67.97 Smart Investing & Trading Score: 52 | |
| Day Percent Change: 3.38% Day Change: 2.22 | |
| Week Change: 1.04% Year-to-date Change: -17.2% | |
| POWI Links: Profile News Message Board | |
| Charts:- Daily , Weekly | |
| Add POWI to Watchlist: View: Get Complete POWI Trend Analysis ➞ | |
 | DXC DXC Technology Company |
| Sector: Technology | |
| SubSector: Information Technology Services | |
| MarketCap: 3622.28 Millions | |
| Recent Price: 18.90 Smart Investing & Trading Score: 0 | |
| Day Percent Change: -0.53% Day Change: -0.10 | |
| Week Change: -5.88% Year-to-date Change: -17.4% | |
| DXC Links: Profile News Message Board | |
| Charts:- Daily , Weekly | |
| Add DXC to Watchlist: View: Get Complete DXC Trend Analysis ➞ | |
 | DV DoubleVerify Holdings, Inc. |
| Sector: Technology | |
| SubSector: Software - Application | |
| MarketCap: 6500 Millions | |
| Recent Price: 30.34 Smart Investing & Trading Score: 27 | |
| Day Percent Change: 2.09% Day Change: 0.62 | |
| Week Change: 0.36% Year-to-date Change: -17.5% | |
| DV Links: Profile News Message Board | |
| Charts:- Daily , Weekly | |
| Add DV to Watchlist: View: Get Complete DV Trend Analysis ➞ | |
 | BB BlackBerry Limited |
| Sector: Technology | |
| SubSector: Communication Equipment | |
| MarketCap: 2100.39 Millions | |
| Recent Price: 2.92 Smart Investing & Trading Score: 85 | |
| Day Percent Change: 2.82% Day Change: 0.08 | |
| Week Change: 3.18% Year-to-date Change: -17.5% | |
| BB Links: Profile News Message Board | |
| Charts:- Daily , Weekly | |
| Add BB to Watchlist: View: Get Complete BB Trend Analysis ➞ | |
| For tabular summary view of above stock list: Summary View ➞ 0 - 25 , 25 - 50 , 50 - 75 , 75 - 100 , 100 - 125 , 125 - 150 , 150 - 175 , 175 - 200 , 200 - 225 , 225 - 250 | ||
| Click To Change The Sort Order: By Market Cap or Company Size Performance: Year-to-date, Week and Day | |
| Select Chart Type: | ||
|
Best Stocks Today 12Stocks.com |
© 2024 12Stocks.com Terms & Conditions Privacy Contact Us
All Information Provided Only For Education And Not To Be Used For Investing or Trading. See Terms & Conditions


One More Thing ... Get Best Stocks Delivered Daily!
Never Ever Miss A Move With Our Top Ten Stocks Lists
Find Best Stocks In Any Market - Bull or Bear Market
Take A Peek At Our Top Ten Stocks Lists: Daily, Weekly, Year-to-Date & Top Trends
Find Best Stocks In Any Market - Bull or Bear Market
Take A Peek At Our Top Ten Stocks Lists: Daily, Weekly, Year-to-Date & Top Trends
Technology Stocks With Best Up Trends [0-bearish to 100-bullish]: Benchmark Electronics[100], FormFactor [100], Bilibili [100], Q2 [100], TTM [100], JD.com [100], 21Vianet [100], QUALCOMM [100], Itron [100], Weibo [100], Omnicell [100]
Best Technology Stocks Year-to-Date:
MediaCo Holding[395.31%], Bakkt [187.89%], Smith Micro[178.45%], Uxin [176.75%], Super Micro[168.25%], CXApp [164.09%], SoundHound AI[113.32%], NextNav [108.76%], CuriosityStream [103.67%], MediaAlpha [98.56%], GigaCloud [89.46%] Best Technology Stocks This Week:
Bakkt [1506.2%], SYLA [79.9%], Mitcham Industries[29.66%], Koninklijke Philips[26.06%], MediaCo Holding[21.97%], Cogint [21.1%], 21Vianet [20.89%], Harmonic [20.65%], Conduent [20.26%], Phoenix New[20%], MediaAlpha [17.07%] Best Technology Stocks Daily:
CommScope Holding[20.95%], Benchmark Electronics[18.06%], FormFactor [17.64%], Bilibili [15.63%], Maxeon Solar[15.46%], Q2 [15.17%], TTM [12.73%], IAC/InterActiveCorp [12.14%], ANGI Homeservices[11.93%], Kingsoft Cloud[11.86%], JD.com [11.51%]