
 Login Sign Up


| |||||
 |  | ||||

| 12Stocks.com Market Intelligence |
Best Tech Stocks
| In a hurry? Tech Stocks Lists: Performance & Trends, Stock Charts, FANG Stocks
Sort Tech stocks: Daily, Weekly, Year-to-Date, Market Cap & Trends. Filter Tech stocks list by size:All Tech Large Mid-Range Small and MicroCap |
| 12Stocks.com Tech Stocks Performances & Trends Daily | |||||||||
|
|  The overall Smart Investing & Trading Score is 10 (0-bearish to 100-bullish) which puts Technology sector in short term bearish trend. The Smart Investing & Trading Score from previous trading session is 0 and hence an improvement of trend.
| ||||||||
Here are the Smart Investing & Trading Scores of the most requested Technology stocks at 12Stocks.com (click stock name for detailed review):
|


| 12Stocks.com: Investing in Technology sector with Stocks | |
|
The following table helps investors and traders sort through current performance and trends (as measured by Smart Investing & Trading Score) of various
stocks in the Tech sector. Quick View: Move mouse or cursor over stock symbol (ticker) to view short-term technical chart and over stock name to view long term chart. Click on  to add stock symbol to your watchlist and to add stock symbol to your watchlist and  to view watchlist. Click on any ticker or stock name for detailed market intelligence report for that stock. to view watchlist. Click on any ticker or stock name for detailed market intelligence report for that stock. |
12Stocks.com Performance of Stocks in Tech Sector
| Ticker | Stock Name | Watchlist | Category | Recent Price | Smart Investing & Trading Score | Change % | YTD Change% |
| CCCS | CCC Intelligent |   | Software - Infrastructure | 10.78 | 0 | 0.61% | -5.02% |
| PINC | Premier | | Healthcare Information | 21.22 | 80 | 0.76% | -5.10% |
| NOVT | Novanta | | Instruments | 159.65 | 25 | 1.83% | -5.20% |
| KT | KT | | Telecom | 12.74 | 57 | 1.27% | -5.21% |
| IDCC | InterDigital | | Wireless | 102.86 | 64 | 5.07% | -5.23% |
| KD | Kyndryl | | IT | 19.84 | 20 | -0.75% | -5.25% |
| VSH | Vishay Inter | | Semiconductor | 22.59 | 68 | 1.62% | -5.76% |
| ATHM | Autohome | | Internet | 26.44 | 95 | 3.28% | -5.77% |
| ESTC | Elastic N.V | | Software | 106.10 | 45 | 0.33% | -5.86% |
| DOCN | DigitalOcean | | Software - Infrastructure | 34.78 | 47 | -2.11% | -5.95% |
| SPSC | SPS Commerce | | Software | 182.07 | 57 | 1.73% | -6.07% |
| GBTG | Global Business | | Software - | 6.13 | 93 | 1.32% | -6.13% |
| PAYO | Payoneer Global | | Software - Infrastructure | 4.95 | 76 | 0.00% | -6.52% |
| YEXT | Yext | | Internet | 5.50 | 10 | -0.18% | -6.62% |
| NABL | N-able | | IT | 12.39 | 34 | 0.65% | -6.88% |
| NXT | Nextracker | | Solar | 43.41 | 24 | 1.12% | -7.10% |
| PRGS | Progress Software | | Software | 50.44 | 35 | 0.66% | -7.11% |
| IT | Gartner | | IT | 419.04 | 0 | -0.79% | -7.11% |
| FFIV | F5 Networks | | Software | 166.07 | 0 | -0.33% | -7.21% |
| SWI | SolarWinds | | Software | 11.58 | 64 | 4.61% | -7.29% |
| UMC | United Microelectronics | | Semiconductor | 7.84 | 85 | 3.84% | -7.33% |
| DLB | Dolby | | Electronics | 79.71 | 42 | 2.75% | -7.51% |
| NTCT | NetScout Systems | | Software | 20.26 | 74 | 2.43% | -7.70% |
| LBTYK | Liberty Global | | CATV | 17.14 | 52 | 2.15% | -8.05% |
| FN | Fabrinet | | Electronic | 174.19 | 35 | 0.92% | -8.48% |
| For chart view version of above stock list: Chart View ➞ 0 - 25 , 25 - 50 , 50 - 75 , 75 - 100 , 100 - 125 , 125 - 150 , 150 - 175 , 175 - 200 , 200 - 225 , 225 - 250 | ||
 | Click To Change The Sort Order: By Market Cap or Company Size Performance: Year-to-date, Week and Day |  |
|
Get the most comprehensive stock market coverage daily at 12Stocks.com ➞ Best Stocks Today ➞ Best Stocks Weekly ➞ Best Stocks Year-to-Date ➞ Best Stocks Trends ➞  Best Stocks Today 12Stocks.com Best Nasdaq Stocks ➞ Best S&P 500 Stocks ➞ Best Tech Stocks ➞ Best Biotech Stocks ➞ |
| Detailed Overview of Tech Stocks |
| Tech Technical Overview, Leaders & Laggards, Top Tech ETF Funds & Detailed Tech Stocks List, Charts, Trends & More |
| Tech Sector: Technical Analysis, Trends & YTD Performance | |
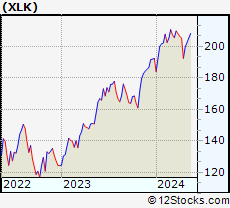
| Technology sector is composed of stocks
from semiconductors, software, web, social media
and services subsectors. Technology sector, as represented by XLK, an exchange-traded fund [ETF] that holds basket of tech stocks (e.g, Intel, Google) is up by 2.38% and is currently underperforming the overall market by -3.24% year-to-date. Below is a quick view of technical charts and trends: |
|
 XLK Weekly Chart |
|
| Long Term Trend: Not Good | |
| Medium Term Trend: Not Good | |
 XLK Daily Chart |
|
| Short Term Trend: Deteriorating | |
| Overall Trend Score: 10 | |
| YTD Performance: 2.38% | |
| **Trend Scores & Views Are Only For Educational Purposes And Not For Investing | |
| 12Stocks.com: Top Performing Technology Sector Stocks | ||||||||||||||||||||||||||||||||||||||||||||||||
 The top performing Technology sector stocks year to date are
Now, more recently, over last week, the top performing Technology sector stocks on the move are


|
||||||||||||||||||||||||||||||||||||||||||||||||
| 12Stocks.com: Investing in Tech Sector using Exchange Traded Funds | |
|
The following table shows list of key exchange traded funds (ETF) that
help investors track Tech Index. For detailed view, check out our ETF Funds section of our website. Quick View: Move mouse or cursor over ETF symbol (ticker) to view short-term technical chart and over ETF name to view long term chart. Click on ticker or stock name for detailed view. Click on to add stock symbol to your watchlist and to view watchlist. |
12Stocks.com List of ETFs that track Tech Index
| Ticker | ETF Name | Watchlist | Recent Price | Smart Investing & Trading Score | Change % | Week % | Year-to-date % |
| XLK | Technology | | 197.06 | 10 | 1.44 | -1.39 | 2.38% |
| QQQ | QQQ | | 426.90 | 17 | 1.28 | -0.95 | 4.24% |
| IYW | Technology | | 129.01 | 10 | 1.62 | -1.48 | 5.1% |
| VGT | Information Technology | | 496.06 | 17 | 1.37 | -1.56 | 2.49% |
| IXN | Global Tech | | 70.86 | 10 | 1.48 | -1.31 | 3.93% |
| IGV | Tech-Software | | 79.91 | 10 | 1.06 | -1.46 | -1.5% |
| XSD | Semiconductor | | 221.13 | 48 | 1.75 | -1.58 | -1.63% |
| TQQQ | QQQ | | 53.53 | 17 | 3.74 | -3.17 | 5.58% |
| SQQQ | Short QQQ | | 11.78 | 78 | -3.60 | 3.06 | -12.42% |
| SOXL | Semicondct Bull 3X | | 36.45 | 17 | 6.05 | -8.3 | 16.08% |
| SOXS | Semicondct Bear 3X | | 37.60 | 66 | -6.54 | 7.12 | 546.05% |
| SOXX | PHLX Semiconductor | | 211.41 | 17 | 2.25 | -2.53 | 10.09% |
| QTEC | First -100-Tech | | 180.14 | 10 | 1.58 | -2.09 | 2.66% |
| SMH | Semiconductor | | 212.03 | 30 | 2.01 | -2.58 | 21.25% |
| 12Stocks.com: Charts, Trends, Fundamental Data and Performances of Tech Stocks | |
|
We now take in-depth look at all Tech stocks including charts, multi-period performances and overall trends (as measured by Smart Investing & Trading Score). One can sort Tech stocks (click link to choose) by Daily, Weekly and by Year-to-Date performances. Also, one can sort by size of the company or by market capitalization. |
| Select Your Default Chart Type: | |||||
| |||||
| Click on stock symbol or name for detailed view. Click on to add stock symbol to your watchlist and to view watchlist. Quick View: Move mouse or cursor over "Daily" to quickly view daily technical stock chart and over "Weekly" to view weekly technical stock chart. | |||||


 | CCCS CCC Intelligent Solutions Holdings Inc. |
| Sector: Technology | |
| SubSector: Software - Infrastructure | |
| MarketCap: 6990 Millions | |
| Recent Price: 10.78 Smart Investing & Trading Score: 0 | |
| Day Percent Change: 0.61% Day Change: 0.06 | |
| Week Change: -6.22% Year-to-date Change: -5.0% | |
| CCCS Links: Profile News Message Board | |
| Charts:- Daily , Weekly | |
| Add CCCS to Watchlist: View: Get Complete CCCS Trend Analysis ➞ | |
 | PINC Premier, Inc. |
| Sector: Technology | |
| SubSector: Healthcare Information Services | |
| MarketCap: 2044.85 Millions | |
| Recent Price: 21.22 Smart Investing & Trading Score: 80 | |
| Day Percent Change: 0.76% Day Change: 0.16 | |
| Week Change: 1.24% Year-to-date Change: -5.1% | |
| PINC Links: Profile News Message Board | |
| Charts:- Daily , Weekly | |
| Add PINC to Watchlist: View: Get Complete PINC Trend Analysis ➞ | |
 | NOVT Novanta Inc. |
| Sector: Technology | |
| SubSector: Scientific & Technical Instruments | |
| MarketCap: 2680.83 Millions | |
| Recent Price: 159.65 Smart Investing & Trading Score: 25 | |
| Day Percent Change: 1.83% Day Change: 2.87 | |
| Week Change: 0.15% Year-to-date Change: -5.2% | |
| NOVT Links: Profile News Message Board | |
| Charts:- Daily , Weekly | |
| Add NOVT to Watchlist: View: Get Complete NOVT Trend Analysis ➞ | |
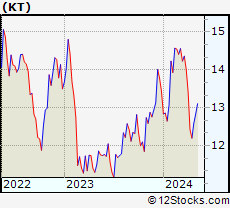 | KT KT Corporation |
| Sector: Technology | |
| SubSector: Telecom Services - Foreign | |
| MarketCap: 4216.89 Millions | |
| Recent Price: 12.74 Smart Investing & Trading Score: 57 | |
| Day Percent Change: 1.27% Day Change: 0.16 | |
| Week Change: 1.19% Year-to-date Change: -5.2% | |
| KT Links: Profile News Message Board | |
| Charts:- Daily , Weekly | |
| Add KT to Watchlist: View: Get Complete KT Trend Analysis ➞ | |
 | IDCC InterDigital, Inc. |
| Sector: Technology | |
| SubSector: Wireless Communications | |
| MarketCap: 1225.27 Millions | |
| Recent Price: 102.86 Smart Investing & Trading Score: 64 | |
| Day Percent Change: 5.07% Day Change: 4.96 | |
| Week Change: 2.13% Year-to-date Change: -5.2% | |
| IDCC Links: Profile News Message Board | |
| Charts:- Daily , Weekly | |
| Add IDCC to Watchlist: View: Get Complete IDCC Trend Analysis ➞ | |
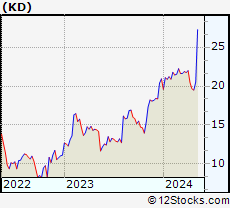 | KD Kyndryl Holdings, Inc. |
| Sector: Technology | |
| SubSector: Information Technology Services | |
| MarketCap: 2990 Millions | |
| Recent Price: 19.84 Smart Investing & Trading Score: 20 | |
| Day Percent Change: -0.75% Day Change: -0.15 | |
| Week Change: 1.8% Year-to-date Change: -5.3% | |
| KD Links: Profile News Message Board | |
| Charts:- Daily , Weekly | |
| Add KD to Watchlist: View: Get Complete KD Trend Analysis ➞ | |
 | VSH Vishay Intertechnology, Inc. |
| Sector: Technology | |
| SubSector: Semiconductor - Broad Line | |
| MarketCap: 2132.52 Millions | |
| Recent Price: 22.59 Smart Investing & Trading Score: 68 | |
| Day Percent Change: 1.62% Day Change: 0.36 | |
| Week Change: -0.18% Year-to-date Change: -5.8% | |
| VSH Links: Profile News Message Board | |
| Charts:- Daily , Weekly | |
| Add VSH to Watchlist: View: Get Complete VSH Trend Analysis ➞ | |
 | ATHM Autohome Inc. |
| Sector: Technology | |
| SubSector: Internet Information Providers | |
| MarketCap: 7984.2 Millions | |
| Recent Price: 26.44 Smart Investing & Trading Score: 95 | |
| Day Percent Change: 3.28% Day Change: 0.84 | |
| Week Change: 1.69% Year-to-date Change: -5.8% | |
| ATHM Links: Profile News Message Board | |
| Charts:- Daily , Weekly | |
| Add ATHM to Watchlist: View: Get Complete ATHM Trend Analysis ➞ | |
 | ESTC Elastic N.V. |
| Sector: Technology | |
| SubSector: Application Software | |
| MarketCap: 4420.92 Millions | |
| Recent Price: 106.10 Smart Investing & Trading Score: 45 | |
| Day Percent Change: 0.33% Day Change: 0.35 | |
| Week Change: -1.24% Year-to-date Change: -5.9% | |
| ESTC Links: Profile News Message Board | |
| Charts:- Daily , Weekly | |
| Add ESTC to Watchlist: View: Get Complete ESTC Trend Analysis ➞ | |
 | DOCN DigitalOcean Holdings, Inc. |
| Sector: Technology | |
| SubSector: Software - Infrastructure | |
| MarketCap: 3620 Millions | |
| Recent Price: 34.78 Smart Investing & Trading Score: 47 | |
| Day Percent Change: -2.11% Day Change: -0.75 | |
| Week Change: 3.79% Year-to-date Change: -6.0% | |
| DOCN Links: Profile News Message Board | |
| Charts:- Daily , Weekly | |
| Add DOCN to Watchlist: View: Get Complete DOCN Trend Analysis ➞ | |
 | SPSC SPS Commerce, Inc. |
| Sector: Technology | |
| SubSector: Application Software | |
| MarketCap: 1398.02 Millions | |
| Recent Price: 182.07 Smart Investing & Trading Score: 57 | |
| Day Percent Change: 1.73% Day Change: 3.10 | |
| Week Change: 1.74% Year-to-date Change: -6.1% | |
| SPSC Links: Profile News Message Board | |
| Charts:- Daily , Weekly | |
| Add SPSC to Watchlist: View: Get Complete SPSC Trend Analysis ➞ | |
 | GBTG Global Business Travel Group, Inc. |
| Sector: Technology | |
| SubSector: Software - Application | |
| MarketCap: 3440 Millions | |
| Recent Price: 6.13 Smart Investing & Trading Score: 93 | |
| Day Percent Change: 1.32% Day Change: 0.08 | |
| Week Change: 2.17% Year-to-date Change: -6.1% | |
| GBTG Links: Profile News Message Board | |
| Charts:- Daily , Weekly | |
| Add GBTG to Watchlist: View: Get Complete GBTG Trend Analysis ➞ | |
 | PAYO Payoneer Global Inc. |
| Sector: Technology | |
| SubSector: Software - Infrastructure | |
| MarketCap: 1710 Millions | |
| Recent Price: 4.95 Smart Investing & Trading Score: 76 | |
| Day Percent Change: 0.00% Day Change: 0.00 | |
| Week Change: -1.1% Year-to-date Change: -6.5% | |
| PAYO Links: Profile News Message Board | |
| Charts:- Daily , Weekly | |
| Add PAYO to Watchlist: View: Get Complete PAYO Trend Analysis ➞ | |
 | YEXT Yext, Inc. |
| Sector: Technology | |
| SubSector: Internet Software & Services | |
| MarketCap: 1414.91 Millions | |
| Recent Price: 5.50 Smart Investing & Trading Score: 10 | |
| Day Percent Change: -0.18% Day Change: -0.01 | |
| Week Change: -0.72% Year-to-date Change: -6.6% | |
| YEXT Links: Profile News Message Board | |
| Charts:- Daily , Weekly | |
| Add YEXT to Watchlist: View: Get Complete YEXT Trend Analysis ➞ | |
 | NABL N-able, Inc. |
| Sector: Technology | |
| SubSector: Information Technology Services | |
| MarketCap: 2590 Millions | |
| Recent Price: 12.39 Smart Investing & Trading Score: 34 | |
| Day Percent Change: 0.65% Day Change: 0.08 | |
| Week Change: -0.08% Year-to-date Change: -6.9% | |
| NABL Links: Profile News Message Board | |
| Charts:- Daily , Weekly | |
| Add NABL to Watchlist: View: Get Complete NABL Trend Analysis ➞ | |
 | NXT Nextracker Inc. |
| Sector: Technology | |
| SubSector: Solar | |
| MarketCap: 5590 Millions | |
| Recent Price: 43.41 Smart Investing & Trading Score: 24 | |
| Day Percent Change: 1.12% Day Change: 0.48 | |
| Week Change: -0.86% Year-to-date Change: -7.1% | |
| NXT Links: Profile News Message Board | |
| Charts:- Daily , Weekly | |
| Add NXT to Watchlist: View: Get Complete NXT Trend Analysis ➞ | |
 | PRGS Progress Software Corporation |
| Sector: Technology | |
| SubSector: Application Software | |
| MarketCap: 1407.22 Millions | |
| Recent Price: 50.44 Smart Investing & Trading Score: 35 | |
| Day Percent Change: 0.66% Day Change: 0.33 | |
| Week Change: 0.2% Year-to-date Change: -7.1% | |
| PRGS Links: Profile News Message Board | |
| Charts:- Daily , Weekly | |
| Add PRGS to Watchlist: View: Get Complete PRGS Trend Analysis ➞ | |
 | IT Gartner, Inc. |
| Sector: Technology | |
| SubSector: Information Technology Services | |
| MarketCap: 7767.98 Millions | |
| Recent Price: 419.04 Smart Investing & Trading Score: 0 | |
| Day Percent Change: -0.79% Day Change: -3.35 | |
| Week Change: -6.63% Year-to-date Change: -7.1% | |
| IT Links: Profile News Message Board | |
| Charts:- Daily , Weekly | |
| Add IT to Watchlist: View: Get Complete IT Trend Analysis ➞ | |
 | FFIV F5 Networks, Inc. |
| Sector: Technology | |
| SubSector: Business Software & Services | |
| MarketCap: 6675.38 Millions | |
| Recent Price: 166.07 Smart Investing & Trading Score: 0 | |
| Day Percent Change: -0.33% Day Change: -0.55 | |
| Week Change: -8.72% Year-to-date Change: -7.2% | |
| FFIV Links: Profile News Message Board | |
| Charts:- Daily , Weekly | |
| Add FFIV to Watchlist: View: Get Complete FFIV Trend Analysis ➞ | |
 | SWI SolarWinds Corporation |
| Sector: Technology | |
| SubSector: Application Software | |
| MarketCap: 4524.62 Millions | |
| Recent Price: 11.58 Smart Investing & Trading Score: 64 | |
| Day Percent Change: 4.61% Day Change: 0.51 | |
| Week Change: 4.14% Year-to-date Change: -7.3% | |
| SWI Links: Profile News Message Board | |
| Charts:- Daily , Weekly | |
| Add SWI to Watchlist: View: Get Complete SWI Trend Analysis ➞ | |
 | UMC United Microelectronics Corporation |
| Sector: Technology | |
| SubSector: Semiconductor Equipment & Materials | |
| MarketCap: 5672.78 Millions | |
| Recent Price: 7.84 Smart Investing & Trading Score: 85 | |
| Day Percent Change: 3.84% Day Change: 0.29 | |
| Week Change: 0.64% Year-to-date Change: -7.3% | |
| UMC Links: Profile News Message Board | |
| Charts:- Daily , Weekly | |
| Add UMC to Watchlist: View: Get Complete UMC Trend Analysis ➞ | |
 | DLB Dolby Laboratories, Inc. |
| Sector: Technology | |
| SubSector: Diversified Electronics | |
| MarketCap: 5618.16 Millions | |
| Recent Price: 79.71 Smart Investing & Trading Score: 42 | |
| Day Percent Change: 2.75% Day Change: 2.13 | |
| Week Change: 0.64% Year-to-date Change: -7.5% | |
| DLB Links: Profile News Message Board | |
| Charts:- Daily , Weekly | |
| Add DLB to Watchlist: View: Get Complete DLB Trend Analysis ➞ | |
 | NTCT NetScout Systems, Inc. |
| Sector: Technology | |
| SubSector: Business Software & Services | |
| MarketCap: 1657.28 Millions | |
| Recent Price: 20.26 Smart Investing & Trading Score: 74 | |
| Day Percent Change: 2.43% Day Change: 0.48 | |
| Week Change: 1.81% Year-to-date Change: -7.7% | |
| NTCT Links: Profile News Message Board | |
| Charts:- Daily , Weekly | |
| Add NTCT to Watchlist: View: Get Complete NTCT Trend Analysis ➞ | |
 | LBTYK Liberty Global plc |
| Sector: Technology | |
| SubSector: CATV Systems | |
| MarketCap: 7253.02 Millions | |
| Recent Price: 17.14 Smart Investing & Trading Score: 52 | |
| Day Percent Change: 2.15% Day Change: 0.36 | |
| Week Change: 1.72% Year-to-date Change: -8.1% | |
| LBTYK Links: Profile News Message Board | |
| Charts:- Daily , Weekly | |
| Add LBTYK to Watchlist: View: Get Complete LBTYK Trend Analysis ➞ | |
 | FN Fabrinet |
| Sector: Technology | |
| SubSector: Electronic Equipment | |
| MarketCap: 1876 Millions | |
| Recent Price: 174.19 Smart Investing & Trading Score: 35 | |
| Day Percent Change: 0.92% Day Change: 1.58 | |
| Week Change: -0.72% Year-to-date Change: -8.5% | |
| FN Links: Profile News Message Board | |
| Charts:- Daily , Weekly | |
| Add FN to Watchlist: View: Get Complete FN Trend Analysis ➞ | |
| For tabular summary view of above stock list: Summary View ➞ 0 - 25 , 25 - 50 , 50 - 75 , 75 - 100 , 100 - 125 , 125 - 150 , 150 - 175 , 175 - 200 , 200 - 225 , 225 - 250 | ||
| Click To Change The Sort Order: By Market Cap or Company Size Performance: Year-to-date, Week and Day | |
| Select Chart Type: | ||
|
Best Stocks Today 12Stocks.com |
© 2024 12Stocks.com Terms & Conditions Privacy Contact Us
All Information Provided Only For Education And Not To Be Used For Investing or Trading. See Terms & Conditions


One More Thing ... Get Best Stocks Delivered Daily!
Never Ever Miss A Move With Our Top Ten Stocks Lists
Find Best Stocks In Any Market - Bull or Bear Market
Take A Peek At Our Top Ten Stocks Lists: Daily, Weekly, Year-to-Date & Top Trends
Find Best Stocks In Any Market - Bull or Bear Market
Take A Peek At Our Top Ten Stocks Lists: Daily, Weekly, Year-to-Date & Top Trends
Technology Stocks With Best Up Trends [0-bearish to 100-bullish]: Benchmark Electronics[100], FormFactor [100], Bilibili [100], Q2 [100], TTM [100], JD.com [100], 21Vianet [100], QUALCOMM [100], Itron [100], Weibo [100], Omnicell [100]
Best Technology Stocks Year-to-Date:
MediaCo Holding[395.31%], Bakkt [187.89%], Smith Micro[178.45%], Uxin [176.75%], Super Micro[168.25%], CXApp [164.09%], SoundHound AI[113.32%], NextNav [108.76%], CuriosityStream [103.67%], MediaAlpha [98.56%], GigaCloud [89.46%] Best Technology Stocks This Week:
Bakkt [1506.2%], SYLA [79.9%], Mitcham Industries[29.66%], Koninklijke Philips[26.06%], MediaCo Holding[21.97%], Cogint [21.1%], 21Vianet [20.89%], Harmonic [20.65%], Conduent [20.26%], Phoenix New[20%], MediaAlpha [17.07%] Best Technology Stocks Daily:
CommScope Holding[20.95%], Benchmark Electronics[18.06%], FormFactor [17.64%], Bilibili [15.63%], Maxeon Solar[15.46%], Q2 [15.17%], TTM [12.73%], IAC/InterActiveCorp [12.14%], ANGI Homeservices[11.93%], Kingsoft Cloud[11.86%], JD.com [11.51%]