
 Login Sign Up


| |||||
 |  | ||||

| 12Stocks.com Market Intelligence |
Best Tech Stocks
| In a hurry? Tech Stocks Lists: Performance & Trends, Stock Charts, FANG Stocks
Sort Tech stocks: Daily, Weekly, Year-to-Date, Market Cap & Trends. Filter Tech stocks list by size:All Tech Large Mid-Range Small and MicroCap |
| 12Stocks.com Tech Stocks Performances & Trends Daily | |||||||||
|
|  The overall Smart Investing & Trading Score is 64 (0-bearish to 100-bullish) which puts Technology sector in short term neutral to bullish trend. The Smart Investing & Trading Score from previous trading session is 49 and hence an improvement of trend.
| ||||||||
Here are the Smart Investing & Trading Scores of the most requested Technology stocks at 12Stocks.com (click stock name for detailed review):
|


| 12Stocks.com: Investing in Technology sector with Stocks | |
|
The following table helps investors and traders sort through current performance and trends (as measured by Smart Investing & Trading Score) of various
stocks in the Tech sector. Quick View: Move mouse or cursor over stock symbol (ticker) to view short-term technical chart and over stock name to view long term chart. Click on  to add stock symbol to your watchlist and to add stock symbol to your watchlist and  to view watchlist. Click on any ticker or stock name for detailed market intelligence report for that stock. to view watchlist. Click on any ticker or stock name for detailed market intelligence report for that stock. |
12Stocks.com Performance of Stocks in Tech Sector
| Ticker | Stock Name | Watchlist | Category | Recent Price | Smart Investing & Trading Score | Change % | Weekly Change% |
| AUDC | AudioCodes |   | Communication | 11.39 | 74 | 3.08% | 3.08% |
| BHE | Benchmark Electronics | | Circuit Boards | 37.52 | 100 | 2.99% | 2.99% |
| MX | MagnaChip Semiconductor | | Semiconductor | 5.24 | 74 | 2.95% | 2.95% |
| RDCM | RADCOM | | Computer | 9.80 | 74 | 2.94% | 2.94% |
| MKTW | MarketWise | | Software - | 1.66 | 40 | 2.79% | 2.79% |
| GOGO | Gogo | | Communication | 9.27 | 76 | 2.77% | 2.77% |
| WBX | Wallbox N.V | | Electronic Components | 1.57 | 74 | 2.55% | 2.55% |
| EB | Eventbrite | | Software | 5.65 | 64 | 2.54% | 2.54% |
| NVEC | NVE | | Semiconductor | 74.64 | 0 | 2.53% | 2.53% |
| ICHR | Ichor | | Semiconductor | 39.14 | 14 | 2.46% | 2.46% |
| MITK | Mitek Systems | | Software | 13.71 | 65 | 2.43% | 2.43% |
| NVMI | Nova Measuring | | Semiconductor | 182.51 | 95 | 2.37% | 2.37% |
| SILC | Silicom | | Communication | 16.68 | 100 | 2.36% | 2.36% |
| DQ | Daqo New | | Semiconductor | 19.36 | 35 | 2.35% | 2.35% |
| VLN | Valens Semiconductor | | Semiconductors | 2.42 | 65 | 2.33% | 2.33% |
| CSIQ | Canadian Solar | | Semiconductor | 17.18 | 74 | 2.32% | 2.32% |
| PLUS | ePlus | | Software | 79.72 | 57 | 2.31% | 2.31% |
| ONTF | ON24 | | Software - | 6.87 | 42 | 2.31% | 2.31% |
| VTEX | VTEX | | Software - | 7.99 | 57 | 2.24% | 2.24% |
| CDLX | Cardlytics | | Internet | 15.20 | 100 | 2.15% | 2.15% |
| CRNT | Ceragon Networks | | Communication | 3.11 | 95 | 2.14% | 2.14% |
| LASR | nLIGHT | | Semiconductor | 12.40 | 64 | 2.14% | 2.14% |
| SKYT | SkyWater | | Semiconductors | 10.41 | 47 | 2.06% | 2.06% |
| CCSI | Consensus Cloud | | Software - Infrastructure | 12.68 | 52 | 2.05% | 2.05% |
| SNCR | Synchronoss | | Software | 6.58 | 25 | 2.02% | 2.02% |
| For chart view version of above stock list: Chart View ➞ 0 - 25 , 25 - 50 , 50 - 75 , 75 - 100 , 100 - 125 , 125 - 150 , 150 - 175 , 175 - 200 | ||
 | Click To Change The Sort Order: By Market Cap or Company Size Performance: Year-to-date, Week and Day |  |
|
Get the most comprehensive stock market coverage daily at 12Stocks.com ➞ Best Stocks Today ➞ Best Stocks Weekly ➞ Best Stocks Year-to-Date ➞ Best Stocks Trends ➞  Best Stocks Today 12Stocks.com Best Nasdaq Stocks ➞ Best S&P 500 Stocks ➞ Best Tech Stocks ➞ Best Biotech Stocks ➞ |
| Detailed Overview of Tech Stocks |
| Tech Technical Overview, Leaders & Laggards, Top Tech ETF Funds & Detailed Tech Stocks List, Charts, Trends & More |
| Tech Sector: Technical Analysis, Trends & YTD Performance | |
| Technology sector is composed of stocks
from semiconductors, software, web, social media
and services subsectors. Technology sector, as represented by XLK, an exchange-traded fund [ETF] that holds basket of tech stocks (e.g, Intel, Google) is up by 5.9% and is currently underperforming the overall market by -1.65% year-to-date. Below is a quick view of technical charts and trends: |
|
 XLK Weekly Chart |
|
| Long Term Trend: Not Good | |
| Medium Term Trend: Very Good | |
 XLK Daily Chart |
|
| Short Term Trend: Very Good | |
| Overall Trend Score: 64 | |
| YTD Performance: 5.9% | |
| **Trend Scores & Views Are Only For Educational Purposes And Not For Investing | |
| 12Stocks.com: Top Performing Technology Sector Stocks | ||||||||||||||||||||||||||||||||||||||||||||||||
 The top performing Technology sector stocks year to date are
Now, more recently, over last week, the top performing Technology sector stocks on the move are


|
||||||||||||||||||||||||||||||||||||||||||||||||
| 12Stocks.com: Investing in Tech Sector using Exchange Traded Funds | |
|
The following table shows list of key exchange traded funds (ETF) that
help investors track Tech Index. For detailed view, check out our ETF Funds section of our website. Quick View: Move mouse or cursor over ETF symbol (ticker) to view short-term technical chart and over ETF name to view long term chart. Click on ticker or stock name for detailed view. Click on to add stock symbol to your watchlist and to view watchlist. |
12Stocks.com List of ETFs that track Tech Index
| Ticker | ETF Name | Watchlist | Recent Price | Smart Investing & Trading Score | Change % | Week % | Year-to-date % |
| XLK | Technology | | 203.85 | 64 | 0.64 | 0.64 | 5.9% |
| IYW | Technology | | 133.38 | 62 | 0.92 | 0.92 | 8.66% |
| IXN | Global Tech | | 73.30 | 62 | 0.61 | 0.61 | 7.52% |
| XSD | Semiconductor | | 229.45 | 88 | 1.48 | 1.48 | 2.07% |
| TQQQ | QQQ | | 57.60 | 64 | 1.59 | 1.59 | 13.61% |
| SQQQ | Short QQQ | | 10.90 | 0 | -1.67 | -1.67 | -19% |
| SOXL | Semicondct Bull 3X | | 40.42 | 64 | 3.73 | 3.73 | 28.74% |
| QTEC | First -100-Tech | | 184.01 | 42 | 0.69 | 0.69 | 4.86% |
| SMH | Semiconductor | | 220.92 | 95 | 1.47 | 1.47 | 26.33% |
| 12Stocks.com: Charts, Trends, Fundamental Data and Performances of Tech Stocks | |
|
We now take in-depth look at all Tech stocks including charts, multi-period performances and overall trends (as measured by Smart Investing & Trading Score). One can sort Tech stocks (click link to choose) by Daily, Weekly and by Year-to-Date performances. Also, one can sort by size of the company or by market capitalization. |
| Select Your Default Chart Type: | |||||
| |||||
| Click on stock symbol or name for detailed view. Click on to add stock symbol to your watchlist and to view watchlist. Quick View: Move mouse or cursor over "Daily" to quickly view daily technical stock chart and over "Weekly" to view weekly technical stock chart. | |||||


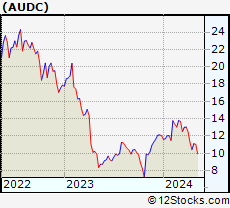 | AUDC AudioCodes Ltd. |
| Sector: Technology | |
| SubSector: Communication Equipment | |
| MarketCap: 642.239 Millions | |
| Recent Price: 11.39 Smart Investing & Trading Score: 74 | |
| Day Percent Change: 3.08% Day Change: 0.34 | |
| Week Change: 3.08% Year-to-date Change: -5.6% | |
| AUDC Links: Profile News Message Board | |
| Charts:- Daily , Weekly | |
| Add AUDC to Watchlist: View: Get Complete AUDC Trend Analysis ➞ | |
 | BHE Benchmark Electronics, Inc. |
| Sector: Technology | |
| SubSector: Printed Circuit Boards | |
| MarketCap: 766.835 Millions | |
| Recent Price: 37.52 Smart Investing & Trading Score: 100 | |
| Day Percent Change: 2.99% Day Change: 1.09 | |
| Week Change: 2.99% Year-to-date Change: 35.8% | |
| BHE Links: Profile News Message Board | |
| Charts:- Daily , Weekly | |
| Add BHE to Watchlist: View: Get Complete BHE Trend Analysis ➞ | |
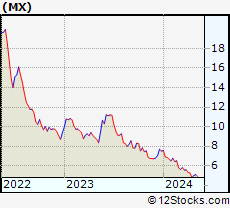 | MX MagnaChip Semiconductor Corporation |
| Sector: Technology | |
| SubSector: Semiconductor - Specialized | |
| MarketCap: 319.16 Millions | |
| Recent Price: 5.24 Smart Investing & Trading Score: 74 | |
| Day Percent Change: 2.95% Day Change: 0.15 | |
| Week Change: 2.95% Year-to-date Change: -30.1% | |
| MX Links: Profile News Message Board | |
| Charts:- Daily , Weekly | |
| Add MX to Watchlist: View: Get Complete MX Trend Analysis ➞ | |
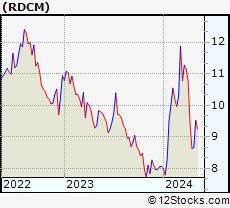 | RDCM RADCOM Ltd. |
| Sector: Technology | |
| SubSector: Computer Peripherals | |
| MarketCap: 85.5989 Millions | |
| Recent Price: 9.80 Smart Investing & Trading Score: 74 | |
| Day Percent Change: 2.94% Day Change: 0.28 | |
| Week Change: 2.94% Year-to-date Change: 21.6% | |
| RDCM Links: Profile News Message Board | |
| Charts:- Daily , Weekly | |
| Add RDCM to Watchlist: View: Get Complete RDCM Trend Analysis ➞ | |
 | MKTW MarketWise, Inc. |
| Sector: Technology | |
| SubSector: Software - Application | |
| MarketCap: 646 Millions | |
| Recent Price: 1.66 Smart Investing & Trading Score: 40 | |
| Day Percent Change: 2.79% Day Change: 0.04 | |
| Week Change: 2.79% Year-to-date Change: -38.5% | |
| MKTW Links: Profile News Message Board | |
| Charts:- Daily , Weekly | |
| Add MKTW to Watchlist: View: Get Complete MKTW Trend Analysis ➞ | |
 | GOGO Gogo Inc. |
| Sector: Technology | |
| SubSector: Diversified Communication Services | |
| MarketCap: 307.064 Millions | |
| Recent Price: 9.27 Smart Investing & Trading Score: 76 | |
| Day Percent Change: 2.77% Day Change: 0.25 | |
| Week Change: 2.77% Year-to-date Change: -8.5% | |
| GOGO Links: Profile News Message Board | |
| Charts:- Daily , Weekly | |
| Add GOGO to Watchlist: View: Get Complete GOGO Trend Analysis ➞ | |
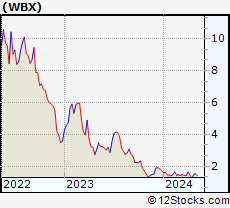 | WBX Wallbox N.V. |
| Sector: Technology | |
| SubSector: Electronic Components | |
| MarketCap: 528 Millions | |
| Recent Price: 1.57 Smart Investing & Trading Score: 74 | |
| Day Percent Change: 2.55% Day Change: 0.04 | |
| Week Change: 2.55% Year-to-date Change: -10.0% | |
| WBX Links: Profile News Message Board | |
| Charts:- Daily , Weekly | |
| Add WBX to Watchlist: View: Get Complete WBX Trend Analysis ➞ | |
 | EB Eventbrite, Inc. |
| Sector: Technology | |
| SubSector: Application Software | |
| MarketCap: 805.262 Millions | |
| Recent Price: 5.65 Smart Investing & Trading Score: 64 | |
| Day Percent Change: 2.54% Day Change: 0.14 | |
| Week Change: 2.54% Year-to-date Change: -32.4% | |
| EB Links: Profile News Message Board | |
| Charts:- Daily , Weekly | |
| Add EB to Watchlist: View: Get Complete EB Trend Analysis ➞ | |
 | NVEC NVE Corporation |
| Sector: Technology | |
| SubSector: Semiconductor - Specialized | |
| MarketCap: 231.26 Millions | |
| Recent Price: 74.64 Smart Investing & Trading Score: 0 | |
| Day Percent Change: 2.53% Day Change: 1.84 | |
| Week Change: 2.53% Year-to-date Change: -4.8% | |
| NVEC Links: Profile News Message Board | |
| Charts:- Daily , Weekly | |
| Add NVEC to Watchlist: View: Get Complete NVEC Trend Analysis ➞ | |
 | ICHR Ichor Holdings, Ltd. |
| Sector: Technology | |
| SubSector: Semiconductor Equipment & Materials | |
| MarketCap: 409.018 Millions | |
| Recent Price: 39.14 Smart Investing & Trading Score: 14 | |
| Day Percent Change: 2.46% Day Change: 0.94 | |
| Week Change: 2.46% Year-to-date Change: 16.4% | |
| ICHR Links: Profile News Message Board | |
| Charts:- Daily , Weekly | |
| Add ICHR to Watchlist: View: Get Complete ICHR Trend Analysis ➞ | |
 | MITK Mitek Systems, Inc. |
| Sector: Technology | |
| SubSector: Application Software | |
| MarketCap: 265.962 Millions | |
| Recent Price: 13.71 Smart Investing & Trading Score: 65 | |
| Day Percent Change: 2.43% Day Change: 0.32 | |
| Week Change: 2.43% Year-to-date Change: 5.1% | |
| MITK Links: Profile News Message Board | |
| Charts:- Daily , Weekly | |
| Add MITK to Watchlist: View: Get Complete MITK Trend Analysis ➞ | |
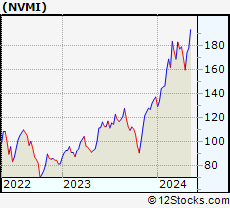 | NVMI Nova Measuring Instruments Ltd. |
| Sector: Technology | |
| SubSector: Semiconductor Equipment & Materials | |
| MarketCap: 864.118 Millions | |
| Recent Price: 182.51 Smart Investing & Trading Score: 95 | |
| Day Percent Change: 2.37% Day Change: 4.22 | |
| Week Change: 2.37% Year-to-date Change: 32.8% | |
| NVMI Links: Profile News Message Board | |
| Charts:- Daily , Weekly | |
| Add NVMI to Watchlist: View: Get Complete NVMI Trend Analysis ➞ | |
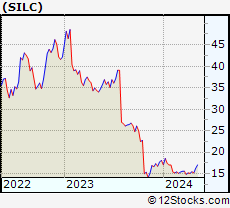 | SILC Silicom Ltd. |
| Sector: Technology | |
| SubSector: Communication Equipment | |
| MarketCap: 178.339 Millions | |
| Recent Price: 16.68 Smart Investing & Trading Score: 100 | |
| Day Percent Change: 2.36% Day Change: 0.38 | |
| Week Change: 2.36% Year-to-date Change: -7.8% | |
| SILC Links: Profile News Message Board | |
| Charts:- Daily , Weekly | |
| Add SILC to Watchlist: View: Get Complete SILC Trend Analysis ➞ | |
 | DQ Daqo New Energy Corp. |
| Sector: Technology | |
| SubSector: Semiconductor Equipment & Materials | |
| MarketCap: 660.918 Millions | |
| Recent Price: 19.36 Smart Investing & Trading Score: 35 | |
| Day Percent Change: 2.35% Day Change: 0.45 | |
| Week Change: 2.35% Year-to-date Change: -27.2% | |
| DQ Links: Profile News Message Board | |
| Charts:- Daily , Weekly | |
| Add DQ to Watchlist: View: Get Complete DQ Trend Analysis ➞ | |
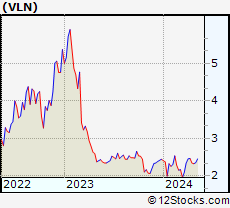 | VLN Valens Semiconductor Ltd. |
| Sector: Technology | |
| SubSector: Semiconductors | |
| MarketCap: 255 Millions | |
| Recent Price: 2.42 Smart Investing & Trading Score: 65 | |
| Day Percent Change: 2.33% Day Change: 0.06 | |
| Week Change: 2.33% Year-to-date Change: -1.4% | |
| VLN Links: Profile News Message Board | |
| Charts:- Daily , Weekly | |
| Add VLN to Watchlist: View: Get Complete VLN Trend Analysis ➞ | |
 | CSIQ Canadian Solar Inc. |
| Sector: Technology | |
| SubSector: Semiconductor - Specialized | |
| MarketCap: 957.96 Millions | |
| Recent Price: 17.18 Smart Investing & Trading Score: 74 | |
| Day Percent Change: 2.32% Day Change: 0.39 | |
| Week Change: 2.32% Year-to-date Change: -34.5% | |
| CSIQ Links: Profile News Message Board | |
| Charts:- Daily , Weekly | |
| Add CSIQ to Watchlist: View: Get Complete CSIQ Trend Analysis ➞ | |
 | PLUS ePlus inc. |
| Sector: Technology | |
| SubSector: Application Software | |
| MarketCap: 728.262 Millions | |
| Recent Price: 79.72 Smart Investing & Trading Score: 57 | |
| Day Percent Change: 2.31% Day Change: 1.80 | |
| Week Change: 2.31% Year-to-date Change: -0.2% | |
| PLUS Links: Profile News Message Board | |
| Charts:- Daily , Weekly | |
| Add PLUS to Watchlist: View: Get Complete PLUS Trend Analysis ➞ | |
 | ONTF ON24, Inc. |
| Sector: Technology | |
| SubSector: Software - Application | |
| MarketCap: 386 Millions | |
| Recent Price: 6.87 Smart Investing & Trading Score: 42 | |
| Day Percent Change: 2.31% Day Change: 0.16 | |
| Week Change: 2.31% Year-to-date Change: -12.9% | |
| ONTF Links: Profile News Message Board | |
| Charts:- Daily , Weekly | |
| Add ONTF to Watchlist: View: Get Complete ONTF Trend Analysis ➞ | |
 | VTEX VTEX |
| Sector: Technology | |
| SubSector: Software - Application | |
| MarketCap: 919 Millions | |
| Recent Price: 7.99 Smart Investing & Trading Score: 57 | |
| Day Percent Change: 2.24% Day Change: 0.18 | |
| Week Change: 2.24% Year-to-date Change: 16.7% | |
| VTEX Links: Profile News Message Board | |
| Charts:- Daily , Weekly | |
| Add VTEX to Watchlist: View: Get Complete VTEX Trend Analysis ➞ | |
 | CDLX Cardlytics, Inc. |
| Sector: Technology | |
| SubSector: Internet Information Providers | |
| MarketCap: 855.48 Millions | |
| Recent Price: 15.20 Smart Investing & Trading Score: 100 | |
| Day Percent Change: 2.15% Day Change: 0.32 | |
| Week Change: 2.15% Year-to-date Change: 65.0% | |
| CDLX Links: Profile News Message Board | |
| Charts:- Daily , Weekly | |
| Add CDLX to Watchlist: View: Get Complete CDLX Trend Analysis ➞ | |
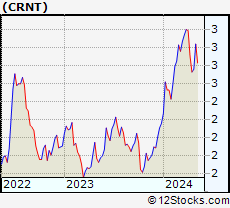 | CRNT Ceragon Networks Ltd. |
| Sector: Technology | |
| SubSector: Communication Equipment | |
| MarketCap: 126.539 Millions | |
| Recent Price: 3.11 Smart Investing & Trading Score: 95 | |
| Day Percent Change: 2.14% Day Change: 0.06 | |
| Week Change: 2.14% Year-to-date Change: 43.8% | |
| CRNT Links: Profile News Message Board | |
| Charts:- Daily , Weekly | |
| Add CRNT to Watchlist: View: Get Complete CRNT Trend Analysis ➞ | |
 | LASR nLIGHT, Inc. |
| Sector: Technology | |
| SubSector: Semiconductor - Broad Line | |
| MarketCap: 445.642 Millions | |
| Recent Price: 12.40 Smart Investing & Trading Score: 64 | |
| Day Percent Change: 2.14% Day Change: 0.26 | |
| Week Change: 2.14% Year-to-date Change: -8.2% | |
| LASR Links: Profile News Message Board | |
| Charts:- Daily , Weekly | |
| Add LASR to Watchlist: View: Get Complete LASR Trend Analysis ➞ | |
 | SKYT SkyWater Technology, Inc. |
| Sector: Technology | |
| SubSector: Semiconductors | |
| MarketCap: 394 Millions | |
| Recent Price: 10.41 Smart Investing & Trading Score: 47 | |
| Day Percent Change: 2.06% Day Change: 0.21 | |
| Week Change: 2.06% Year-to-date Change: 8.0% | |
| SKYT Links: Profile News Message Board | |
| Charts:- Daily , Weekly | |
| Add SKYT to Watchlist: View: Get Complete SKYT Trend Analysis ➞ | |
 | CCSI Consensus Cloud Solutions, Inc. |
| Sector: Technology | |
| SubSector: Software - Infrastructure | |
| MarketCap: 609 Millions | |
| Recent Price: 12.68 Smart Investing & Trading Score: 52 | |
| Day Percent Change: 2.05% Day Change: 0.25 | |
| Week Change: 2.05% Year-to-date Change: -52.4% | |
| CCSI Links: Profile News Message Board | |
| Charts:- Daily , Weekly | |
| Add CCSI to Watchlist: View: Get Complete CCSI Trend Analysis ➞ | |
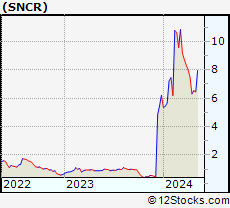 | SNCR Synchronoss Technologies, Inc. |
| Sector: Technology | |
| SubSector: Application Software | |
| MarketCap: 232.262 Millions | |
| Recent Price: 6.58 Smart Investing & Trading Score: 25 | |
| Day Percent Change: 2.02% Day Change: 0.13 | |
| Week Change: 2.02% Year-to-date Change: 6.0% | |
| SNCR Links: Profile News Message Board | |
| Charts:- Daily , Weekly | |
| Add SNCR to Watchlist: View: Get Complete SNCR Trend Analysis ➞ | |
| For tabular summary view of above stock list: Summary View ➞ 0 - 25 , 25 - 50 , 50 - 75 , 75 - 100 , 100 - 125 , 125 - 150 , 150 - 175 , 175 - 200 | ||
| Click To Change The Sort Order: By Market Cap or Company Size Performance: Year-to-date, Week and Day | |
| Select Chart Type: | ||
|
Best Stocks Today 12Stocks.com |
© 2024 12Stocks.com Terms & Conditions Privacy Contact Us
All Information Provided Only For Education And Not To Be Used For Investing or Trading. See Terms & Conditions


One More Thing ... Get Best Stocks Delivered Daily!
Never Ever Miss A Move With Our Top Ten Stocks Lists
Find Best Stocks In Any Market - Bull or Bear Market
Take A Peek At Our Top Ten Stocks Lists: Daily, Weekly, Year-to-Date & Top Trends
Find Best Stocks In Any Market - Bull or Bear Market
Take A Peek At Our Top Ten Stocks Lists: Daily, Weekly, Year-to-Date & Top Trends
Technology Stocks With Best Up Trends [0-bearish to 100-bullish]: Silicon Motion[100], Arlo [100], Sensata [100], Benchmark Electronics[100], Warner Music[100], Jamf Holding[100], Silicom [100], First Solar[100], Telecom Argentina[100], Cardlytics [100], Weibo [100]
Best Technology Stocks Year-to-Date:
MicroCloud Hologram[520.14%], MediaCo Holding[400%], Bakkt [200.9%], Uxin [188.16%], CXApp [186.49%], Super Micro[183.18%], SoundHound AI[124.3%], GigaCloud [118.24%], CuriosityStream [107.37%], MicroStrategy [103.05%], MediaAlpha [102.29%] Best Technology Stocks This Week:
Perficient [52.9%], Upland Software[20.46%], Arteris [20.25%], Quantum [11.44%], CXApp [11.08%], GigaCloud [10.72%], SoundHound AI[10.34%], Applied Optoelectronics[9.94%], AXT [9.84%], SYLA [9.69%], 2U [9.06%] Best Technology Stocks Daily:
Perficient [52.90%], Upland Software[20.46%], Arteris [20.25%], Quantum [11.44%], CXApp [11.08%], GigaCloud [10.72%], SoundHound AI[10.34%], Applied Optoelectronics[9.94%], AXT [9.84%], SYLA [9.69%], 2U [9.06%]