
 Login Sign Up


| |||||
 |  | ||||

| 12Stocks.com Market Intelligence |
Best Tech Stocks
| In a hurry? Tech Stocks Lists: Performance & Trends, Stock Charts, FANG Stocks
Sort Tech stocks: Daily, Weekly, Year-to-Date, Market Cap & Trends. Filter Tech stocks list by size:All Tech Large Mid-Range Small and MicroCap |
| 12Stocks.com Tech Stocks Performances & Trends Daily | |||||||||
|
|  The overall Smart Investing & Trading Score is 64 (0-bearish to 100-bullish) which puts Technology sector in short term neutral to bullish trend. The Smart Investing & Trading Score from previous trading session is 49 and hence an improvement of trend.
| ||||||||
Here are the Smart Investing & Trading Scores of the most requested Technology stocks at 12Stocks.com (click stock name for detailed review):
|


| 12Stocks.com: Investing in Technology sector with Stocks | |
|
The following table helps investors and traders sort through current performance and trends (as measured by Smart Investing & Trading Score) of various
stocks in the Tech sector. Quick View: Move mouse or cursor over stock symbol (ticker) to view short-term technical chart and over stock name to view long term chart. Click on  to add stock symbol to your watchlist and to add stock symbol to your watchlist and  to view watchlist. Click on any ticker or stock name for detailed market intelligence report for that stock. to view watchlist. Click on any ticker or stock name for detailed market intelligence report for that stock. |
12Stocks.com Performance of Stocks in Tech Sector
| Ticker | Stock Name | Watchlist | Category | Recent Price | Smart Investing & Trading Score | Change % | Weekly Change% |
| GILT | Gilat Satellite |   | Communication | 5.54 | 64 | 1.28% | 1.28% |
| PI | Impinj | | Communication | 163.18 | 90 | 1.21% | 1.21% |
| INFN | Infinera | | Communication | 5.30 | 90 | 1.15% | 1.15% |
| VPG | Vishay Precision | | Instruments | 34.40 | 87 | 1.00% | 1.00% |
| UXIN | Uxin | | Internet | 2.04 | 59 | 0.99% | 0.99% |
| GRND | Grindr | | Software - | 10.45 | 85 | 0.97% | 0.97% |
| HEAR | Turtle Beach | | Communication | 15.20 | 65 | 0.93% | 0.93% |
| MGIC | Magic Software | | Software | 12.12 | 95 | 0.92% | 0.92% |
| PLAB | Photronics | | Semiconductor | 29.03 | 77 | 0.87% | 0.87% |
| MTLS | Materialise NV | | Software | 5.43 | 62 | 0.83% | 0.83% |
| AIXI | Xiao-I | | Software - | 1.26 | 27 | 0.80% | 0.80% |
| III | Information Services | | IT | 3.37 | 20 | 0.75% | 0.75% |
| CALX | Calix | | Communication | 29.78 | 74 | 0.74% | 0.74% |
| HBB | Hamilton Beach | | Electronic | 23.52 | 100 | 0.73% | 0.73% |
| TGAN | Transphorm | | Semiconductor | 4.90 | 80 | 0.72% | 0.72% |
| SPNS | Sapiens | | Software | 31.07 | 73 | 0.68% | 0.68% |
| HCKT | Hackett | | IT | 22.29 | 49 | 0.68% | 0.68% |
| MXL | MaxLinear | | Semiconductor | 20.12 | 83 | 0.65% | 0.65% |
| CANG | Cango | | Internet | 1.56 | 95 | 0.65% | 0.65% |
| IGLD | Internet Gold- | | Communication | 20.02 | 17 | 0.60% | 0.60% |
| HURC | Hurco | | Instruments | 18.34 | 35 | 0.58% | 0.58% |
| CNSL | Consolidated | | Telecom | 4.34 | 70 | 0.58% | 0.58% |
| DQ | Daqo New | | Semiconductor | 19.02 | 35 | 0.58% | 0.58% |
| PXLW | Pixelworks | | Semiconductor | 1.90 | 15 | 0.53% | 0.53% |
| EVH | Evolent Health | | Healthcare Information | 27.24 | 10 | 0.52% | 0.52% |
| For chart view version of above stock list: Chart View ➞ 0 - 25 , 25 - 50 , 50 - 75 , 75 - 100 , 100 - 125 , 125 - 150 , 150 - 175 , 175 - 200 , 200 - 225 | ||
 | Click To Change The Sort Order: By Market Cap or Company Size Performance: Year-to-date, Week and Day |  |
|
Get the most comprehensive stock market coverage daily at 12Stocks.com ➞ Best Stocks Today ➞ Best Stocks Weekly ➞ Best Stocks Year-to-Date ➞ Best Stocks Trends ➞  Best Stocks Today 12Stocks.com Best Nasdaq Stocks ➞ Best S&P 500 Stocks ➞ Best Tech Stocks ➞ Best Biotech Stocks ➞ |
| Detailed Overview of Tech Stocks |
| Tech Technical Overview, Leaders & Laggards, Top Tech ETF Funds & Detailed Tech Stocks List, Charts, Trends & More |
| Tech Sector: Technical Analysis, Trends & YTD Performance | |
| Technology sector is composed of stocks
from semiconductors, software, web, social media
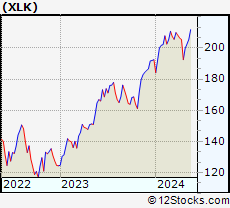
and services subsectors. Technology sector, as represented by XLK, an exchange-traded fund [ETF] that holds basket of tech stocks (e.g, Intel, Google) is up by 6.47% and is currently underperforming the overall market by -1.55% year-to-date. Below is a quick view of technical charts and trends: |
|
 XLK Weekly Chart |
|
| Long Term Trend: Not Good | |
| Medium Term Trend: Very Good | |
 XLK Daily Chart |
|
| Short Term Trend: Very Good | |
| Overall Trend Score: 64 | |
| YTD Performance: 6.47% | |
| **Trend Scores & Views Are Only For Educational Purposes And Not For Investing | |
| 12Stocks.com: Top Performing Technology Sector Stocks | ||||||||||||||||||||||||||||||||||||||||||||||||
 The top performing Technology sector stocks year to date are
Now, more recently, over last week, the top performing Technology sector stocks on the move are


|
||||||||||||||||||||||||||||||||||||||||||||||||
| 12Stocks.com: Investing in Tech Sector using Exchange Traded Funds | |
|
The following table shows list of key exchange traded funds (ETF) that
help investors track Tech Index. For detailed view, check out our ETF Funds section of our website. Quick View: Move mouse or cursor over ETF symbol (ticker) to view short-term technical chart and over ETF name to view long term chart. Click on ticker or stock name for detailed view. Click on to add stock symbol to your watchlist and to view watchlist. |
12Stocks.com List of ETFs that track Tech Index
| Ticker | ETF Name | Watchlist | Recent Price | Smart Investing & Trading Score | Change % | Week % | Year-to-date % |
| XLK | Technology | | 204.93 | 64 | 1.18 | 1.18 | 6.47% |
| QQQ | QQQ | | 440.30 | 77 | 1.11 | 1.11 | 7.52% |
| IYW | Technology | | 134.23 | 77 | 1.56 | 1.56 | 9.35% |
| VGT | Information Technology | | 516.83 | 29 | 1.45 | 1.45 | 6.78% |
| IXN | Global Tech | | 73.87 | 77 | 1.39 | 1.39 | 8.35% |
| IGV | Tech-Software | | 81.99 | 29 | 1.38 | 1.38 | 1.06% |
| XSD | Semiconductor | | 230.00 | 100 | 1.72 | 1.72 | 2.32% |
| TQQQ | QQQ | | 58.58 | 64 | 3.31 | 3.31 | 15.53% |
| SQQQ | Short QQQ | | 10.71 | 0 | -3.34 | -3.34 | -20.37% |
| SOXL | Semicondct Bull 3X | | 41.30 | 64 | 5.98 | 5.98 | 31.53% |
| SOXS | Semicondct Bear 3X | | 33.01 | 31 | -6.01 | -6.01 | 467.18% |
| SOXX | PHLX Semiconductor | | 220.61 | 42 | 2.05 | 2.05 | 14.88% |
| QTEC | First -100-Tech | | 184.97 | 64 | 1.22 | 1.22 | 5.42% |
| SMH | Semiconductor | | 222.67 | 95 | 2.27 | 2.27 | 27.33% |
| 12Stocks.com: Charts, Trends, Fundamental Data and Performances of Tech Stocks | |
|
We now take in-depth look at all Tech stocks including charts, multi-period performances and overall trends (as measured by Smart Investing & Trading Score). One can sort Tech stocks (click link to choose) by Daily, Weekly and by Year-to-Date performances. Also, one can sort by size of the company or by market capitalization. |
| Select Your Default Chart Type: | |||||
| |||||
| Click on stock symbol or name for detailed view. Click on to add stock symbol to your watchlist and to view watchlist. Quick View: Move mouse or cursor over "Daily" to quickly view daily technical stock chart and over "Weekly" to view weekly technical stock chart. | |||||


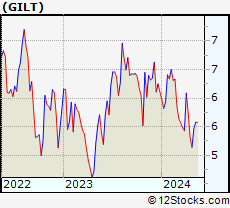 | GILT Gilat Satellite Networks Ltd. |
| Sector: Technology | |
| SubSector: Communication Equipment | |
| MarketCap: 343.739 Millions | |
| Recent Price: 5.54 Smart Investing & Trading Score: 64 | |
| Day Percent Change: 1.28% Day Change: 0.07 | |
| Week Change: 1.28% Year-to-date Change: -9.3% | |
| GILT Links: Profile News Message Board | |
| Charts:- Daily , Weekly | |
| Add GILT to Watchlist: View: Get Complete GILT Trend Analysis ➞ | |
 | PI Impinj, Inc. |
| Sector: Technology | |
| SubSector: Communication Equipment | |
| MarketCap: 364.739 Millions | |
| Recent Price: 163.18 Smart Investing & Trading Score: 90 | |
| Day Percent Change: 1.21% Day Change: 1.95 | |
| Week Change: 1.21% Year-to-date Change: 81.3% | |
| PI Links: Profile News Message Board | |
| Charts:- Daily , Weekly | |
| Add PI to Watchlist: View: Get Complete PI Trend Analysis ➞ | |
 | INFN Infinera Corporation |
| Sector: Technology | |
| SubSector: Communication Equipment | |
| MarketCap: 943 Millions | |
| Recent Price: 5.30 Smart Investing & Trading Score: 90 | |
| Day Percent Change: 1.15% Day Change: 0.06 | |
| Week Change: 1.15% Year-to-date Change: 11.6% | |
| INFN Links: Profile News Message Board | |
| Charts:- Daily , Weekly | |
| Add INFN to Watchlist: View: Get Complete INFN Trend Analysis ➞ | |
 | VPG Vishay Precision Group, Inc. |
| Sector: Technology | |
| SubSector: Scientific & Technical Instruments | |
| MarketCap: 261.553 Millions | |
| Recent Price: 34.40 Smart Investing & Trading Score: 87 | |
| Day Percent Change: 1.00% Day Change: 0.34 | |
| Week Change: 1% Year-to-date Change: 1.0% | |
| VPG Links: Profile News Message Board | |
| Charts:- Daily , Weekly | |
| Add VPG to Watchlist: View: Get Complete VPG Trend Analysis ➞ | |
 | UXIN Uxin Limited |
| Sector: Technology | |
| SubSector: Internet Information Providers | |
| MarketCap: 414.58 Millions | |
| Recent Price: 2.04 Smart Investing & Trading Score: 59 | |
| Day Percent Change: 0.99% Day Change: 0.02 | |
| Week Change: 0.99% Year-to-date Change: 191.0% | |
| UXIN Links: Profile News Message Board | |
| Charts:- Daily , Weekly | |
| Add UXIN to Watchlist: View: Get Complete UXIN Trend Analysis ➞ | |
 | GRND Grindr Inc. |
| Sector: Technology | |
| SubSector: Software - Application | |
| MarketCap: 929 Millions | |
| Recent Price: 10.45 Smart Investing & Trading Score: 85 | |
| Day Percent Change: 0.97% Day Change: 0.10 | |
| Week Change: 0.97% Year-to-date Change: 16.6% | |
| GRND Links: Profile News Message Board | |
| Charts:- Daily , Weekly | |
| Add GRND to Watchlist: View: Get Complete GRND Trend Analysis ➞ | |
 | HEAR Turtle Beach Corporation |
| Sector: Technology | |
| SubSector: Communication Equipment | |
| MarketCap: 73.0539 Millions | |
| Recent Price: 15.20 Smart Investing & Trading Score: 65 | |
| Day Percent Change: 0.93% Day Change: 0.14 | |
| Week Change: 0.93% Year-to-date Change: 38.8% | |
| HEAR Links: Profile News Message Board | |
| Charts:- Daily , Weekly | |
| Add HEAR to Watchlist: View: Get Complete HEAR Trend Analysis ➞ | |
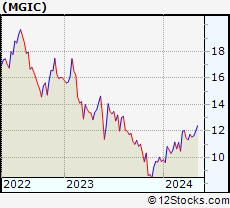 | MGIC Magic Software Enterprises Ltd. |
| Sector: Technology | |
| SubSector: Application Software | |
| MarketCap: 379.162 Millions | |
| Recent Price: 12.12 Smart Investing & Trading Score: 95 | |
| Day Percent Change: 0.92% Day Change: 0.11 | |
| Week Change: 0.92% Year-to-date Change: 25.1% | |
| MGIC Links: Profile News Message Board | |
| Charts:- Daily , Weekly | |
| Add MGIC to Watchlist: View: Get Complete MGIC Trend Analysis ➞ | |
 | PLAB Photronics, Inc. |
| Sector: Technology | |
| SubSector: Semiconductor Equipment & Materials | |
| MarketCap: 709.018 Millions | |
| Recent Price: 29.03 Smart Investing & Trading Score: 77 | |
| Day Percent Change: 0.87% Day Change: 0.25 | |
| Week Change: 0.87% Year-to-date Change: -7.5% | |
| PLAB Links: Profile News Message Board | |
| Charts:- Daily , Weekly | |
| Add PLAB to Watchlist: View: Get Complete PLAB Trend Analysis ➞ | |
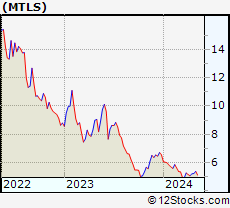 | MTLS Materialise NV |
| Sector: Technology | |
| SubSector: Application Software | |
| MarketCap: 914.462 Millions | |
| Recent Price: 5.43 Smart Investing & Trading Score: 62 | |
| Day Percent Change: 0.83% Day Change: 0.04 | |
| Week Change: 0.83% Year-to-date Change: -17.2% | |
| MTLS Links: Profile News Message Board | |
| Charts:- Daily , Weekly | |
| Add MTLS to Watchlist: View: Get Complete MTLS Trend Analysis ➞ | |
 | AIXI Xiao-I Corporation |
| Sector: Technology | |
| SubSector: Software - Application | |
| MarketCap: 431 Millions | |
| Recent Price: 1.26 Smart Investing & Trading Score: 27 | |
| Day Percent Change: 0.80% Day Change: 0.01 | |
| Week Change: 0.8% Year-to-date Change: -44.0% | |
| AIXI Links: Profile News Message Board | |
| Charts:- Daily , Weekly | |
| Add AIXI to Watchlist: View: Get Complete AIXI Trend Analysis ➞ | |
 | III Information Services Group, Inc. |
| Sector: Technology | |
| SubSector: Information Technology Services | |
| MarketCap: 166.968 Millions | |
| Recent Price: 3.37 Smart Investing & Trading Score: 20 | |
| Day Percent Change: 0.75% Day Change: 0.03 | |
| Week Change: 0.75% Year-to-date Change: -28.6% | |
| III Links: Profile News Message Board | |
| Charts:- Daily , Weekly | |
| Add III to Watchlist: View: Get Complete III Trend Analysis ➞ | |
 | CALX Calix, Inc. |
| Sector: Technology | |
| SubSector: Communication Equipment | |
| MarketCap: 390.039 Millions | |
| Recent Price: 29.78 Smart Investing & Trading Score: 74 | |
| Day Percent Change: 0.74% Day Change: 0.22 | |
| Week Change: 0.74% Year-to-date Change: -31.8% | |
| CALX Links: Profile News Message Board | |
| Charts:- Daily , Weekly | |
| Add CALX to Watchlist: View: Get Complete CALX Trend Analysis ➞ | |
 | HBB Hamilton Beach Brands Holding Company |
| Sector: Technology | |
| SubSector: Electronic Equipment | |
| MarketCap: 105.7 Millions | |
| Recent Price: 23.52 Smart Investing & Trading Score: 100 | |
| Day Percent Change: 0.73% Day Change: 0.17 | |
| Week Change: 0.73% Year-to-date Change: 34.5% | |
| HBB Links: Profile News Message Board | |
| Charts:- Daily , Weekly | |
| Add HBB to Watchlist: View: Get Complete HBB Trend Analysis ➞ | |
 | TGAN Transphorm, Inc. |
| Sector: Technology | |
| SubSector: Semiconductor Equipment & Materials | |
| MarketCap: 194 Millions | |
| Recent Price: 4.90 Smart Investing & Trading Score: 80 | |
| Day Percent Change: 0.72% Day Change: 0.04 | |
| Week Change: 0.72% Year-to-date Change: 33.7% | |
| TGAN Links: Profile News Message Board | |
| Charts:- Daily , Weekly | |
| Add TGAN to Watchlist: View: Get Complete TGAN Trend Analysis ➞ | |
 | SPNS Sapiens International Corporation N.V. |
| Sector: Technology | |
| SubSector: Business Software & Services | |
| MarketCap: 841.858 Millions | |
| Recent Price: 31.07 Smart Investing & Trading Score: 73 | |
| Day Percent Change: 0.68% Day Change: 0.21 | |
| Week Change: 0.68% Year-to-date Change: 7.4% | |
| SPNS Links: Profile News Message Board | |
| Charts:- Daily , Weekly | |
| Add SPNS to Watchlist: View: Get Complete SPNS Trend Analysis ➞ | |
 | HCKT The Hackett Group, Inc. |
| Sector: Technology | |
| SubSector: Information Technology Services | |
| MarketCap: 334.468 Millions | |
| Recent Price: 22.29 Smart Investing & Trading Score: 49 | |
| Day Percent Change: 0.68% Day Change: 0.15 | |
| Week Change: 0.68% Year-to-date Change: -2.1% | |
| HCKT Links: Profile News Message Board | |
| Charts:- Daily , Weekly | |
| Add HCKT to Watchlist: View: Get Complete HCKT Trend Analysis ➞ | |
 | MXL MaxLinear, Inc. |
| Sector: Technology | |
| SubSector: Semiconductor - Integrated Circuits | |
| MarketCap: 751.31 Millions | |
| Recent Price: 20.12 Smart Investing & Trading Score: 83 | |
| Day Percent Change: 0.65% Day Change: 0.13 | |
| Week Change: 0.65% Year-to-date Change: -15.4% | |
| MXL Links: Profile News Message Board | |
| Charts:- Daily , Weekly | |
| Add MXL to Watchlist: View: Get Complete MXL Trend Analysis ➞ | |
 | CANG Cango Inc. |
| Sector: Technology | |
| SubSector: Internet Information Providers | |
| MarketCap: 947.48 Millions | |
| Recent Price: 1.56 Smart Investing & Trading Score: 95 | |
| Day Percent Change: 0.65% Day Change: 0.01 | |
| Week Change: 0.65% Year-to-date Change: 52.9% | |
| CANG Links: Profile News Message Board | |
| Charts:- Daily , Weekly | |
| Add CANG to Watchlist: View: Get Complete CANG Trend Analysis ➞ | |
 | IGLD Internet Gold- Golden Lines Ltd. |
| Sector: Technology | |
| SubSector: Diversified Communication Services | |
| MarketCap: 204.84 Millions | |
| Recent Price: 20.02 Smart Investing & Trading Score: 17 | |
| Day Percent Change: 0.60% Day Change: 0.12 | |
| Week Change: 0.6% Year-to-date Change: 4.2% | |
| IGLD Links: Profile News Message Board | |
| Charts:- Daily , Weekly | |
| Add IGLD to Watchlist: View: Get Complete IGLD Trend Analysis ➞ | |
 | HURC Hurco Companies, Inc. |
| Sector: Technology | |
| SubSector: Scientific & Technical Instruments | |
| MarketCap: 169.253 Millions | |
| Recent Price: 18.34 Smart Investing & Trading Score: 35 | |
| Day Percent Change: 0.58% Day Change: 0.11 | |
| Week Change: 0.58% Year-to-date Change: -14.8% | |
| HURC Links: Profile News Message Board | |
| Charts:- Daily , Weekly | |
| Add HURC to Watchlist: View: Get Complete HURC Trend Analysis ➞ | |
 | CNSL Consolidated Communications Holdings, Inc. |
| Sector: Technology | |
| SubSector: Telecom Services - Domestic | |
| MarketCap: 319.677 Millions | |
| Recent Price: 4.34 Smart Investing & Trading Score: 70 | |
| Day Percent Change: 0.58% Day Change: 0.02 | |
| Week Change: 0.58% Year-to-date Change: -0.1% | |
| CNSL Links: Profile News Message Board | |
| Charts:- Daily , Weekly | |
| Add CNSL to Watchlist: View: Get Complete CNSL Trend Analysis ➞ | |
 | DQ Daqo New Energy Corp. |
| Sector: Technology | |
| SubSector: Semiconductor Equipment & Materials | |
| MarketCap: 660.918 Millions | |
| Recent Price: 19.02 Smart Investing & Trading Score: 35 | |
| Day Percent Change: 0.58% Day Change: 0.11 | |
| Week Change: 0.58% Year-to-date Change: -28.5% | |
| DQ Links: Profile News Message Board | |
| Charts:- Daily , Weekly | |
| Add DQ to Watchlist: View: Get Complete DQ Trend Analysis ➞ | |
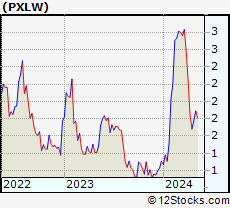 | PXLW Pixelworks, Inc. |
| Sector: Technology | |
| SubSector: Semiconductor - Integrated Circuits | |
| MarketCap: 113.51 Millions | |
| Recent Price: 1.90 Smart Investing & Trading Score: 15 | |
| Day Percent Change: 0.53% Day Change: 0.01 | |
| Week Change: 0.53% Year-to-date Change: 45.0% | |
| PXLW Links: Profile News Message Board | |
| Charts:- Daily , Weekly | |
| Add PXLW to Watchlist: View: Get Complete PXLW Trend Analysis ➞ | |
 | EVH Evolent Health, Inc. |
| Sector: Technology | |
| SubSector: Healthcare Information Services | |
| MarketCap: 486.755 Millions | |
| Recent Price: 27.24 Smart Investing & Trading Score: 10 | |
| Day Percent Change: 0.52% Day Change: 0.14 | |
| Week Change: 0.52% Year-to-date Change: -17.5% | |
| EVH Links: Profile News Message Board | |
| Charts:- Daily , Weekly | |
| Add EVH to Watchlist: View: Get Complete EVH Trend Analysis ➞ | |
| For tabular summary view of above stock list: Summary View ➞ 0 - 25 , 25 - 50 , 50 - 75 , 75 - 100 , 100 - 125 , 125 - 150 , 150 - 175 , 175 - 200 , 200 - 225 | ||
| Click To Change The Sort Order: By Market Cap or Company Size Performance: Year-to-date, Week and Day | |
| Select Chart Type: | ||
|
Best Stocks Today 12Stocks.com |
© 2024 12Stocks.com Terms & Conditions Privacy Contact Us
All Information Provided Only For Education And Not To Be Used For Investing or Trading. See Terms & Conditions


One More Thing ... Get Best Stocks Delivered Daily!
Never Ever Miss A Move With Our Top Ten Stocks Lists
Find Best Stocks In Any Market - Bull or Bear Market
Take A Peek At Our Top Ten Stocks Lists: Daily, Weekly, Year-to-Date & Top Trends
Find Best Stocks In Any Market - Bull or Bear Market
Take A Peek At Our Top Ten Stocks Lists: Daily, Weekly, Year-to-Date & Top Trends
Technology Stocks With Best Up Trends [0-bearish to 100-bullish]: Perficient [100], GigaCloud [100], Universal Electronics[100], Silicon Motion[100], Benchmark Electronics[100], Onto Innovation[100], Arlo [100], Warner Music[100], Red Violet[100], NetApp [100], Jamf Holding[100]
Best Technology Stocks Year-to-Date:
MicroCloud Hologram[498.56%], MediaCo Holding[383.57%], Smith Micro[214.77%], Bakkt [197.53%], CXApp [194.21%], Super Micro[192.28%], Uxin [191.01%], SoundHound AI[142.99%], CuriosityStream [125.88%], GigaCloud [124.6%], MicroStrategy [100.59%] Best Technology Stocks This Week:
Perficient [52.24%], Arteris [32.26%], Upland Software[23.55%], SoundHound AI[19.54%], CXApp [14.07%], GigaCloud [13.95%], Thoughtworks Holding[12%], Universal Electronics[11.94%], SYLA [11.42%], Smith Micro[11.11%], Telephone and[9.33%] Best Technology Stocks Daily:
Perficient [52.24%], Arteris [32.26%], Upland Software[23.55%], SoundHound AI[19.54%], CXApp [14.07%], GigaCloud [13.95%], Thoughtworks Holding[12.00%], Universal Electronics[11.94%], SYLA [11.42%], Smith Micro[11.11%], Telephone and[9.33%]