
 Login Sign Up


| |||||
 |  | ||||

| 12Stocks.com Market Intelligence |
Best Tech Stocks
| In a hurry? Tech Stocks Lists: Performance & Trends, Stock Charts, FANG Stocks
Sort Tech stocks: Daily, Weekly, Year-to-Date, Market Cap & Trends. Filter Tech stocks list by size:All Tech Large Mid-Range Small and MicroCap |
| 12Stocks.com Tech Stocks Performances & Trends Daily | |||||||||
|
|  The overall Smart Investing & Trading Score is 38 (0-bearish to 100-bullish) which puts Technology sector in short term bearish to neutral trend. The Smart Investing & Trading Score from previous trading session is 45 and hence a deterioration of trend.
| ||||||||
Here are the Smart Investing & Trading Scores of the most requested Technology stocks at 12Stocks.com (click stock name for detailed review):
|


| 12Stocks.com: Investing in Technology sector with Stocks | |
|
The following table helps investors and traders sort through current performance and trends (as measured by Smart Investing & Trading Score) of various
stocks in the Tech sector. Quick View: Move mouse or cursor over stock symbol (ticker) to view short-term technical chart and over stock name to view long term chart. Click on  to add stock symbol to your watchlist and to add stock symbol to your watchlist and  to view watchlist. Click on any ticker or stock name for detailed market intelligence report for that stock. to view watchlist. Click on any ticker or stock name for detailed market intelligence report for that stock. |
12Stocks.com Performance of Stocks in Tech Sector
| Ticker | Stock Name | Watchlist | Category | Recent Price | Smart Investing & Trading Score | Change % | YTD Change% |
| LPL | LG Display |   | Electronics | 3.96 | 67 | -2.22% | -17.84% |
| JBL | Jabil | | Circuit Boards | 118.48 | 18 | -1.46% | -7.00% |
| CYBR | CyberArk Software | | Software | 245.07 | 51 | 0.22% | 11.88% |
| AUR | Aurora Innovation | | IT | 2.82 | 5 | -0.88% | -35.98% |
| SATS | EchoStar | | Communication | 16.02 | 100 | 0.88% | -3.32% |
| BILL | Bill.com | | Software | 60.50 | 30 | -1.48% | -25.85% |
| PSTG | Pure Storage | | Data Storage | 52.22 | 56 | 3.10% | 46.44% |
| KD | Kyndryl | | IT | 20.14 | 25 | -0.69% | -3.82% |
| GLOB | Globant S.A | | IT | 179.14 | 35 | -2.27% | -24.72% |
| BL | BlackLine | | Software | 58.89 | 61 | -1.74% | -5.69% |
| CRCT | Cricut | | Computer Hardware | 5.41 | 100 | 2.75% | -18.95% |
| VRNT | Verint Systems | | Software | 30.20 | 83 | -2.71% | 11.73% |
| BLKB | Blackbaud | | Software | 78.28 | 57 | -0.13% | -9.71% |
| ANGI | ANGI Homeservices | | Internet | 2.06 | 25 | 0.00% | -17.27% |
| DSGX | Descartes Systems | | Software | 94.50 | 100 | 0.00% | 12.42% |
| INTA | Intapp | | Software - | 31.45 | 42 | 1.16% | -17.61% |
| QTWO | Q2 | | Software | 52.89 | 93 | -1.65% | 21.84% |
| OMCL | Omnicell | | Healthcare Information | 27.13 | 30 | -1.09% | -27.90% |
| NVT | nVent Electric | | Electronics | 74.44 | 41 | 0.98% | 25.98% |
| APPN | Appian | | Software | 36.16 | 46 | -1.36% | -3.98% |
| IRDM | Iridium | | Communication | 29.69 | 74 | 1.40% | -27.87% |
| NOVT | Novanta | | Instruments | 156.13 | 36 | -1.06% | -7.29% |
| IONQ | IonQ | | Computer Hardware | 8.18 | 42 | -0.85% | -34.38% |
| VIAV | Viavi | | Communication | 7.97 | 10 | -0.25% | -20.85% |
| MQ | Marqeta | | Software - Infrastructure | 5.36 | 7 | -2.46% | -23.81% |
| For chart view version of above stock list: Chart View ➞ 0 - 25 , 25 - 50 , 50 - 75 , 75 - 100 , 100 - 125 , 125 - 150 , 150 - 175 , 175 - 200 , 200 - 225 , 225 - 250 | ||
 | Click To Change The Sort Order: By Market Cap or Company Size Performance: Year-to-date, Week and Day |  |
|
Get the most comprehensive stock market coverage daily at 12Stocks.com ➞ Best Stocks Today ➞ Best Stocks Weekly ➞ Best Stocks Year-to-Date ➞ Best Stocks Trends ➞  Best Stocks Today 12Stocks.com Best Nasdaq Stocks ➞ Best S&P 500 Stocks ➞ Best Tech Stocks ➞ Best Biotech Stocks ➞ |
| Detailed Overview of Tech Stocks |
| Tech Technical Overview, Leaders & Laggards, Top Tech ETF Funds & Detailed Tech Stocks List, Charts, Trends & More |
| Tech Sector: Technical Analysis, Trends & YTD Performance | |
| Technology sector is composed of stocks
from semiconductors, software, web, social media
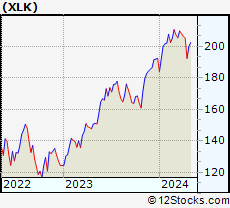
and services subsectors. Technology sector, as represented by XLK, an exchange-traded fund [ETF] that holds basket of tech stocks (e.g, Intel, Google) is up by 2.66% and is currently underperforming the overall market by -2.5% year-to-date. Below is a quick view of technical charts and trends: |
|
 XLK Weekly Chart |
|
| Long Term Trend: Not Good | |
| Medium Term Trend: Not Good | |
 XLK Daily Chart |
|
| Short Term Trend: Very Good | |
| Overall Trend Score: 38 | |
| YTD Performance: 2.66% | |
| **Trend Scores & Views Are Only For Educational Purposes And Not For Investing | |
Got error 28 from storage engine