
 Login Sign Up


| |||||
 |  | ||||

| 12Stocks.com Market Intelligence |
Best Tech Stocks
| In a hurry? Tech Stocks Lists: Performance & Trends, Stock Charts, FANG Stocks
Sort Tech stocks: Daily, Weekly, Year-to-Date, Market Cap & Trends. Filter Tech stocks list by size:All Tech Large Mid-Range Small and MicroCap |
| 12Stocks.com Tech Stocks Performances & Trends Daily | |||||||||
|
|  The overall Smart Investing & Trading Score is 13 (0-bearish to 100-bullish) which puts Technology sector in short term bearish trend. The Smart Investing & Trading Score from previous trading session is 26 and a deterioration of trend continues.
| ||||||||
Here are the Smart Investing & Trading Scores of the most requested Technology stocks at 12Stocks.com (click stock name for detailed review):
|


| 12Stocks.com: Investing in Technology sector with Stocks | |
|
The following table helps investors and traders sort through current performance and trends (as measured by Smart Investing & Trading Score) of various
stocks in the Tech sector. Quick View: Move mouse or cursor over stock symbol (ticker) to view short-term technical chart and over stock name to view long term chart. Click on  to add stock symbol to your watchlist and to add stock symbol to your watchlist and  to view watchlist. Click on any ticker or stock name for detailed market intelligence report for that stock. to view watchlist. Click on any ticker or stock name for detailed market intelligence report for that stock. |
12Stocks.com Performance of Stocks in Tech Sector
| Ticker | Stock Name | Watchlist | Category | Recent Price | Smart Investing & Trading Score | Change % | YTD Change% |
| LOGI | Logitech |   | Computer | 78.08 | 0 | -1.16% | -17.86% |
| TRMB | Trimble | | Instruments | 57.86 | 31 | -1.08% | 8.76% |
| ATHM | Autohome | | Internet | 24.26 | 10 | -0.04% | -13.54% |
| FICO | Fair Isaac | | Software | 1162.25 | 32 | 0.78% | -0.15% |
| LYFT | Lyft | | Software | 16.71 | 31 | -3.47% | 11.47% |
| GTLB | GitLab | | Software - | 53.81 | 15 | 0.47% | -15.09% |
| IT | Gartner | | IT | 449.61 | 0 | 0.07% | -0.33% |
| MDB | MongoDB | | Software | 335.55 | 0 | -2.10% | -17.93% |
| DBX | Dropbox | | Software | 22.76 | 10 | -0.18% | -22.80% |
| ZS | Zscaler | | Security Software | 172.97 | 10 | 0.01% | -21.93% |
| CGNX | Cognex | | Instruments | 38.69 | 36 | -1.33% | -7.31% |
| STNE | StoneCo | | Software | 15.26 | 0 | 0.07% | -15.36% |
| IRM | Iron Mountain | | Software | 74.42 | 51 | -0.97% | 6.34% |
| LBTYK | Liberty Global | | CATV | 17.18 | 20 | 2.32% | -7.83% |
| GWRE | Guidewire Software | | Software | 107.90 | 0 | -0.41% | -1.05% |
| NET | Cloudflare | | Software | 86.71 | 26 | -1.47% | 4.14% |
| BILI | Bilibili | | Internet | 11.07 | 36 | 0.36% | -9.04% |
| DT | Dynatrace | | Software | 46.26 | 50 | 4.12% | -15.41% |
| CCCS | CCC Intelligent | | Software - Infrastructure | 11.48 | 43 | 0.44% | 1.19% |
| YMM | Full Truck | | Software - | 7.62 | 63 | 0.79% | 8.93% |
| DOX | Amdocs | | Software | 85.11 | 18 | 0.21% | -3.16% |
| FFIV | F5 Networks | | Software | 179.59 | 0 | -0.94% | 0.34% |
| ZG | Zillow | | Internet | 41.11 | 10 | -1.84% | -27.52% |
| DV | DoubleVerify | | Software - | 30.14 | 7 | 0.37% | -18.05% |
| MPWR | Monolithic Power | | Semiconductor | 620.31 | 26 | -2.73% | -1.66% |
| For chart view version of above stock list: Chart View ➞ 0 - 25 , 25 - 50 , 50 - 75 , 75 - 100 , 100 - 125 , 125 - 150 , 150 - 175 , 175 - 200 , 200 - 225 , 225 - 250 | ||
 | Click To Change The Sort Order: By Market Cap or Company Size Performance: Year-to-date, Week and Day |  |
|
Get the most comprehensive stock market coverage daily at 12Stocks.com ➞ Best Stocks Today ➞ Best Stocks Weekly ➞ Best Stocks Year-to-Date ➞ Best Stocks Trends ➞  Best Stocks Today 12Stocks.com Best Nasdaq Stocks ➞ Best S&P 500 Stocks ➞ Best Tech Stocks ➞ Best Biotech Stocks ➞ |
| Detailed Overview of Tech Stocks |
| Tech Technical Overview, Leaders & Laggards, Top Tech ETF Funds & Detailed Tech Stocks List, Charts, Trends & More |
| Tech Sector: Technical Analysis, Trends & YTD Performance | |
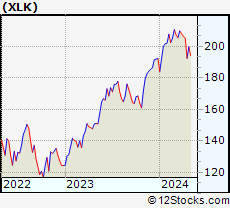
| Technology sector is composed of stocks
from semiconductors, software, web, social media
and services subsectors. Technology sector, as represented by XLK, an exchange-traded fund [ETF] that holds basket of tech stocks (e.g, Intel, Google) is up by 2.13% and is currently underperforming the overall market by -2.06% year-to-date. Below is a quick view of technical charts and trends: |
|
 XLK Weekly Chart |
|
| Long Term Trend: Not Good | |
| Medium Term Trend: Not Good | |
 XLK Daily Chart |
|
| Short Term Trend: Not Good | |
| Overall Trend Score: 13 | |
| YTD Performance: 2.13% | |
| **Trend Scores & Views Are Only For Educational Purposes And Not For Investing | |
| 12Stocks.com: Top Performing Technology Sector Stocks | ||||||||||||||||||||||||||||||||||||||||||||||||
 The top performing Technology sector stocks year to date are
Now, more recently, over last week, the top performing Technology sector stocks on the move are


|
||||||||||||||||||||||||||||||||||||||||||||||||
| 12Stocks.com: Investing in Tech Sector using Exchange Traded Funds | |
|
The following table shows list of key exchange traded funds (ETF) that
help investors track Tech Index. For detailed view, check out our ETF Funds section of our website. Quick View: Move mouse or cursor over ETF symbol (ticker) to view short-term technical chart and over ETF name to view long term chart. Click on ticker or stock name for detailed view. Click on to add stock symbol to your watchlist and to view watchlist. |
12Stocks.com List of ETFs that track Tech Index
| Ticker | ETF Name | Watchlist | Recent Price | Smart Investing & Trading Score | Change % | Week % | Year-to-date % |
| XLK | Technology | | 196.58 | 13 | -1.14 | -4.3 | 2.13% |
| QQQ | QQQ | | 423.41 | 26 | -0.57 | -3.39 | 3.39% |
| IYW | Technology | | 128.41 | 26 | -0.72 | -4.14 | 4.61% |
| VGT | Information Technology | | 492.97 | 13 | -0.95 | -4.22 | 1.85% |
| IXN | Global Tech | | 70.59 | 36 | -1.01 | -4.35 | 3.53% |
| IGV | Tech-Software | | 79.50 | 10 | -0.70 | -3.94 | -2.01% |
| XSD | Semiconductor | | 210.17 | 36 | -1.99 | -5.82 | -6.5% |
| TQQQ | QQQ | | 52.75 | 13 | -1.79 | -10.17 | 4.04% |
| SQQQ | Short QQQ | | 12.07 | 69 | 1.77 | 10.84 | -10.26% |
| SOXL | Semicondct Bull 3X | | 34.91 | 26 | -5.80 | -15.9 | 11.18% |
| SOXS | Semicondct Bear 3X | | 41.27 | 90 | 5.42 | 1072.44 | 609.11% |
| SOXX | PHLX Semiconductor | | 206.63 | 26 | -1.77 | -5.25 | 7.6% |
| QTEC | First -100-Tech | | 177.88 | 13 | -1.03 | -4.38 | 1.37% |
| SMH | Semiconductor | | 208.63 | 26 | -1.77 | -5.46 | 19.31% |
| 12Stocks.com: Charts, Trends, Fundamental Data and Performances of Tech Stocks | |
|
We now take in-depth look at all Tech stocks including charts, multi-period performances and overall trends (as measured by Smart Investing & Trading Score). One can sort Tech stocks (click link to choose) by Daily, Weekly and by Year-to-Date performances. Also, one can sort by size of the company or by market capitalization. |
| Select Your Default Chart Type: | |||||
| |||||
| Click on stock symbol or name for detailed view. Click on to add stock symbol to your watchlist and to view watchlist. Quick View: Move mouse or cursor over "Daily" to quickly view daily technical stock chart and over "Weekly" to view weekly technical stock chart. | |||||


 | LOGI Logitech International S.A. |
| Sector: Technology | |
| SubSector: Computer Peripherals | |
| MarketCap: 7998.19 Millions | |
| Recent Price: 78.08 Smart Investing & Trading Score: 0 | |
| Day Percent Change: -1.16% Day Change: -0.92 | |
| Week Change: -10.09% Year-to-date Change: -17.9% | |
| LOGI Links: Profile News Message Board | |
| Charts:- Daily , Weekly | |
| Add LOGI to Watchlist: View: Get Complete LOGI Trend Analysis ➞ | |
 | TRMB Trimble Inc. |
| Sector: Technology | |
| SubSector: Scientific & Technical Instruments | |
| MarketCap: 7990.33 Millions | |
| Recent Price: 57.86 Smart Investing & Trading Score: 31 | |
| Day Percent Change: -1.08% Day Change: -0.63 | |
| Week Change: -4.43% Year-to-date Change: 8.8% | |
| TRMB Links: Profile News Message Board | |
| Charts:- Daily , Weekly | |
| Add TRMB to Watchlist: View: Get Complete TRMB Trend Analysis ➞ | |
 | ATHM Autohome Inc. |
| Sector: Technology | |
| SubSector: Internet Information Providers | |
| MarketCap: 7984.2 Millions | |
| Recent Price: 24.26 Smart Investing & Trading Score: 10 | |
| Day Percent Change: -0.04% Day Change: -0.01 | |
| Week Change: -3.88% Year-to-date Change: -13.5% | |
| ATHM Links: Profile News Message Board | |
| Charts:- Daily , Weekly | |
| Add ATHM to Watchlist: View: Get Complete ATHM Trend Analysis ➞ | |
 | FICO Fair Isaac Corporation |
| Sector: Technology | |
| SubSector: Business Software & Services | |
| MarketCap: 7930.98 Millions | |
| Recent Price: 1162.25 Smart Investing & Trading Score: 32 | |
| Day Percent Change: 0.78% Day Change: 8.97 | |
| Week Change: -1.14% Year-to-date Change: -0.2% | |
| FICO Links: Profile News Message Board | |
| Charts:- Daily , Weekly | |
| Add FICO to Watchlist: View: Get Complete FICO Trend Analysis ➞ | |
 | LYFT Lyft, Inc. |
| Sector: Technology | |
| SubSector: Application Software | |
| MarketCap: 7923.22 Millions | |
| Recent Price: 16.71 Smart Investing & Trading Score: 31 | |
| Day Percent Change: -3.47% Day Change: -0.60 | |
| Week Change: -10.93% Year-to-date Change: 11.5% | |
| LYFT Links: Profile News Message Board | |
| Charts:- Daily , Weekly | |
| Add LYFT to Watchlist: View: Get Complete LYFT Trend Analysis ➞ | |
 | GTLB GitLab Inc. |
| Sector: Technology | |
| SubSector: Software - Application | |
| MarketCap: 7840 Millions | |
| Recent Price: 53.81 Smart Investing & Trading Score: 15 | |
| Day Percent Change: 0.47% Day Change: 0.25 | |
| Week Change: -5.71% Year-to-date Change: -15.1% | |
| GTLB Links: Profile News Message Board | |
| Charts:- Daily , Weekly | |
| Add GTLB to Watchlist: View: Get Complete GTLB Trend Analysis ➞ | |
 | IT Gartner, Inc. |
| Sector: Technology | |
| SubSector: Information Technology Services | |
| MarketCap: 7767.98 Millions | |
| Recent Price: 449.61 Smart Investing & Trading Score: 0 | |
| Day Percent Change: 0.07% Day Change: 0.30 | |
| Week Change: -3.4% Year-to-date Change: -0.3% | |
| IT Links: Profile News Message Board | |
| Charts:- Daily , Weekly | |
| Add IT to Watchlist: View: Get Complete IT Trend Analysis ➞ | |
 | MDB MongoDB, Inc. |
| Sector: Technology | |
| SubSector: Application Software | |
| MarketCap: 7591.22 Millions | |
| Recent Price: 335.55 Smart Investing & Trading Score: 0 | |
| Day Percent Change: -2.10% Day Change: -7.20 | |
| Week Change: -4.69% Year-to-date Change: -17.9% | |
| MDB Links: Profile News Message Board | |
| Charts:- Daily , Weekly | |
| Add MDB to Watchlist: View: Get Complete MDB Trend Analysis ➞ | |
 | DBX Dropbox, Inc. |
| Sector: Technology | |
| SubSector: Application Software | |
| MarketCap: 7588.32 Millions | |
| Recent Price: 22.76 Smart Investing & Trading Score: 10 | |
| Day Percent Change: -0.18% Day Change: -0.04 | |
| Week Change: -1% Year-to-date Change: -22.8% | |
| DBX Links: Profile News Message Board | |
| Charts:- Daily , Weekly | |
| Add DBX to Watchlist: View: Get Complete DBX Trend Analysis ➞ | |
 | ZS Zscaler, Inc. |
| Sector: Technology | |
| SubSector: Security Software & Services | |
| MarketCap: 7532.17 Millions | |
| Recent Price: 172.97 Smart Investing & Trading Score: 10 | |
| Day Percent Change: 0.01% Day Change: 0.01 | |
| Week Change: -4.65% Year-to-date Change: -21.9% | |
| ZS Links: Profile News Message Board | |
| Charts:- Daily , Weekly | |
| Add ZS to Watchlist: View: Get Complete ZS Trend Analysis ➞ | |
 | CGNX Cognex Corporation |
| Sector: Technology | |
| SubSector: Scientific & Technical Instruments | |
| MarketCap: 7373.13 Millions | |
| Recent Price: 38.69 Smart Investing & Trading Score: 36 | |
| Day Percent Change: -1.33% Day Change: -0.52 | |
| Week Change: -3.88% Year-to-date Change: -7.3% | |
| CGNX Links: Profile News Message Board | |
| Charts:- Daily , Weekly | |
| Add CGNX to Watchlist: View: Get Complete CGNX Trend Analysis ➞ | |
 | STNE StoneCo Ltd. |
| Sector: Technology | |
| SubSector: Application Software | |
| MarketCap: 7347.82 Millions | |
| Recent Price: 15.26 Smart Investing & Trading Score: 0 | |
| Day Percent Change: 0.07% Day Change: 0.01 | |
| Week Change: -5.33% Year-to-date Change: -15.4% | |
| STNE Links: Profile News Message Board | |
| Charts:- Daily , Weekly | |
| Add STNE to Watchlist: View: Get Complete STNE Trend Analysis ➞ | |
 | IRM Iron Mountain Incorporated |
| Sector: Technology | |
| SubSector: Business Software & Services | |
| MarketCap: 7339.18 Millions | |
| Recent Price: 74.42 Smart Investing & Trading Score: 51 | |
| Day Percent Change: -0.97% Day Change: -0.73 | |
| Week Change: -2.1% Year-to-date Change: 6.3% | |
| IRM Links: Profile News Message Board | |
| Charts:- Daily , Weekly | |
| Add IRM to Watchlist: View: Get Complete IRM Trend Analysis ➞ | |
 | LBTYK Liberty Global plc |
| Sector: Technology | |
| SubSector: CATV Systems | |
| MarketCap: 7253.02 Millions | |
| Recent Price: 17.18 Smart Investing & Trading Score: 20 | |
| Day Percent Change: 2.32% Day Change: 0.39 | |
| Week Change: -0.75% Year-to-date Change: -7.8% | |
| LBTYK Links: Profile News Message Board | |
| Charts:- Daily , Weekly | |
| Add LBTYK to Watchlist: View: Get Complete LBTYK Trend Analysis ➞ | |
 | GWRE Guidewire Software, Inc. |
| Sector: Technology | |
| SubSector: Business Software & Services | |
| MarketCap: 7073.18 Millions | |
| Recent Price: 107.90 Smart Investing & Trading Score: 0 | |
| Day Percent Change: -0.41% Day Change: -0.44 | |
| Week Change: -3.01% Year-to-date Change: -1.1% | |
| GWRE Links: Profile News Message Board | |
| Charts:- Daily , Weekly | |
| Add GWRE to Watchlist: View: Get Complete GWRE Trend Analysis ➞ | |
 | NET Cloudflare, Inc. |
| Sector: Technology | |
| SubSector: Application Software | |
| MarketCap: 7063.72 Millions | |
| Recent Price: 86.71 Smart Investing & Trading Score: 26 | |
| Day Percent Change: -1.47% Day Change: -1.29 | |
| Week Change: -7.52% Year-to-date Change: 4.1% | |
| NET Links: Profile News Message Board | |
| Charts:- Daily , Weekly | |
| Add NET to Watchlist: View: Get Complete NET Trend Analysis ➞ | |
 | BILI Bilibili Inc. |
| Sector: Technology | |
| SubSector: Internet Information Providers | |
| MarketCap: 7043.1 Millions | |
| Recent Price: 11.07 Smart Investing & Trading Score: 36 | |
| Day Percent Change: 0.36% Day Change: 0.04 | |
| Week Change: -3.57% Year-to-date Change: -9.0% | |
| BILI Links: Profile News Message Board | |
| Charts:- Daily , Weekly | |
| Add BILI to Watchlist: View: Get Complete BILI Trend Analysis ➞ | |
 | DT Dynatrace, Inc. |
| Sector: Technology | |
| SubSector: Application Software | |
| MarketCap: 7007.12 Millions | |
| Recent Price: 46.26 Smart Investing & Trading Score: 50 | |
| Day Percent Change: 4.12% Day Change: 1.83 | |
| Week Change: 0.89% Year-to-date Change: -15.4% | |
| DT Links: Profile News Message Board | |
| Charts:- Daily , Weekly | |
| Add DT to Watchlist: View: Get Complete DT Trend Analysis ➞ | |
 | CCCS CCC Intelligent Solutions Holdings Inc. |
| Sector: Technology | |
| SubSector: Software - Infrastructure | |
| MarketCap: 6990 Millions | |
| Recent Price: 11.48 Smart Investing & Trading Score: 43 | |
| Day Percent Change: 0.44% Day Change: 0.05 | |
| Week Change: -1.96% Year-to-date Change: 1.2% | |
| CCCS Links: Profile News Message Board | |
| Charts:- Daily , Weekly | |
| Add CCCS to Watchlist: View: Get Complete CCCS Trend Analysis ➞ | |
 | YMM Full Truck Alliance Co. Ltd. |
| Sector: Technology | |
| SubSector: Software - Application | |
| MarketCap: 6960 Millions | |
| Recent Price: 7.62 Smart Investing & Trading Score: 63 | |
| Day Percent Change: 0.79% Day Change: 0.06 | |
| Week Change: -1.17% Year-to-date Change: 8.9% | |
| YMM Links: Profile News Message Board | |
| Charts:- Daily , Weekly | |
| Add YMM to Watchlist: View: Get Complete YMM Trend Analysis ➞ | |
 | DOX Amdocs Limited |
| Sector: Technology | |
| SubSector: Business Software & Services | |
| MarketCap: 6895.48 Millions | |
| Recent Price: 85.11 Smart Investing & Trading Score: 18 | |
| Day Percent Change: 0.21% Day Change: 0.18 | |
| Week Change: -0.7% Year-to-date Change: -3.2% | |
| DOX Links: Profile News Message Board | |
| Charts:- Daily , Weekly | |
| Add DOX to Watchlist: View: Get Complete DOX Trend Analysis ➞ | |
 | FFIV F5 Networks, Inc. |
| Sector: Technology | |
| SubSector: Business Software & Services | |
| MarketCap: 6675.38 Millions | |
| Recent Price: 179.59 Smart Investing & Trading Score: 0 | |
| Day Percent Change: -0.94% Day Change: -1.71 | |
| Week Change: -6.51% Year-to-date Change: 0.3% | |
| FFIV Links: Profile News Message Board | |
| Charts:- Daily , Weekly | |
| Add FFIV to Watchlist: View: Get Complete FFIV Trend Analysis ➞ | |
 | ZG Zillow Group, Inc. |
| Sector: Technology | |
| SubSector: Internet Information Providers | |
| MarketCap: 6536.7 Millions | |
| Recent Price: 41.11 Smart Investing & Trading Score: 10 | |
| Day Percent Change: -1.84% Day Change: -0.77 | |
| Week Change: -5.95% Year-to-date Change: -27.5% | |
| ZG Links: Profile News Message Board | |
| Charts:- Daily , Weekly | |
| Add ZG to Watchlist: View: Get Complete ZG Trend Analysis ➞ | |
 | DV DoubleVerify Holdings, Inc. |
| Sector: Technology | |
| SubSector: Software - Application | |
| MarketCap: 6500 Millions | |
| Recent Price: 30.14 Smart Investing & Trading Score: 7 | |
| Day Percent Change: 0.37% Day Change: 0.11 | |
| Week Change: -6.86% Year-to-date Change: -18.1% | |
| DV Links: Profile News Message Board | |
| Charts:- Daily , Weekly | |
| Add DV to Watchlist: View: Get Complete DV Trend Analysis ➞ | |
 | MPWR Monolithic Power Systems, Inc. |
| Sector: Technology | |
| SubSector: Semiconductor - Specialized | |
| MarketCap: 6436.4 Millions | |
| Recent Price: 620.31 Smart Investing & Trading Score: 26 | |
| Day Percent Change: -2.73% Day Change: -17.41 | |
| Week Change: -5.76% Year-to-date Change: -1.7% | |
| MPWR Links: Profile News Message Board | |
| Charts:- Daily , Weekly | |
| Add MPWR to Watchlist: View: Get Complete MPWR Trend Analysis ➞ | |
| For tabular summary view of above stock list: Summary View ➞ 0 - 25 , 25 - 50 , 50 - 75 , 75 - 100 , 100 - 125 , 125 - 150 , 150 - 175 , 175 - 200 , 200 - 225 , 225 - 250 | ||
| Click To Change The Sort Order: By Market Cap or Company Size Performance: Year-to-date, Week and Day | |
| Select Chart Type: | ||
|
Best Stocks Today 12Stocks.com |
© 2024 12Stocks.com Terms & Conditions Privacy Contact Us
All Information Provided Only For Education And Not To Be Used For Investing or Trading. See Terms & Conditions


One More Thing ... Get Best Stocks Delivered Daily!
Never Ever Miss A Move With Our Top Ten Stocks Lists
Find Best Stocks In Any Market - Bull or Bear Market
Take A Peek At Our Top Ten Stocks Lists: Daily, Weekly, Year-to-Date & Top Trends
Find Best Stocks In Any Market - Bull or Bear Market
Take A Peek At Our Top Ten Stocks Lists: Daily, Weekly, Year-to-Date & Top Trends
Technology Stocks With Best Up Trends [0-bearish to 100-bullish]: Badger Meter[100], GigaCloud [100], NextNav [100], EchoStar [100], Inspire Medical[93], Zuora [93], Smith Micro[90], GDS [88], JOYY [88], Payoneer Global[86], Global Business[86]
Best Technology Stocks Year-to-Date:
MediaCo Holding[522.07%], Super Micro[226.63%], Smith Micro[169.37%], CXApp [144.79%], Uxin [136.8%], GigaCloud [100.82%], D-Wave Quantum[100.02%], MicroStrategy [91.28%], SoundHound AI[87.62%], CuriosityStream [87%], NextNav [82.47%] Best Technology Stocks This Week:
Snap One[29.73%], Expensify [18.37%], Badger Meter[16.72%], Mynaric AG[11.76%], SYLA [10.53%], Encore Wire[9.97%], NextNav [9.58%], GigaCloud [8.8%], Bentley Systems[8.14%], Zuora [7.79%], Luna Innovations[7.69%] Best Technology Stocks Daily:
VIA optronics[22.14%], Badger Meter[16.65%], Expensify [15.23%], Smith Micro[14.10%], Quantum [12.20%], Cheetah Mobile[9.06%], SYLA [8.89%], Sequans [8.82%], FiscalNote [8.61%], Quhuo [8.36%], Markforged Holding[8.26%]