
 Login Sign Up


| |||||
 |  | ||||

| 12Stocks.com Market Intelligence |
Best Tech Stocks
| In a hurry? Tech Stocks Lists: Performance & Trends, Stock Charts, FANG Stocks
Sort Tech stocks: Daily, Weekly, Year-to-Date, Market Cap & Trends. Filter Tech stocks list by size:All Tech Large Mid-Range Small and MicroCap |
| 12Stocks.com Tech Stocks Performances & Trends Daily | |||||||||
|
|  The overall Smart Investing & Trading Score is 38 (0-bearish to 100-bullish) which puts Technology sector in short term bearish to neutral trend. The Smart Investing & Trading Score from previous trading session is 45 and hence a deterioration of trend.
| ||||||||
Here are the Smart Investing & Trading Scores of the most requested Technology stocks at 12Stocks.com (click stock name for detailed review):
|


| 12Stocks.com: Investing in Technology sector with Stocks | |
|
The following table helps investors and traders sort through current performance and trends (as measured by Smart Investing & Trading Score) of various
stocks in the Tech sector. Quick View: Move mouse or cursor over stock symbol (ticker) to view short-term technical chart and over stock name to view long term chart. Click on  to add stock symbol to your watchlist and to add stock symbol to your watchlist and  to view watchlist. Click on any ticker or stock name for detailed market intelligence report for that stock. to view watchlist. Click on any ticker or stock name for detailed market intelligence report for that stock. |
12Stocks.com Performance of Stocks in Tech Sector
| Ticker | Stock Name | Watchlist | Category | Recent Price | Smart Investing & Trading Score | Change % | YTD Change% |
| EBON | Ebang |   | Computer Hardware | 7.68 | 10 | -2.66% | -49.72% |
| BIDU | Baidu | | Internet | 99.90 | 59 | 0.72% | -16.11% |
| ADI | Analog Devices | | Semiconductor | 197.94 | 100 | 0.73% | -0.31% |
| PHG | Koninklijke Philips | | Electronic | 20.72 | 75 | -1.19% | -11.19% |
| TEAM | Atlassian | | IT | 198.41 | 50 | -0.30% | -16.59% |
| CRSR | Corsair Gaming | | Computer Hardware | 11.13 | 25 | 1.74% | -21.12% |
| LRCX | Lam Research | | Semiconductor | 901.47 | 58 | 1.87% | 15.09% |
| WDAY | Workday | | Software | 254.06 | 35 | -0.66% | -7.97% |
| YALA | Yalla | | Software | 4.64 | 35 | -1.49% | -24.31% |
| CHT | Chunghwa Telecom | | Telecom | 37.87 | 51 | -0.97% | -3.07% |
| EA | Electronic Arts | | Software | 127.31 | 28 | -0.65% | -6.94% |
| ERIC | Telefonaktiebolaget LM | | Communication | 5.24 | 37 | -0.76% | -16.83% |
| DELL | Dell | | Personal Computers | 124.91 | 53 | 3.92% | 63.28% |
| SBAC | SBA | | Communication | 197.93 | 28 | -0.54% | -21.98% |
| TEF | Telefonica S.A | | Telecom | 4.42 | 100 | 0.45% | 13.33% |
| MSI | Motorola | | Communication | 349.02 | 68 | 1.13% | 11.48% |
| CTSH | Cognizant | | IT | 66.76 | 10 | -1.13% | -11.61% |
| SPT | Sprout Social | | Software | 51.33 | 10 | -2.19% | -16.46% |
| APH | Amphenol | | Electronics | 119.01 | 93 | 2.32% | 20.05% |
| MAX | MediaAlpha | | Internet Content & Information | 18.67 | 71 | -2.10% | 67.90% |
| NXPI | NXP Semiconductors | | Semiconductor | 238.08 | 75 | 1.29% | 3.66% |
| RCI | Rogers | | Wireless | 38.04 | 17 | -0.31% | -18.74% |
| HPQ | HP | | Computer | 28.13 | 32 | 0.11% | -6.51% |
| VEEV | Veeva Systems | | Healthcare Information | 199.09 | 25 | -0.71% | 3.41% |
| MSCI | MSCI | | Processing | 464.49 | 17 | -0.03% | -17.88% |
| For chart view version of above stock list: Chart View ➞ 0 - 25 , 25 - 50 , 50 - 75 , 75 - 100 , 100 - 125 , 125 - 150 , 150 - 175 , 175 - 200 , 200 - 225 , 225 - 250 , 250 - 275 , 275 - 300 , 300 - 325 , 325 - 350 , 350 - 375 , 375 - 400 , 400 - 425 , 425 - 450 , 450 - 475 , 475 - 500 , 500 - 525 , 525 - 550 , 550 - 575 , 575 - 600 , 600 - 625 , 625 - 650 | ||
 | Click To Change The Sort Order: By Market Cap or Company Size Performance: Year-to-date, Week and Day |  |
|
Get the most comprehensive stock market coverage daily at 12Stocks.com ➞ Best Stocks Today ➞ Best Stocks Weekly ➞ Best Stocks Year-to-Date ➞ Best Stocks Trends ➞  Best Stocks Today 12Stocks.com Best Nasdaq Stocks ➞ Best S&P 500 Stocks ➞ Best Tech Stocks ➞ Best Biotech Stocks ➞ |
| Detailed Overview of Tech Stocks |
| Tech Technical Overview, Leaders & Laggards, Top Tech ETF Funds & Detailed Tech Stocks List, Charts, Trends & More |
| Tech Sector: Technical Analysis, Trends & YTD Performance | |
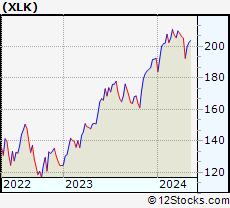
| Technology sector is composed of stocks
from semiconductors, software, web, social media
and services subsectors. Technology sector, as represented by XLK, an exchange-traded fund [ETF] that holds basket of tech stocks (e.g, Intel, Google) is up by 2.66% and is currently underperforming the overall market by -2.5% year-to-date. Below is a quick view of technical charts and trends: |
|
 XLK Weekly Chart |
|
| Long Term Trend: Not Good | |
| Medium Term Trend: Not Good | |
 XLK Daily Chart |
|
| Short Term Trend: Very Good | |
| Overall Trend Score: 38 | |
| YTD Performance: 2.66% | |
| **Trend Scores & Views Are Only For Educational Purposes And Not For Investing | |
| 12Stocks.com: Top Performing Technology Sector Stocks | ||||||||||||||||||||||||||||||||||||||||||||||||
 The top performing Technology sector stocks year to date are
Now, more recently, over last week, the top performing Technology sector stocks on the move are


|
||||||||||||||||||||||||||||||||||||||||||||||||
| 12Stocks.com: Investing in Tech Sector using Exchange Traded Funds | |
|
The following table shows list of key exchange traded funds (ETF) that
help investors track Tech Index. For detailed view, check out our ETF Funds section of our website. Quick View: Move mouse or cursor over ETF symbol (ticker) to view short-term technical chart and over ETF name to view long term chart. Click on ticker or stock name for detailed view. Click on to add stock symbol to your watchlist and to view watchlist. |
12Stocks.com List of ETFs that track Tech Index
| Ticker | ETF Name | Watchlist | Recent Price | Smart Investing & Trading Score | Change % | Week % | Year-to-date % |
| XLK | Technology | | 197.60 | 38 | -0.22 | 2.63 | 2.66% |
| QQQ | QQQ | | 424.45 | 51 | -0.48 | 2.36 | 3.65% |
| IYW | Technology | | 128.20 | 51 | -0.50 | 2.77 | 4.44% |
| VGT | Information Technology | | 495.44 | 38 | 0.04 | 3.24 | 2.36% |
| IXN | Global Tech | | 70.75 | 36 | -0.13 | 2.95 | 3.77% |
| IGV | Tech-Software | | 80.19 | 25 | -0.93 | 2.11 | -1.16% |
| XSD | Semiconductor | | 220.63 | 30 | 2.36 | 8.39 | -1.85% |
| TQQQ | QQQ | | 52.85 | 38 | -1.60 | 6.81 | 4.24% |
| SQQQ | Short QQQ | | 12.00 | 44 | 1.61 | -6.54 | -10.78% |
| SOXL | Semicondct Bull 3X | | 37.41 | 58 | 5.41 | 21.5 | 19.14% |
| SOXS | Semicondct Bear 3X | | 37.44 | 51 | -5.48 | -18.84 | 543.3% |
| SOXX | PHLX Semiconductor | | 212.41 | 51 | 1.86 | 7.07 | 10.61% |
| QTEC | First -100-Tech | | 181.18 | 51 | 0.02 | 4.16 | 3.25% |
| SMH | Semiconductor | | 212.20 | 63 | 2.00 | 6.52 | 21.35% |
| 12Stocks.com: Charts, Trends, Fundamental Data and Performances of Tech Stocks | |
|
We now take in-depth look at all Tech stocks including charts, multi-period performances and overall trends (as measured by Smart Investing & Trading Score). One can sort Tech stocks (click link to choose) by Daily, Weekly and by Year-to-Date performances. Also, one can sort by size of the company or by market capitalization. |
| Select Your Default Chart Type: | |||||
| |||||
| Click on stock symbol or name for detailed view. Click on to add stock symbol to your watchlist and to view watchlist. Quick View: Move mouse or cursor over "Daily" to quickly view daily technical stock chart and over "Weekly" to view weekly technical stock chart. | |||||


 | EBON Ebang International Holdings Inc. |
| Sector: Technology | |
| SubSector: Computer Hardware | |
| MarketCap: 33787 Millions | |
| Recent Price: 7.68 Smart Investing & Trading Score: 10 | |
| Day Percent Change: -2.66% Day Change: -0.21 | |
| Week Change: -6.8% Year-to-date Change: -49.7% | |
| EBON Links: Profile News Message Board | |
| Charts:- Daily , Weekly | |
| Add EBON to Watchlist: View: Get Complete EBON Trend Analysis ➞ | |
 | BIDU Baidu, Inc. |
| Sector: Technology | |
| SubSector: Internet Information Providers | |
| MarketCap: 33525.9 Millions | |
| Recent Price: 99.90 Smart Investing & Trading Score: 59 | |
| Day Percent Change: 0.72% Day Change: 0.71 | |
| Week Change: 5.1% Year-to-date Change: -16.1% | |
| BIDU Links: Profile News Message Board | |
| Charts:- Daily , Weekly | |
| Add BIDU to Watchlist: View: Get Complete BIDU Trend Analysis ➞ | |
 | ADI Analog Devices, Inc. |
| Sector: Technology | |
| SubSector: Semiconductor - Integrated Circuits | |
| MarketCap: 32859 Millions | |
| Recent Price: 197.94 Smart Investing & Trading Score: 100 | |
| Day Percent Change: 0.73% Day Change: 1.44 | |
| Week Change: 7.95% Year-to-date Change: -0.3% | |
| ADI Links: Profile News Message Board | |
| Charts:- Daily , Weekly | |
| Add ADI to Watchlist: View: Get Complete ADI Trend Analysis ➞ | |
 | PHG Koninklijke Philips N.V. |
| Sector: Technology | |
| SubSector: Electronic Equipment | |
| MarketCap: 32405.2 Millions | |
| Recent Price: 20.72 Smart Investing & Trading Score: 75 | |
| Day Percent Change: -1.19% Day Change: -0.25 | |
| Week Change: 3.7% Year-to-date Change: -11.2% | |
| PHG Links: Profile News Message Board | |
| Charts:- Daily , Weekly | |
| Add PHG to Watchlist: View: Get Complete PHG Trend Analysis ➞ | |
 | TEAM Atlassian Corporation Plc |
| Sector: Technology | |
| SubSector: Information Technology Services | |
| MarketCap: 32265.7 Millions | |
| Recent Price: 198.41 Smart Investing & Trading Score: 50 | |
| Day Percent Change: -0.30% Day Change: -0.60 | |
| Week Change: 3.58% Year-to-date Change: -16.6% | |
| TEAM Links: Profile News Message Board | |
| Charts:- Daily , Weekly | |
| Add TEAM to Watchlist: View: Get Complete TEAM Trend Analysis ➞ | |
 | CRSR Corsair Gaming, Inc. |
| Sector: Technology | |
| SubSector: Computer Hardware | |
| MarketCap: 32187 Millions | |
| Recent Price: 11.13 Smart Investing & Trading Score: 25 | |
| Day Percent Change: 1.74% Day Change: 0.19 | |
| Week Change: 3.15% Year-to-date Change: -21.1% | |
| CRSR Links: Profile News Message Board | |
| Charts:- Daily , Weekly | |
| Add CRSR to Watchlist: View: Get Complete CRSR Trend Analysis ➞ | |
 | LRCX Lam Research Corporation |
| Sector: Technology | |
| SubSector: Semiconductor Equipment & Materials | |
| MarketCap: 31806 Millions | |
| Recent Price: 901.47 Smart Investing & Trading Score: 58 | |
| Day Percent Change: 1.87% Day Change: 16.58 | |
| Week Change: 3.59% Year-to-date Change: 15.1% | |
| LRCX Links: Profile News Message Board | |
| Charts:- Daily , Weekly | |
| Add LRCX to Watchlist: View: Get Complete LRCX Trend Analysis ➞ | |
 | WDAY Workday, Inc. |
| Sector: Technology | |
| SubSector: Application Software | |
| MarketCap: 31372.1 Millions | |
| Recent Price: 254.06 Smart Investing & Trading Score: 35 | |
| Day Percent Change: -0.66% Day Change: -1.68 | |
| Week Change: 0.73% Year-to-date Change: -8.0% | |
| WDAY Links: Profile News Message Board | |
| Charts:- Daily , Weekly | |
| Add WDAY to Watchlist: View: Get Complete WDAY Trend Analysis ➞ | |
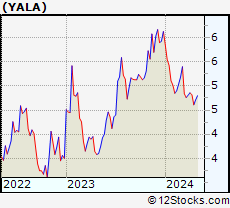 | YALA Yalla Group Limited |
| Sector: Technology | |
| SubSector: Software Application | |
| MarketCap: 28987 Millions | |
| Recent Price: 4.64 Smart Investing & Trading Score: 35 | |
| Day Percent Change: -1.49% Day Change: -0.07 | |
| Week Change: 0.65% Year-to-date Change: -24.3% | |
| YALA Links: Profile News Message Board | |
| Charts:- Daily , Weekly | |
| Add YALA to Watchlist: View: Get Complete YALA Trend Analysis ➞ | |
 | CHT Chunghwa Telecom Co., Ltd. |
| Sector: Technology | |
| SubSector: Telecom Services - Domestic | |
| MarketCap: 28101.3 Millions | |
| Recent Price: 37.87 Smart Investing & Trading Score: 51 | |
| Day Percent Change: -0.97% Day Change: -0.37 | |
| Week Change: 0.05% Year-to-date Change: -3.1% | |
| CHT Links: Profile News Message Board | |
| Charts:- Daily , Weekly | |
| Add CHT to Watchlist: View: Get Complete CHT Trend Analysis ➞ | |
 | EA Electronic Arts Inc. |
| Sector: Technology | |
| SubSector: Multimedia & Graphics Software | |
| MarketCap: 27296.5 Millions | |
| Recent Price: 127.31 Smart Investing & Trading Score: 28 | |
| Day Percent Change: -0.65% Day Change: -0.83 | |
| Week Change: 0.03% Year-to-date Change: -6.9% | |
| EA Links: Profile News Message Board | |
| Charts:- Daily , Weekly | |
| Add EA to Watchlist: View: Get Complete EA Trend Analysis ➞ | |
 | ERIC Telefonaktiebolaget LM Ericsson (publ) |
| Sector: Technology | |
| SubSector: Communication Equipment | |
| MarketCap: 27041.1 Millions | |
| Recent Price: 5.24 Smart Investing & Trading Score: 37 | |
| Day Percent Change: -0.76% Day Change: -0.04 | |
| Week Change: 2.75% Year-to-date Change: -16.8% | |
| ERIC Links: Profile News Message Board | |
| Charts:- Daily , Weekly | |
| Add ERIC to Watchlist: View: Get Complete ERIC Trend Analysis ➞ | |
 | DELL Dell Technologies Inc. |
| Sector: Technology | |
| SubSector: Personal Computers | |
| MarketCap: 26750.6 Millions | |
| Recent Price: 124.91 Smart Investing & Trading Score: 53 | |
| Day Percent Change: 3.92% Day Change: 4.71 | |
| Week Change: 8.74% Year-to-date Change: 63.3% | |
| DELL Links: Profile News Message Board | |
| Charts:- Daily , Weekly | |
| Add DELL to Watchlist: View: Get Complete DELL Trend Analysis ➞ | |
 | SBAC SBA Communications Corporation |
| Sector: Technology | |
| SubSector: Diversified Communication Services | |
| MarketCap: 26712.3 Millions | |
| Recent Price: 197.93 Smart Investing & Trading Score: 28 | |
| Day Percent Change: -0.54% Day Change: -1.07 | |
| Week Change: 0.95% Year-to-date Change: -22.0% | |
| SBAC Links: Profile News Message Board | |
| Charts:- Daily , Weekly | |
| Add SBAC to Watchlist: View: Get Complete SBAC Trend Analysis ➞ | |
 | TEF Telefonica, S.A. |
| Sector: Technology | |
| SubSector: Telecom Services - Foreign | |
| MarketCap: 26698.4 Millions | |
| Recent Price: 4.42 Smart Investing & Trading Score: 100 | |
| Day Percent Change: 0.45% Day Change: 0.02 | |
| Week Change: 3.51% Year-to-date Change: 13.3% | |
| TEF Links: Profile News Message Board | |
| Charts:- Daily , Weekly | |
| Add TEF to Watchlist: View: Get Complete TEF Trend Analysis ➞ | |
 | MSI Motorola Solutions, Inc. |
| Sector: Technology | |
| SubSector: Communication Equipment | |
| MarketCap: 26573.3 Millions | |
| Recent Price: 349.02 Smart Investing & Trading Score: 68 | |
| Day Percent Change: 1.13% Day Change: 3.91 | |
| Week Change: 2.76% Year-to-date Change: 11.5% | |
| MSI Links: Profile News Message Board | |
| Charts:- Daily , Weekly | |
| Add MSI to Watchlist: View: Get Complete MSI Trend Analysis ➞ | |
 | CTSH Cognizant Technology Solutions Corporation |
| Sector: Technology | |
| SubSector: Information Technology Services | |
| MarketCap: 26249.7 Millions | |
| Recent Price: 66.76 Smart Investing & Trading Score: 10 | |
| Day Percent Change: -1.13% Day Change: -0.76 | |
| Week Change: -1.01% Year-to-date Change: -11.6% | |
| CTSH Links: Profile News Message Board | |
| Charts:- Daily , Weekly | |
| Add CTSH to Watchlist: View: Get Complete CTSH Trend Analysis ➞ | |
 | SPT Sprout Social, Inc. |
| Sector: Technology | |
| SubSector: Software Application | |
| MarketCap: 25087 Millions | |
| Recent Price: 51.33 Smart Investing & Trading Score: 10 | |
| Day Percent Change: -2.19% Day Change: -1.15 | |
| Week Change: 0.57% Year-to-date Change: -16.5% | |
| SPT Links: Profile News Message Board | |
| Charts:- Daily , Weekly | |
| Add SPT to Watchlist: View: Get Complete SPT Trend Analysis ➞ | |
 | APH Amphenol Corporation |
| Sector: Technology | |
| SubSector: Diversified Electronics | |
| MarketCap: 23422 Millions | |
| Recent Price: 119.01 Smart Investing & Trading Score: 93 | |
| Day Percent Change: 2.32% Day Change: 2.70 | |
| Week Change: 8.02% Year-to-date Change: 20.1% | |
| APH Links: Profile News Message Board | |
| Charts:- Daily , Weekly | |
| Add APH to Watchlist: View: Get Complete APH Trend Analysis ➞ | |
 | MAX MediaAlpha, Inc. |
| Sector: Technology | |
| SubSector: Internet Content & Information | |
| MarketCap: 22537 Millions | |
| Recent Price: 18.67 Smart Investing & Trading Score: 71 | |
| Day Percent Change: -2.10% Day Change: -0.40 | |
| Week Change: 0.48% Year-to-date Change: 67.9% | |
| MAX Links: Profile News Message Board | |
| Charts:- Daily , Weekly | |
| Add MAX to Watchlist: View: Get Complete MAX Trend Analysis ➞ | |
 | NXPI NXP Semiconductors N.V. |
| Sector: Technology | |
| SubSector: Semiconductor - Broad Line | |
| MarketCap: 22497.9 Millions | |
| Recent Price: 238.08 Smart Investing & Trading Score: 75 | |
| Day Percent Change: 1.29% Day Change: 3.04 | |
| Week Change: 10.67% Year-to-date Change: 3.7% | |
| NXPI Links: Profile News Message Board | |
| Charts:- Daily , Weekly | |
| Add NXPI to Watchlist: View: Get Complete NXPI Trend Analysis ➞ | |
 | RCI Rogers Communications Inc. |
| Sector: Technology | |
| SubSector: Wireless Communications | |
| MarketCap: 22111.6 Millions | |
| Recent Price: 38.04 Smart Investing & Trading Score: 17 | |
| Day Percent Change: -0.31% Day Change: -0.12 | |
| Week Change: -1.3% Year-to-date Change: -18.7% | |
| RCI Links: Profile News Message Board | |
| Charts:- Daily , Weekly | |
| Add RCI to Watchlist: View: Get Complete RCI Trend Analysis ➞ | |
 | HPQ HP Inc. |
| Sector: Technology | |
| SubSector: Diversified Computer Systems | |
| MarketCap: 22107.8 Millions | |
| Recent Price: 28.13 Smart Investing & Trading Score: 32 | |
| Day Percent Change: 0.11% Day Change: 0.03 | |
| Week Change: 1.15% Year-to-date Change: -6.5% | |
| HPQ Links: Profile News Message Board | |
| Charts:- Daily , Weekly | |
| Add HPQ to Watchlist: View: Get Complete HPQ Trend Analysis ➞ | |
 | VEEV Veeva Systems Inc. |
| Sector: Technology | |
| SubSector: Healthcare Information Services | |
| MarketCap: 21492.1 Millions | |
| Recent Price: 199.09 Smart Investing & Trading Score: 25 | |
| Day Percent Change: -0.71% Day Change: -1.43 | |
| Week Change: 0.36% Year-to-date Change: 3.4% | |
| VEEV Links: Profile News Message Board | |
| Charts:- Daily , Weekly | |
| Add VEEV to Watchlist: View: Get Complete VEEV Trend Analysis ➞ | |
 | MSCI MSCI Inc. |
| Sector: Technology | |
| SubSector: Processing Systems & Products | |
| MarketCap: 21086.3 Millions | |
| Recent Price: 464.49 Smart Investing & Trading Score: 17 | |
| Day Percent Change: -0.03% Day Change: -0.16 | |
| Week Change: -8.94% Year-to-date Change: -17.9% | |
| MSCI Links: Profile News Message Board | |
| Charts:- Daily , Weekly | |
| Add MSCI to Watchlist: View: Get Complete MSCI Trend Analysis ➞ | |
| For tabular summary view of above stock list: Summary View ➞ 0 - 25 , 25 - 50 , 50 - 75 , 75 - 100 , 100 - 125 , 125 - 150 , 150 - 175 , 175 - 200 , 200 - 225 , 225 - 250 , 250 - 275 , 275 - 300 , 300 - 325 , 325 - 350 , 350 - 375 , 375 - 400 , 400 - 425 , 425 - 450 , 450 - 475 , 475 - 500 , 500 - 525 , 525 - 550 , 550 - 575 , 575 - 600 , 600 - 625 , 625 - 650 | ||
| Click To Change The Sort Order: By Market Cap or Company Size Performance: Year-to-date, Week and Day | |
| Select Chart Type: | ||
|
Best Stocks Today 12Stocks.com |
© 2024 12Stocks.com Terms & Conditions Privacy Contact Us
All Information Provided Only For Education And Not To Be Used For Investing or Trading. See Terms & Conditions


One More Thing ... Get Best Stocks Delivered Daily!
Never Ever Miss A Move With Our Top Ten Stocks Lists
Find Best Stocks In Any Market - Bull or Bear Market
Take A Peek At Our Top Ten Stocks Lists: Daily, Weekly, Year-to-Date & Top Trends
Find Best Stocks In Any Market - Bull or Bear Market
Take A Peek At Our Top Ten Stocks Lists: Daily, Weekly, Year-to-Date & Top Trends
Technology Stocks With Best Up Trends [0-bearish to 100-bullish]: HashiCorp [100], Teradyne [100], Karooooo [100], Cricut [100], Grab [100], Microchip [100], Sanmina [100], JD.com [100], EchoStar [100], Analog Devices[100], Allegro MicroSystems[100]
Best Technology Stocks Year-to-Date:
MediaCo Holding[390.61%], Super Micro[177%], Uxin [172.47%], Smith Micro[168.77%], CXApp [166.41%], CuriosityStream [103.67%], GigaCloud [97.54%], MicroStrategy [96.39%], SoundHound AI[94.39%], Cheetah Mobile[88.16%], NextNav [85.73%] Best Technology Stocks This Week:
Matterport [168.97%], Amesite [58.44%], HashiCorp [36.92%], Impinj [33.73%], WiMi Hologram[33.51%], Ribbon [25.58%], Cheetah Mobile[21.19%], on [20.61%], iQIYI [17.99%], SoundHound AI[17.18%], IonQ [15.37%] Best Technology Stocks Daily:
Impinj [28.65%], HashiCorp [10.69%], Tyler [9.32%], SiTime [8.84%], Cheetah Mobile[8.33%], on [8.21%], Teradyne [8.15%], Karooooo [7.84%], Viomi [7.13%], Comtech Tele[6.86%], CACI [5.93%]