
 Login Sign Up


| |||||
 |  | ||||

| 12Stocks.com Market Intelligence |
Best SmallCap Stocks
|
| In a hurry? Small Cap Stock Lists: Performance Trends Table, Stock Charts
Sort Small Cap stocks: Daily, Weekly, Year-to-Date, Market Cap & Trends. Filter Small Cap stocks list by sector: Show all, Tech, Finance, Energy, Staples, Retail, Industrial, Materials, Utilities and HealthCare Filter Small Cap stocks list by size: All Large Medium Small and MicroCap |
| 12Stocks.com Small Cap Stocks Performances & Trends Daily | |||||||||
|
|  The overall Smart Investing & Trading Score is 90 (0-bearish to 100-bullish) which puts Small Cap index in short term bullish trend. The Smart Investing & Trading Score from previous trading session is 100 and hence a deterioration of trend.
| ||||||||
Here are the Smart Investing & Trading Scores of the most requested small cap stocks at 12Stocks.com (click stock name for detailed review):
|


| 12Stocks.com: Investing in Smallcap Index with Stocks | |
|
The following table helps investors and traders sort through current performance and trends (as measured by Smart Investing & Trading Score) of various
stocks in the Smallcap Index. Quick View: Move mouse or cursor over stock symbol (ticker) to view short-term technical chart and over stock name to view long term chart. Click on  to add stock symbol to your watchlist and to add stock symbol to your watchlist and  to view watchlist. Click on any ticker or stock name for detailed market intelligence report for that stock. to view watchlist. Click on any ticker or stock name for detailed market intelligence report for that stock. |
12Stocks.com Performance of Stocks in Smallcap Index
| Ticker | Stock Name | Watchlist | Category | Recent Price | Smart Investing & Trading Score | Change % | YTD Change% |
| HONE | HarborOne Bancorp |   | Financials | 10.94 | 90 | 0.64% | -8.68% |
| DRH | DiamondRock Hospitality | | Financials | 8.57 | 35 | 1.66% | -8.73% |
| AI | C3.ai | | Financials | 26.20 | 59 | -1.47% | -8.74% |
| SSBK | Southern States | | Financials | 26.84 | 76 | -0.78% | -8.83% |
| TIPT | Tiptree | | Financials | 17.25 | 64 | 0.52% | -9.02% |
| ABR | Arbor Realty | | Financials | 13.81 | 83 | -5.93% | -9.03% |
| EFSC | Enterprise Financial | | Financials | 40.61 | 100 | 1.20% | -9.05% |
| FSBW | FS Bancorp | | Financials | 33.62 | 65 | 0.95% | -9.05% |
| ORRF | Orrstown Financial | | Financials | 26.82 | 72 | 0.19% | -9.08% |
| BNL | Broadstone Net | | Financials | 15.65 | 88 | -0.19% | -9.12% |
| NWBI | Northwest Bancshares | | Financials | 11.33 | 62 | 0.27% | -9.21% |
| BDN | Brandywine Realty | | Financials | 4.89 | 83 | -1.21% | -9.44% |
| DEA | Easterly Government | | Financials | 12.17 | 83 | 0.08% | -9.45% |
| CCNE | CNB Financial | | Financials | 20.45 | 100 | 0.99% | -9.47% |
| THFF | First Financial | | Financials | 38.95 | 95 | -0.33% | -9.48% |
| WSBF | Waterstone Financial | | Financials | 12.84 | 100 | 1.42% | -9.58% |
| WAFD | Washington Federal | | Financials | 29.79 | 100 | 0.30% | -9.62% |
| INN | Summit Hotel | | Financials | 6.07 | 18 | 0.33% | -9.67% |
| CHCT | Community Healthcare | | Financials | 24.05 | 28 | 0.12% | -9.72% |
| CBL | CBL & Associates Properties | | Financials | 22.04 | 54 | 0.50% | -9.75% |
| NBTB | NBT Bancorp | | Financials | 37.82 | 90 | -0.45% | -9.76% |
| MPB | Mid Penn | | Financials | 21.91 | 90 | 0.85% | -9.78% |
| PEBO | Peoples Bancorp | | Financials | 30.45 | 83 | -0.91% | -9.80% |
| ROIC | Retail Opportunity | | Financials | 12.65 | 74 | 0.16% | -9.84% |
| ALEX | Alexander & Baldwin | | Financials | 17.13 | 95 | 0.47% | -9.94% |
| For chart view version of above stock list: Chart View ➞ 0 - 25 , 25 - 50 , 50 - 75 , 75 - 100 , 100 - 125 , 125 - 150 , 150 - 175 , 175 - 200 , 200 - 225 , 225 - 250 , 250 - 275 , 275 - 300 , 300 - 325 , 325 - 350 , 350 - 375 , 375 - 400 | ||
 | Click To Change The Sort Order: By Market Cap or Company Size Performance: Year-to-date, Week and Day |  |
| Too many stocks? View smallcap stocks filtered by marketcap & sector |
| Marketcap: All SmallCap Stocks (default-no microcap), Large, Mid-Range, Small |
| Smallcap Sector: Tech, Finance, Energy, Staples, Retail, Industrial, Materials, & Medical |
|
Get the most comprehensive stock market coverage daily at 12Stocks.com ➞ Best Stocks Today ➞ Best Stocks Weekly ➞ Best Stocks Year-to-Date ➞ Best Stocks Trends ➞  Best Stocks Today 12Stocks.com Best Nasdaq Stocks ➞ Best S&P 500 Stocks ➞ Best Tech Stocks ➞ Best Biotech Stocks ➞ |
| Detailed Overview of SmallCap Stocks |
| SmallCap Technical Overview, Leaders & Laggards, Top SmallCap ETF Funds & Detailed SmallCap Stocks List, Charts, Trends & More |
| Smallcap: Technical Analysis, Trends & YTD Performance | |
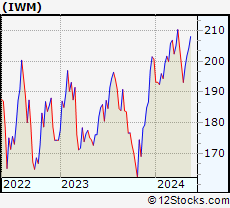
| SmallCap segment as represented by
IWM, an exchange-traded fund [ETF], holds basket of thousands of smallcap stocks from across all major sectors of the US stock market. The smallcap index (contains stocks like Riverbed & Sotheby's) is up by 3.6% and is currently underperforming the overall market by -6.82% year-to-date. Below is a quick view of technical charts and trends: | |
 IWM Weekly Chart |
|
| Long Term Trend: Very Good | |
| Medium Term Trend: Very Good | |
 IWM Daily Chart |
|
| Short Term Trend: Good | |
| Overall Trend Score: 90 | |
| YTD Performance: 3.6% | |
| **Trend Scores & Views Are Only For Educational Purposes And Not For Investing | |
| 12Stocks.com: Top Performing Small Cap Index Stocks | ||||||||||||||||||||||||||||||||||||||||||||||||
 The top performing Small Cap Index stocks year to date are
Now, more recently, over last week, the top performing Small Cap Index stocks on the move are


|
||||||||||||||||||||||||||||||||||||||||||||||||
| 12Stocks.com: Investing in Smallcap Index using Exchange Traded Funds | |
|
The following table shows list of key exchange traded funds (ETF) that
help investors track Smallcap index. The following list also includes leveraged ETF funds that track twice or thrice the daily returns of Smallcap indices. Short or inverse ETF funds move in the opposite direction to the index they track and are useful during market pullbacks or during bear markets. Quick View: Move mouse or cursor over ETF symbol (ticker) to view short-term technical chart and over ETF name to view long term chart. Click on ticker or stock name for detailed view. Click on to add stock symbol to your watchlist and to view watchlist. |
12Stocks.com List of ETFs that track Smallcap Index
| Ticker | ETF Name | Watchlist | Recent Price | Smart Investing & Trading Score | Change % | Week % | Year-to-date % |
| IWM | iShares Russell 2000 | | 207.93 | 90 | -0.72 | 1.77 | 3.6% |
| VTWO | Vanguard Russell 2000 ETF | | 84.11 | 85 | -0.61 | 1.8 | 3.71% |
| IJR | iShares Core S&P Small-Cap | | 110.63 | 83 | -0.14 | 1.51 | 2.2% |
| IWN | iShares Russell 2000 Value | | 158.82 | 88 | 0.06 | 1.68 | 2.25% |
| IJT | iShares S&P Small-Cap 600 Growth | | 131.29 | 78 | -0.69 | 1.1 | 4.91% |
| IJS | iShares S&P Small-Cap 600 Value | | 102.02 | 83 | -0.11 | 1.49 | -1.02% |
| IWO | iShares Russell 2000 Growth | | 267.15 | 95 | 0.21 | 2.78 | 5.92% |
| XSLV | PowerShares S&P SmallCap Low Volatil ETF | | 44.48 | 76 | -0.02 | 0.57 | 0.75% |
| SBB | ProShares Short SmallCap600 | | 15.71 | 17 | 0.32 | -1.54 | -1.38% |
| SAA | ProShares Ultra SmallCap600 | | 24.78 | 71 | -1.69 | 1.77 | -0.68% |
| SMLV | SPDR SSGA US Small Cap Low Volatil ETF | | 112.79 | 95 | 0.22 | 1.41 | 0.24% |
| SDD | ProShares UltraShort SmallCap600 | | 17.67 | 27 | 0.00 | -3.34 | -4.11% |
| 12Stocks.com: Charts, Trends, Fundamental Data and Performances of SmallCap Stocks | |
|
We now take in-depth look at all SmallCap stocks including charts, multi-period performances and overall trends (as measured by Smart Investing & Trading Score). One can sort SmallCap stocks (click link to choose) by Daily, Weekly and by Year-to-Date performances. Also, one can sort by size of the company or by market capitalization. |
| Select Your Default Chart Type: | |||||
| |||||
| Click on stock symbol or name for detailed view. Click on to add stock symbol to your watchlist and to view watchlist. Quick View: Move mouse or cursor over "Daily" to quickly view daily technical stock chart and over "Weekly" to view weekly technical stock chart. | |||||

 | HONE HarborOne Bancorp, Inc. |
| Sector: Financials | |
| SubSector: Savings & Loans | |
| MarketCap: 456.03 Millions | |
| Recent Price: 10.94 Smart Investing & Trading Score: 90 | |
| Day Percent Change: 0.64% Day Change: 0.07 | |
| Week Change: 0.83% Year-to-date Change: -8.7% | |
| HONE Links: Profile News Message Board | |
| Charts:- Daily , Weekly | |
| Add HONE to Watchlist: View: Get Complete HONE Trend Analysis ➞ | |
 | DRH DiamondRock Hospitality Company |
| Sector: Financials | |
| SubSector: REIT - Hotel/Motel | |
| MarketCap: 964 Millions | |
| Recent Price: 8.57 Smart Investing & Trading Score: 35 | |
| Day Percent Change: 1.66% Day Change: 0.14 | |
| Week Change: 0.71% Year-to-date Change: -8.7% | |
| DRH Links: Profile News Message Board | |
| Charts:- Daily , Weekly | |
| Add DRH to Watchlist: View: Get Complete DRH Trend Analysis ➞ | |
 | AI C3.ai, Inc. |
| Sector: Financials | |
| SubSector: REIT Mortgage | |
| MarketCap: 12467 Millions | |
| Recent Price: 26.20 Smart Investing & Trading Score: 59 | |
| Day Percent Change: -1.47% Day Change: -0.39 | |
| Week Change: 9.67% Year-to-date Change: -8.7% | |
| AI Links: Profile News Message Board | |
| Charts:- Daily , Weekly | |
| Add AI to Watchlist: View: Get Complete AI Trend Analysis ➞ | |
 | SSBK Southern States Bancshares, Inc. |
| Sector: Financials | |
| SubSector: Banks - Regional | |
| MarketCap: 187 Millions | |
| Recent Price: 26.84 Smart Investing & Trading Score: 76 | |
| Day Percent Change: -0.78% Day Change: -0.21 | |
| Week Change: -0.37% Year-to-date Change: -8.8% | |
| SSBK Links: Profile News Message Board | |
| Charts:- Daily , Weekly | |
| Add SSBK to Watchlist: View: Get Complete SSBK Trend Analysis ➞ | |
 | TIPT Tiptree Inc. |
| Sector: Financials | |
| SubSector: Life Insurance | |
| MarketCap: 183.486 Millions | |
| Recent Price: 17.25 Smart Investing & Trading Score: 64 | |
| Day Percent Change: 0.52% Day Change: 0.09 | |
| Week Change: 0.23% Year-to-date Change: -9.0% | |
| TIPT Links: Profile News Message Board | |
| Charts:- Daily , Weekly | |
| Add TIPT to Watchlist: View: Get Complete TIPT Trend Analysis ➞ | |
 | ABR Arbor Realty Trust, Inc. |
| Sector: Financials | |
| SubSector: Mortgage Investment | |
| MarketCap: 648.939 Millions | |
| Recent Price: 13.81 Smart Investing & Trading Score: 83 | |
| Day Percent Change: -5.93% Day Change: -0.87 | |
| Week Change: 5.42% Year-to-date Change: -9.0% | |
| ABR Links: Profile News Message Board | |
| Charts:- Daily , Weekly | |
| Add ABR to Watchlist: View: Get Complete ABR Trend Analysis ➞ | |
 | EFSC Enterprise Financial Services Corp |
| Sector: Financials | |
| SubSector: Regional - Southwest Banks | |
| MarketCap: 770.165 Millions | |
| Recent Price: 40.61 Smart Investing & Trading Score: 100 | |
| Day Percent Change: 1.20% Day Change: 0.48 | |
| Week Change: 1.65% Year-to-date Change: -9.1% | |
| EFSC Links: Profile News Message Board | |
| Charts:- Daily , Weekly | |
| Add EFSC to Watchlist: View: Get Complete EFSC Trend Analysis ➞ | |
 | FSBW FS Bancorp, Inc. |
| Sector: Financials | |
| SubSector: Regional - Pacific Banks | |
| MarketCap: 140.429 Millions | |
| Recent Price: 33.62 Smart Investing & Trading Score: 65 | |
| Day Percent Change: 0.95% Day Change: 0.32 | |
| Week Change: 2.83% Year-to-date Change: -9.1% | |
| FSBW Links: Profile News Message Board | |
| Charts:- Daily , Weekly | |
| Add FSBW to Watchlist: View: Get Complete FSBW Trend Analysis ➞ | |
 | ORRF Orrstown Financial Services, Inc. |
| Sector: Financials | |
| SubSector: Regional - Northeast Banks | |
| MarketCap: 159.999 Millions | |
| Recent Price: 26.82 Smart Investing & Trading Score: 72 | |
| Day Percent Change: 0.19% Day Change: 0.05 | |
| Week Change: 0.64% Year-to-date Change: -9.1% | |
| ORRF Links: Profile News Message Board | |
| Charts:- Daily , Weekly | |
| Add ORRF to Watchlist: View: Get Complete ORRF Trend Analysis ➞ | |
 | BNL Broadstone Net Lease, Inc. |
| Sector: Financials | |
| SubSector: REIT Diversified | |
| MarketCap: 27267 Millions | |
| Recent Price: 15.65 Smart Investing & Trading Score: 88 | |
| Day Percent Change: -0.19% Day Change: -0.03 | |
| Week Change: 2.69% Year-to-date Change: -9.1% | |
| BNL Links: Profile News Message Board | |
| Charts:- Daily , Weekly | |
| Add BNL to Watchlist: View: Get Complete BNL Trend Analysis ➞ | |
 | NWBI Northwest Bancshares, Inc. |
| Sector: Financials | |
| SubSector: Savings & Loans | |
| MarketCap: 1266.3 Millions | |
| Recent Price: 11.33 Smart Investing & Trading Score: 62 | |
| Day Percent Change: 0.27% Day Change: 0.03 | |
| Week Change: 1.71% Year-to-date Change: -9.2% | |
| NWBI Links: Profile News Message Board | |
| Charts:- Daily , Weekly | |
| Add NWBI to Watchlist: View: Get Complete NWBI Trend Analysis ➞ | |
 | BDN Brandywine Realty Trust |
| Sector: Financials | |
| SubSector: REIT - Diversified | |
| MarketCap: 1688.13 Millions | |
| Recent Price: 4.89 Smart Investing & Trading Score: 83 | |
| Day Percent Change: -1.21% Day Change: -0.06 | |
| Week Change: 3.82% Year-to-date Change: -9.4% | |
| BDN Links: Profile News Message Board | |
| Charts:- Daily , Weekly | |
| Add BDN to Watchlist: View: Get Complete BDN Trend Analysis ➞ | |
 | DEA Easterly Government Properties, Inc. |
| Sector: Financials | |
| SubSector: REIT - Office | |
| MarketCap: 1832.56 Millions | |
| Recent Price: 12.17 Smart Investing & Trading Score: 83 | |
| Day Percent Change: 0.08% Day Change: 0.01 | |
| Week Change: 1.76% Year-to-date Change: -9.5% | |
| DEA Links: Profile News Message Board | |
| Charts:- Daily , Weekly | |
| Add DEA to Watchlist: View: Get Complete DEA Trend Analysis ➞ | |
 | CCNE CNB Financial Corporation |
| Sector: Financials | |
| SubSector: Regional - Northeast Banks | |
| MarketCap: 286.599 Millions | |
| Recent Price: 20.45 Smart Investing & Trading Score: 100 | |
| Day Percent Change: 0.99% Day Change: 0.20 | |
| Week Change: 1.84% Year-to-date Change: -9.5% | |
| CCNE Links: Profile News Message Board | |
| Charts:- Daily , Weekly | |
| Add CCNE to Watchlist: View: Get Complete CCNE Trend Analysis ➞ | |
 | THFF First Financial Corporation |
| Sector: Financials | |
| SubSector: Regional - Midwest Banks | |
| MarketCap: 433.07 Millions | |
| Recent Price: 38.95 Smart Investing & Trading Score: 95 | |
| Day Percent Change: -0.33% Day Change: -0.13 | |
| Week Change: 1.43% Year-to-date Change: -9.5% | |
| THFF Links: Profile News Message Board | |
| Charts:- Daily , Weekly | |
| Add THFF to Watchlist: View: Get Complete THFF Trend Analysis ➞ | |
 | WSBF Waterstone Financial, Inc. |
| Sector: Financials | |
| SubSector: Savings & Loans | |
| MarketCap: 371.93 Millions | |
| Recent Price: 12.84 Smart Investing & Trading Score: 100 | |
| Day Percent Change: 1.42% Day Change: 0.18 | |
| Week Change: 4.14% Year-to-date Change: -9.6% | |
| WSBF Links: Profile News Message Board | |
| Charts:- Daily , Weekly | |
| Add WSBF to Watchlist: View: Get Complete WSBF Trend Analysis ➞ | |
 | WAFD Washington Federal, Inc. |
| Sector: Financials | |
| SubSector: Savings & Loans | |
| MarketCap: 2219.2 Millions | |
| Recent Price: 29.79 Smart Investing & Trading Score: 100 | |
| Day Percent Change: 0.30% Day Change: 0.09 | |
| Week Change: 4.16% Year-to-date Change: -9.6% | |
| WAFD Links: Profile News Message Board | |
| Charts:- Daily , Weekly | |
| Add WAFD to Watchlist: View: Get Complete WAFD Trend Analysis ➞ | |
 | INN Summit Hotel Properties, Inc. |
| Sector: Financials | |
| SubSector: Real Estate Development | |
| MarketCap: 402.019 Millions | |
| Recent Price: 6.07 Smart Investing & Trading Score: 18 | |
| Day Percent Change: 0.33% Day Change: 0.02 | |
| Week Change: 0.17% Year-to-date Change: -9.7% | |
| INN Links: Profile News Message Board | |
| Charts:- Daily , Weekly | |
| Add INN to Watchlist: View: Get Complete INN Trend Analysis ➞ | |
 | CHCT Community Healthcare Trust Incorporated |
| Sector: Financials | |
| SubSector: REIT - Healthcare Facilities | |
| MarketCap: 698.614 Millions | |
| Recent Price: 24.05 Smart Investing & Trading Score: 28 | |
| Day Percent Change: 0.12% Day Change: 0.03 | |
| Week Change: 0.25% Year-to-date Change: -9.7% | |
| CHCT Links: Profile News Message Board | |
| Charts:- Daily , Weekly | |
| Add CHCT to Watchlist: View: Get Complete CHCT Trend Analysis ➞ | |
 | CBL CBL & Associates Properties, Inc. |
| Sector: Financials | |
| SubSector: REIT - Retail | |
| MarketCap: 690 Millions | |
| Recent Price: 22.04 Smart Investing & Trading Score: 54 | |
| Day Percent Change: 0.50% Day Change: 0.11 | |
| Week Change: -0.5% Year-to-date Change: -9.8% | |
| CBL Links: Profile News Message Board | |
| Charts:- Daily , Weekly | |
| Add CBL to Watchlist: View: Get Complete CBL Trend Analysis ➞ | |
 | NBTB NBT Bancorp Inc. |
| Sector: Financials | |
| SubSector: Regional - Northeast Banks | |
| MarketCap: 1451.89 Millions | |
| Recent Price: 37.82 Smart Investing & Trading Score: 90 | |
| Day Percent Change: -0.45% Day Change: -0.17 | |
| Week Change: 0.21% Year-to-date Change: -9.8% | |
| NBTB Links: Profile News Message Board | |
| Charts:- Daily , Weekly | |
| Add NBTB to Watchlist: View: Get Complete NBTB Trend Analysis ➞ | |
 | MPB Mid Penn Bancorp, Inc. |
| Sector: Financials | |
| SubSector: Regional - Northeast Banks | |
| MarketCap: 187.699 Millions | |
| Recent Price: 21.91 Smart Investing & Trading Score: 90 | |
| Day Percent Change: 0.85% Day Change: 0.19 | |
| Week Change: 1.79% Year-to-date Change: -9.8% | |
| MPB Links: Profile News Message Board | |
| Charts:- Daily , Weekly | |
| Add MPB to Watchlist: View: Get Complete MPB Trend Analysis ➞ | |
 | PEBO Peoples Bancorp Inc. |
| Sector: Financials | |
| SubSector: Regional - Midwest Banks | |
| MarketCap: 449.77 Millions | |
| Recent Price: 30.45 Smart Investing & Trading Score: 83 | |
| Day Percent Change: -0.91% Day Change: -0.28 | |
| Week Change: 0% Year-to-date Change: -9.8% | |
| PEBO Links: Profile News Message Board | |
| Charts:- Daily , Weekly | |
| Add PEBO to Watchlist: View: Get Complete PEBO Trend Analysis ➞ | |
 | ROIC Retail Opportunity Investments Corp. |
| Sector: Financials | |
| SubSector: REIT - Retail | |
| MarketCap: 943.414 Millions | |
| Recent Price: 12.65 Smart Investing & Trading Score: 74 | |
| Day Percent Change: 0.16% Day Change: 0.02 | |
| Week Change: 1.69% Year-to-date Change: -9.8% | |
| ROIC Links: Profile News Message Board | |
| Charts:- Daily , Weekly | |
| Add ROIC to Watchlist: View: Get Complete ROIC Trend Analysis ➞ | |
 | ALEX Alexander & Baldwin, Inc. |
| Sector: Financials | |
| SubSector: Real Estate Development | |
| MarketCap: 751.419 Millions | |
| Recent Price: 17.13 Smart Investing & Trading Score: 95 | |
| Day Percent Change: 0.47% Day Change: 0.08 | |
| Week Change: 2.15% Year-to-date Change: -9.9% | |
| ALEX Links: Profile News Message Board | |
| Charts:- Daily , Weekly | |
| Add ALEX to Watchlist: View: Get Complete ALEX Trend Analysis ➞ | |
| For tabular summary view of above stock list: Summary View ➞ 0 - 25 , 25 - 50 , 50 - 75 , 75 - 100 , 100 - 125 , 125 - 150 , 150 - 175 , 175 - 200 , 200 - 225 , 225 - 250 , 250 - 275 , 275 - 300 , 300 - 325 , 325 - 350 , 350 - 375 , 375 - 400 | ||
| Click To Change The Sort Order: By Market Cap or Company Size Performance: Year-to-date, Week and Day | |
| Select Chart Type: | ||
| Too many stocks? View smallcap stocks filtered by marketcap & sector |
| Marketcap: All SmallCap Stocks (default-no microcap), Large, Mid-Range, Small & MicroCap |
| Sector: Tech, Finance, Energy, Staples, Retail, Industrial, Materials, Utilities & Medical |
|
Best Stocks Today 12Stocks.com |
© 2024 12Stocks.com Terms & Conditions Privacy Contact Us
All Information Provided Only For Education And Not To Be Used For Investing or Trading. See Terms & Conditions


One More Thing ... Get Best Stocks Delivered Daily!
Never Ever Miss A Move With Our Top Ten Stocks Lists
Find Best Stocks In Any Market - Bull or Bear Market
Take A Peek At Our Top Ten Stocks Lists: Daily, Weekly, Year-to-Date & Top Trends
Find Best Stocks In Any Market - Bull or Bear Market
Take A Peek At Our Top Ten Stocks Lists: Daily, Weekly, Year-to-Date & Top Trends
Smallcap Stocks With Best Up Trends [0-bearish to 100-bullish]: Trupanion [100], Zura Bio[100], SilverBow Resources[100], Novavax [100], Third Harmonic[100], Hawkins [100], BRP Group[100], Kura Sushi[100], Aurinia [100], Heron [100], Cadiz [100]
Best Smallcap Stocks Year-to-Date:
CareMax [471.13%], Bakkt [370.4%], Janux [342.16%], Viking [304.73%], Alpine Immune[241.18%], Longboard [235.68%], Super Micro[218.16%], Avidity Biosciences[217.7%], Novavax [200%], Arcutis Bio[182.35%], Sweetgreen [181.24%] Best Smallcap Stocks This Week:
Novavax [62.16%], MacroGenics [54.68%], Maxeon Solar[49.31%], SunPower [43.04%], Harrow Health[39.31%], Workhorse Group[39.06%], Humacyte [36.6%], ProKidney [34.88%], Allbirds [33.47%], Cadiz [28.76%], Fossil Group[28.72%] Best Smallcap Stocks Daily:
Maxeon Solar[26.56%], Allakos [22.36%], Ventyx Biosciences[18.85%], Trupanion [15.85%], Zura Bio[15.61%], Beyond Air[15.42%], SilverBow Resources[13.20%], Children s[13.09%], Comtech Tele[12.92%], Aceto [12.14%], Novavax [11.63%]