
 Login Sign Up


| |||||
 |  | ||||

| 12Stocks.com Market Intelligence |
Best SmallCap Stocks
|
| In a hurry? Small Cap Stock Lists: Performance Trends Table, Stock Charts
Sort Small Cap stocks: Daily, Weekly, Year-to-Date, Market Cap & Trends. Filter Small Cap stocks list by sector: Show all, Tech, Finance, Energy, Staples, Retail, Industrial, Materials, Utilities and HealthCare Filter Small Cap stocks list by size: All Large Medium Small and MicroCap |
| 12Stocks.com Small Cap Stocks Performances & Trends Daily | |||||||||
|
|  The overall Smart Investing & Trading Score is 90 (0-bearish to 100-bullish) which puts Small Cap index in short term bullish trend. The Smart Investing & Trading Score from previous trading session is 100 and hence a deterioration of trend.
| ||||||||
Here are the Smart Investing & Trading Scores of the most requested small cap stocks at 12Stocks.com (click stock name for detailed review):
|


| 12Stocks.com: Investing in Smallcap Index with Stocks | |
|
The following table helps investors and traders sort through current performance and trends (as measured by Smart Investing & Trading Score) of various
stocks in the Smallcap Index. Quick View: Move mouse or cursor over stock symbol (ticker) to view short-term technical chart and over stock name to view long term chart. Click on  to add stock symbol to your watchlist and to add stock symbol to your watchlist and  to view watchlist. Click on any ticker or stock name for detailed market intelligence report for that stock. to view watchlist. Click on any ticker or stock name for detailed market intelligence report for that stock. |
12Stocks.com Performance of Stocks in Smallcap Index
| Ticker | Stock Name | Watchlist | Category | Recent Price | Smart Investing & Trading Score | Change % | YTD Change% |
| ATLO | Ames National |   | Financials | 20.89 | 90 | -0.38% | -2.11% |
| PJT | PJT Partners | | Financials | 99.58 | 32 | -1.08% | -2.25% |
| MFA | MFA Financial | | Financials | 11.00 | 74 | 0.18% | -2.40% |
| BSRR | Sierra Bancorp | | Financials | 21.97 | 76 | -1.48% | -2.57% |
| GTY | Getty Realty | | Financials | 28.47 | 100 | 0.78% | -2.57% |
| CNS | Cohen & Steers | | Financials | 73.76 | 87 | -0.19% | -2.60% |
| BLFY | Blue Foundry | | Financials | 9.38 | 87 | 3.08% | -2.60% |
| VRTS | Virtus | | Financials | 235.41 | 90 | 0.42% | -2.63% |
| HOMB | Home Bancshares | | Financials | 24.65 | 83 | -0.76% | -2.68% |
| RHP | Ryman Hospitality | | Financials | 106.81 | 50 | 0.73% | -2.95% |
| NBHC | National Bank | | Financials | 36.06 | 95 | 0.61% | -3.04% |
| MBI | MBIA | | Financials | 5.93 | 18 | -0.50% | -3.10% |
| STBA | S&T Bancorp | | Financials | 32.37 | 95 | 0.53% | -3.14% |
| JOE | St. Joe | | Financials | 58.26 | 48 | -0.56% | -3.19% |
| BFS | Saul Centers | | Financials | 37.91 | 100 | 1.61% | -3.46% |
| TCBI | Texas Capital | | Financials | 62.35 | 88 | 1.04% | -3.53% |
| FBRT | Franklin BSP | | Financials | 13.14 | 83 | -0.23% | -3.59% |
| LKFN | Lakeland Financial | | Financials | 62.81 | 57 | -0.51% | -3.61% |
| REFI | Chicago Atlantic | | Financials | 15.59 | 18 | -1.39% | -3.71% |
| BUSE | First Busey | | Financials | 23.85 | 90 | 0.00% | -3.91% |
| BRT | BRT Apartments | | Financials | 17.84 | 66 | -0.56% | -4.03% |
| HIFS | Hingham Institution | | Financials | 186.51 | 83 | -0.56% | -4.06% |
| CCBG | Capital City | | Financials | 28.22 | 87 | 0.93% | -4.11% |
| SRCE | 1st Source | | Financials | 52.68 | 88 | 0.23% | -4.13% |
| FRME | First Merchants | | Financials | 35.54 | 76 | -0.98% | -4.15% |
| For chart view version of above stock list: Chart View ➞ 0 - 25 , 25 - 50 , 50 - 75 , 75 - 100 , 100 - 125 , 125 - 150 , 150 - 175 , 175 - 200 , 200 - 225 , 225 - 250 , 250 - 275 , 275 - 300 , 300 - 325 , 325 - 350 , 350 - 375 , 375 - 400 | ||
 | Click To Change The Sort Order: By Market Cap or Company Size Performance: Year-to-date, Week and Day |  |
| Too many stocks? View smallcap stocks filtered by marketcap & sector |
| Marketcap: All SmallCap Stocks (default-no microcap), Large, Mid-Range, Small |
| Smallcap Sector: Tech, Finance, Energy, Staples, Retail, Industrial, Materials, & Medical |
|
Get the most comprehensive stock market coverage daily at 12Stocks.com ➞ Best Stocks Today ➞ Best Stocks Weekly ➞ Best Stocks Year-to-Date ➞ Best Stocks Trends ➞  Best Stocks Today 12Stocks.com Best Nasdaq Stocks ➞ Best S&P 500 Stocks ➞ Best Tech Stocks ➞ Best Biotech Stocks ➞ |
| Detailed Overview of SmallCap Stocks |
| SmallCap Technical Overview, Leaders & Laggards, Top SmallCap ETF Funds & Detailed SmallCap Stocks List, Charts, Trends & More |
| Smallcap: Technical Analysis, Trends & YTD Performance | |
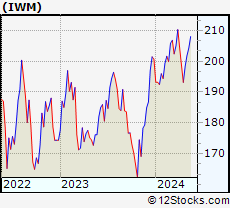
| SmallCap segment as represented by
IWM, an exchange-traded fund [ETF], holds basket of thousands of smallcap stocks from across all major sectors of the US stock market. The smallcap index (contains stocks like Riverbed & Sotheby's) is up by 3.6% and is currently underperforming the overall market by -6.82% year-to-date. Below is a quick view of technical charts and trends: | |
 IWM Weekly Chart |
|
| Long Term Trend: Very Good | |
| Medium Term Trend: Very Good | |
 IWM Daily Chart |
|
| Short Term Trend: Good | |
| Overall Trend Score: 90 | |
| YTD Performance: 3.6% | |
| **Trend Scores & Views Are Only For Educational Purposes And Not For Investing | |
| 12Stocks.com: Top Performing Small Cap Index Stocks | ||||||||||||||||||||||||||||||||||||||||||||||||
 The top performing Small Cap Index stocks year to date are
Now, more recently, over last week, the top performing Small Cap Index stocks on the move are


|
||||||||||||||||||||||||||||||||||||||||||||||||
| 12Stocks.com: Investing in Smallcap Index using Exchange Traded Funds | |
|
The following table shows list of key exchange traded funds (ETF) that
help investors track Smallcap index. The following list also includes leveraged ETF funds that track twice or thrice the daily returns of Smallcap indices. Short or inverse ETF funds move in the opposite direction to the index they track and are useful during market pullbacks or during bear markets. Quick View: Move mouse or cursor over ETF symbol (ticker) to view short-term technical chart and over ETF name to view long term chart. Click on ticker or stock name for detailed view. Click on to add stock symbol to your watchlist and to view watchlist. |
12Stocks.com List of ETFs that track Smallcap Index
| Ticker | ETF Name | Watchlist | Recent Price | Smart Investing & Trading Score | Change % | Week % | Year-to-date % |
| IWM | iShares Russell 2000 | | 207.93 | 90 | -0.72 | 1.77 | 3.6% |
| VTWO | Vanguard Russell 2000 ETF | | 84.11 | 85 | -0.61 | 1.8 | 3.71% |
| IJR | iShares Core S&P Small-Cap | | 110.63 | 83 | -0.14 | 1.51 | 2.2% |
| IWN | iShares Russell 2000 Value | | 158.82 | 88 | 0.06 | 1.68 | 2.25% |
| IJT | iShares S&P Small-Cap 600 Growth | | 131.29 | 78 | -0.69 | 1.1 | 4.91% |
| IJS | iShares S&P Small-Cap 600 Value | | 102.02 | 83 | -0.11 | 1.49 | -1.02% |
| IWO | iShares Russell 2000 Growth | | 267.15 | 95 | 0.21 | 2.78 | 5.92% |
| XSLV | PowerShares S&P SmallCap Low Volatil ETF | | 44.48 | 76 | -0.02 | 0.57 | 0.75% |
| SBB | ProShares Short SmallCap600 | | 15.71 | 17 | 0.32 | -1.54 | -1.38% |
| SAA | ProShares Ultra SmallCap600 | | 24.78 | 71 | -1.69 | 1.77 | -0.68% |
| SMLV | SPDR SSGA US Small Cap Low Volatil ETF | | 112.79 | 95 | 0.22 | 1.41 | 0.24% |
| SDD | ProShares UltraShort SmallCap600 | | 17.67 | 27 | 0.00 | -3.34 | -4.11% |
| 12Stocks.com: Charts, Trends, Fundamental Data and Performances of SmallCap Stocks | |
|
We now take in-depth look at all SmallCap stocks including charts, multi-period performances and overall trends (as measured by Smart Investing & Trading Score). One can sort SmallCap stocks (click link to choose) by Daily, Weekly and by Year-to-Date performances. Also, one can sort by size of the company or by market capitalization. |
| Select Your Default Chart Type: | |||||
| |||||
| Click on stock symbol or name for detailed view. Click on to add stock symbol to your watchlist and to view watchlist. Quick View: Move mouse or cursor over "Daily" to quickly view daily technical stock chart and over "Weekly" to view weekly technical stock chart. | |||||

 | ATLO Ames National Corporation |
| Sector: Financials | |
| SubSector: Regional - Northeast Banks | |
| MarketCap: 195.999 Millions | |
| Recent Price: 20.89 Smart Investing & Trading Score: 90 | |
| Day Percent Change: -0.38% Day Change: -0.08 | |
| Week Change: -0.48% Year-to-date Change: -2.1% | |
| ATLO Links: Profile News Message Board | |
| Charts:- Daily , Weekly | |
| Add ATLO to Watchlist: View: Get Complete ATLO Trend Analysis ➞ | |
 | PJT PJT Partners Inc. |
| Sector: Financials | |
| SubSector: Asset Management | |
| MarketCap: 1100.93 Millions | |
| Recent Price: 99.58 Smart Investing & Trading Score: 32 | |
| Day Percent Change: -1.08% Day Change: -1.09 | |
| Week Change: -1.66% Year-to-date Change: -2.3% | |
| PJT Links: Profile News Message Board | |
| Charts:- Daily , Weekly | |
| Add PJT to Watchlist: View: Get Complete PJT Trend Analysis ➞ | |
 | MFA MFA Financial, Inc. |
| Sector: Financials | |
| SubSector: Mortgage Investment | |
| MarketCap: 1869.69 Millions | |
| Recent Price: 11.00 Smart Investing & Trading Score: 74 | |
| Day Percent Change: 0.18% Day Change: 0.02 | |
| Week Change: 1.48% Year-to-date Change: -2.4% | |
| MFA Links: Profile News Message Board | |
| Charts:- Daily , Weekly | |
| Add MFA to Watchlist: View: Get Complete MFA Trend Analysis ➞ | |
 | BSRR Sierra Bancorp |
| Sector: Financials | |
| SubSector: Regional - Pacific Banks | |
| MarketCap: 256.929 Millions | |
| Recent Price: 21.97 Smart Investing & Trading Score: 76 | |
| Day Percent Change: -1.48% Day Change: -0.33 | |
| Week Change: -0.41% Year-to-date Change: -2.6% | |
| BSRR Links: Profile News Message Board | |
| Charts:- Daily , Weekly | |
| Add BSRR to Watchlist: View: Get Complete BSRR Trend Analysis ➞ | |
 | GTY Getty Realty Corp. |
| Sector: Financials | |
| SubSector: REIT - Retail | |
| MarketCap: 926.114 Millions | |
| Recent Price: 28.47 Smart Investing & Trading Score: 100 | |
| Day Percent Change: 0.78% Day Change: 0.22 | |
| Week Change: 1.86% Year-to-date Change: -2.6% | |
| GTY Links: Profile News Message Board | |
| Charts:- Daily , Weekly | |
| Add GTY to Watchlist: View: Get Complete GTY Trend Analysis ➞ | |
 | CNS Cohen & Steers, Inc. |
| Sector: Financials | |
| SubSector: Asset Management | |
| MarketCap: 2082.43 Millions | |
| Recent Price: 73.76 Smart Investing & Trading Score: 87 | |
| Day Percent Change: -0.19% Day Change: -0.14 | |
| Week Change: 4.3% Year-to-date Change: -2.6% | |
| CNS Links: Profile News Message Board | |
| Charts:- Daily , Weekly | |
| Add CNS to Watchlist: View: Get Complete CNS Trend Analysis ➞ | |
 | BLFY Blue Foundry Bancorp |
| Sector: Financials | |
| SubSector: Banks - Regional | |
| MarketCap: 264 Millions | |
| Recent Price: 9.38 Smart Investing & Trading Score: 87 | |
| Day Percent Change: 3.08% Day Change: 0.28 | |
| Week Change: 3.19% Year-to-date Change: -2.6% | |
| BLFY Links: Profile News Message Board | |
| Charts:- Daily , Weekly | |
| Add BLFY to Watchlist: View: Get Complete BLFY Trend Analysis ➞ | |
 | VRTS Virtus Investment Partners, Inc. |
| Sector: Financials | |
| SubSector: Asset Management | |
| MarketCap: 601.303 Millions | |
| Recent Price: 235.41 Smart Investing & Trading Score: 90 | |
| Day Percent Change: 0.42% Day Change: 0.98 | |
| Week Change: 2.05% Year-to-date Change: -2.6% | |
| VRTS Links: Profile News Message Board | |
| Charts:- Daily , Weekly | |
| Add VRTS to Watchlist: View: Get Complete VRTS Trend Analysis ➞ | |
 | HOMB Home Bancshares, Inc. (Conway, AR) |
| Sector: Financials | |
| SubSector: Money Center Banks | |
| MarketCap: 2090.49 Millions | |
| Recent Price: 24.65 Smart Investing & Trading Score: 83 | |
| Day Percent Change: -0.76% Day Change: -0.19 | |
| Week Change: -0.76% Year-to-date Change: -2.7% | |
| HOMB Links: Profile News Message Board | |
| Charts:- Daily , Weekly | |
| Add HOMB to Watchlist: View: Get Complete HOMB Trend Analysis ➞ | |
 | RHP Ryman Hospitality Properties, Inc. |
| Sector: Financials | |
| SubSector: REIT - Hotel/Motel | |
| MarketCap: 1519.74 Millions | |
| Recent Price: 106.81 Smart Investing & Trading Score: 50 | |
| Day Percent Change: 0.73% Day Change: 0.77 | |
| Week Change: 0.82% Year-to-date Change: -3.0% | |
| RHP Links: Profile News Message Board | |
| Charts:- Daily , Weekly | |
| Add RHP to Watchlist: View: Get Complete RHP Trend Analysis ➞ | |
 | NBHC National Bank Holdings Corporation |
| Sector: Financials | |
| SubSector: Regional - Midwest Banks | |
| MarketCap: 766.87 Millions | |
| Recent Price: 36.06 Smart Investing & Trading Score: 95 | |
| Day Percent Change: 0.61% Day Change: 0.22 | |
| Week Change: 1.55% Year-to-date Change: -3.0% | |
| NBHC Links: Profile News Message Board | |
| Charts:- Daily , Weekly | |
| Add NBHC to Watchlist: View: Get Complete NBHC Trend Analysis ➞ | |
 | MBI MBIA Inc. |
| Sector: Financials | |
| SubSector: Property & Casualty Insurance | |
| MarketCap: 539.012 Millions | |
| Recent Price: 5.93 Smart Investing & Trading Score: 18 | |
| Day Percent Change: -0.50% Day Change: -0.03 | |
| Week Change: -3.58% Year-to-date Change: -3.1% | |
| MBI Links: Profile News Message Board | |
| Charts:- Daily , Weekly | |
| Add MBI to Watchlist: View: Get Complete MBI Trend Analysis ➞ | |
 | STBA S&T Bancorp, Inc. |
| Sector: Financials | |
| SubSector: Regional - Northeast Banks | |
| MarketCap: 1136.99 Millions | |
| Recent Price: 32.37 Smart Investing & Trading Score: 95 | |
| Day Percent Change: 0.53% Day Change: 0.17 | |
| Week Change: 1.54% Year-to-date Change: -3.1% | |
| STBA Links: Profile News Message Board | |
| Charts:- Daily , Weekly | |
| Add STBA to Watchlist: View: Get Complete STBA Trend Analysis ➞ | |
 | JOE The St. Joe Company |
| Sector: Financials | |
| SubSector: Real Estate Development | |
| MarketCap: 1029.39 Millions | |
| Recent Price: 58.26 Smart Investing & Trading Score: 48 | |
| Day Percent Change: -0.56% Day Change: -0.33 | |
| Week Change: -0.36% Year-to-date Change: -3.2% | |
| JOE Links: Profile News Message Board | |
| Charts:- Daily , Weekly | |
| Add JOE to Watchlist: View: Get Complete JOE Trend Analysis ➞ | |
 | BFS Saul Centers, Inc. |
| Sector: Financials | |
| SubSector: REIT - Retail | |
| MarketCap: 689.914 Millions | |
| Recent Price: 37.91 Smart Investing & Trading Score: 100 | |
| Day Percent Change: 1.61% Day Change: 0.60 | |
| Week Change: 2.76% Year-to-date Change: -3.5% | |
| BFS Links: Profile News Message Board | |
| Charts:- Daily , Weekly | |
| Add BFS to Watchlist: View: Get Complete BFS Trend Analysis ➞ | |
 | TCBI Texas Capital Bancshares, Inc. |
| Sector: Financials | |
| SubSector: Regional - Southwest Banks | |
| MarketCap: 1202.75 Millions | |
| Recent Price: 62.35 Smart Investing & Trading Score: 88 | |
| Day Percent Change: 1.04% Day Change: 0.64 | |
| Week Change: 1.48% Year-to-date Change: -3.5% | |
| TCBI Links: Profile News Message Board | |
| Charts:- Daily , Weekly | |
| Add TCBI to Watchlist: View: Get Complete TCBI Trend Analysis ➞ | |
 | FBRT Franklin BSP Realty Trust, Inc. |
| Sector: Financials | |
| SubSector: REIT - Mortgage | |
| MarketCap: 1170 Millions | |
| Recent Price: 13.14 Smart Investing & Trading Score: 83 | |
| Day Percent Change: -0.23% Day Change: -0.03 | |
| Week Change: 1.08% Year-to-date Change: -3.6% | |
| FBRT Links: Profile News Message Board | |
| Charts:- Daily , Weekly | |
| Add FBRT to Watchlist: View: Get Complete FBRT Trend Analysis ➞ | |
 | LKFN Lakeland Financial Corporation |
| Sector: Financials | |
| SubSector: Regional - Midwest Banks | |
| MarketCap: 903.27 Millions | |
| Recent Price: 62.81 Smart Investing & Trading Score: 57 | |
| Day Percent Change: -0.51% Day Change: -0.32 | |
| Week Change: 1.24% Year-to-date Change: -3.6% | |
| LKFN Links: Profile News Message Board | |
| Charts:- Daily , Weekly | |
| Add LKFN to Watchlist: View: Get Complete LKFN Trend Analysis ➞ | |
 | REFI Chicago Atlantic Financials Finance, Inc. |
| Sector: Financials | |
| SubSector: REIT - Mortgage | |
| MarketCap: 285 Millions | |
| Recent Price: 15.59 Smart Investing & Trading Score: 18 | |
| Day Percent Change: -1.39% Day Change: -0.22 | |
| Week Change: -0.89% Year-to-date Change: -3.7% | |
| REFI Links: Profile News Message Board | |
| Charts:- Daily , Weekly | |
| Add REFI to Watchlist: View: Get Complete REFI Trend Analysis ➞ | |
 | BUSE First Busey Corporation |
| Sector: Financials | |
| SubSector: Regional - Midwest Banks | |
| MarketCap: 876.97 Millions | |
| Recent Price: 23.85 Smart Investing & Trading Score: 90 | |
| Day Percent Change: 0.00% Day Change: 0.00 | |
| Week Change: 0.21% Year-to-date Change: -3.9% | |
| BUSE Links: Profile News Message Board | |
| Charts:- Daily , Weekly | |
| Add BUSE to Watchlist: View: Get Complete BUSE Trend Analysis ➞ | |
 | BRT BRT Apartments Corp. |
| Sector: Financials | |
| SubSector: Mortgage Investment | |
| MarketCap: 163.239 Millions | |
| Recent Price: 17.84 Smart Investing & Trading Score: 66 | |
| Day Percent Change: -0.56% Day Change: -0.10 | |
| Week Change: -1.27% Year-to-date Change: -4.0% | |
| BRT Links: Profile News Message Board | |
| Charts:- Daily , Weekly | |
| Add BRT to Watchlist: View: Get Complete BRT Trend Analysis ➞ | |
 | HIFS Hingham Institution for Savings |
| Sector: Financials | |
| SubSector: Savings & Loans | |
| MarketCap: 341.93 Millions | |
| Recent Price: 186.51 Smart Investing & Trading Score: 83 | |
| Day Percent Change: -0.56% Day Change: -1.05 | |
| Week Change: 2.75% Year-to-date Change: -4.1% | |
| HIFS Links: Profile News Message Board | |
| Charts:- Daily , Weekly | |
| Add HIFS to Watchlist: View: Get Complete HIFS Trend Analysis ➞ | |
 | CCBG Capital City Bank Group, Inc. |
| Sector: Financials | |
| SubSector: Regional - Mid-Atlantic Banks | |
| MarketCap: 314.459 Millions | |
| Recent Price: 28.22 Smart Investing & Trading Score: 87 | |
| Day Percent Change: 0.93% Day Change: 0.26 | |
| Week Change: 1.77% Year-to-date Change: -4.1% | |
| CCBG Links: Profile News Message Board | |
| Charts:- Daily , Weekly | |
| Add CCBG to Watchlist: View: Get Complete CCBG Trend Analysis ➞ | |
 | SRCE 1st Source Corporation |
| Sector: Financials | |
| SubSector: Regional - Midwest Banks | |
| MarketCap: 784.77 Millions | |
| Recent Price: 52.68 Smart Investing & Trading Score: 88 | |
| Day Percent Change: 0.23% Day Change: 0.12 | |
| Week Change: 0.53% Year-to-date Change: -4.1% | |
| SRCE Links: Profile News Message Board | |
| Charts:- Daily , Weekly | |
| Add SRCE to Watchlist: View: Get Complete SRCE Trend Analysis ➞ | |
 | FRME First Merchants Corporation |
| Sector: Financials | |
| SubSector: Regional - Midwest Banks | |
| MarketCap: 1490.4 Millions | |
| Recent Price: 35.54 Smart Investing & Trading Score: 76 | |
| Day Percent Change: -0.98% Day Change: -0.35 | |
| Week Change: -0.95% Year-to-date Change: -4.2% | |
| FRME Links: Profile News Message Board | |
| Charts:- Daily , Weekly | |
| Add FRME to Watchlist: View: Get Complete FRME Trend Analysis ➞ | |
| For tabular summary view of above stock list: Summary View ➞ 0 - 25 , 25 - 50 , 50 - 75 , 75 - 100 , 100 - 125 , 125 - 150 , 150 - 175 , 175 - 200 , 200 - 225 , 225 - 250 , 250 - 275 , 275 - 300 , 300 - 325 , 325 - 350 , 350 - 375 , 375 - 400 | ||
| Click To Change The Sort Order: By Market Cap or Company Size Performance: Year-to-date, Week and Day | |
| Select Chart Type: | ||
| Too many stocks? View smallcap stocks filtered by marketcap & sector |
| Marketcap: All SmallCap Stocks (default-no microcap), Large, Mid-Range, Small & MicroCap |
| Sector: Tech, Finance, Energy, Staples, Retail, Industrial, Materials, Utilities & Medical |
|
Best Stocks Today 12Stocks.com |
© 2024 12Stocks.com Terms & Conditions Privacy Contact Us
All Information Provided Only For Education And Not To Be Used For Investing or Trading. See Terms & Conditions


One More Thing ... Get Best Stocks Delivered Daily!
Never Ever Miss A Move With Our Top Ten Stocks Lists
Find Best Stocks In Any Market - Bull or Bear Market
Take A Peek At Our Top Ten Stocks Lists: Daily, Weekly, Year-to-Date & Top Trends
Find Best Stocks In Any Market - Bull or Bear Market
Take A Peek At Our Top Ten Stocks Lists: Daily, Weekly, Year-to-Date & Top Trends
Smallcap Stocks With Best Up Trends [0-bearish to 100-bullish]: Trupanion [100], Zura Bio[100], SilverBow Resources[100], Novavax [100], Third Harmonic[100], Hawkins [100], BRP Group[100], Kura Sushi[100], Aurinia [100], Heron [100], Cadiz [100]
Best Smallcap Stocks Year-to-Date:
CareMax [471.13%], Bakkt [370.4%], Janux [342.16%], Viking [304.73%], Alpine Immune[241.18%], Longboard [235.68%], Super Micro[218.16%], Avidity Biosciences[217.7%], Novavax [200%], Arcutis Bio[182.35%], Sweetgreen [181.24%] Best Smallcap Stocks This Week:
Novavax [62.16%], MacroGenics [54.68%], Maxeon Solar[49.31%], SunPower [43.04%], Harrow Health[39.31%], Workhorse Group[39.06%], Humacyte [36.6%], ProKidney [34.88%], Allbirds [33.47%], Cadiz [28.76%], Fossil Group[28.72%] Best Smallcap Stocks Daily:
Maxeon Solar[26.56%], Allakos [22.36%], Ventyx Biosciences[18.85%], Trupanion [15.85%], Zura Bio[15.61%], Beyond Air[15.42%], SilverBow Resources[13.20%], Children s[13.09%], Comtech Tele[12.92%], Aceto [12.14%], Novavax [11.63%]