
 Login Sign Up


| |||||
 |  | ||||

| 12Stocks.com Market Intelligence |
Best SmallCap Stocks
|
| In a hurry? Small Cap Stock Lists: Performance Trends Table, Stock Charts
Sort Small Cap stocks: Daily, Weekly, Year-to-Date, Market Cap & Trends. Filter Small Cap stocks list by sector: Show all, Tech, Finance, Energy, Staples, Retail, Industrial, Materials, Utilities and HealthCare Filter Small Cap stocks list by size: All Large Medium Small and MicroCap |
| 12Stocks.com Small Cap Stocks Performances & Trends Daily | |||||||||
|
|  The overall Smart Investing & Trading Score is 76 (0-bearish to 100-bullish) which puts Small Cap index in short term neutral to bullish trend. The Smart Investing & Trading Score from previous trading session is 90 and hence a deterioration of trend.
| ||||||||
Here are the Smart Investing & Trading Scores of the most requested small cap stocks at 12Stocks.com (click stock name for detailed review):
|


| 12Stocks.com: Investing in Smallcap Index with Stocks | |
|
The following table helps investors and traders sort through current performance and trends (as measured by Smart Investing & Trading Score) of various
stocks in the Smallcap Index. Quick View: Move mouse or cursor over stock symbol (ticker) to view short-term technical chart and over stock name to view long term chart. Click on  to add stock symbol to your watchlist and to add stock symbol to your watchlist and  to view watchlist. Click on any ticker or stock name for detailed market intelligence report for that stock. to view watchlist. Click on any ticker or stock name for detailed market intelligence report for that stock. |
12Stocks.com Performance of Stocks in Smallcap Index
| Ticker | Stock Name | Watchlist | Category | Recent Price | Smart Investing & Trading Score | Change % | Weekly Change% |
| PJT | PJT Partners |   | Financials | 101.22 | 52 | 1.65% | -0.04% |
| CUBI | Customers Bancorp | | Financials | 48.83 | 44 | 1.24% | -0.06% |
| OFG | OFG Bancorp | | Financials | 37.82 | 71 | -0.24% | -0.08% |
| CLDT | Chatham Lodging | | Financials | 9.02 | 22 | -0.44% | -0.11% |
| CVLY | Codorus Valley | | Financials | 22.47 | 25 | 0.31% | -0.13% |
| REFI | Chicago Atlantic | | Financials | 15.71 | 25 | 0.77% | -0.13% |
| TCI | Transcontinental Realty | | Financials | 28.30 | 23 | -0.53% | -0.18% |
| RDN | Radian Group | | Financials | 31.58 | 85 | -0.44% | -0.19% |
| GOOD | Gladstone Commercial | | Financials | 14.73 | 76 | -1.27% | -0.20% |
| PSTL | Postal Realty | | Financials | 13.73 | 28 | -0.44% | -0.22% |
| ECPG | Encore Capital | | Financials | 46.99 | 50 | 0.84% | -0.25% |
| FFBC | First Financial | | Financials | 23.66 | 83 | 0.21% | -0.25% |
| CLPR | Clipper Realty | | Financials | 4.00 | 28 | 0.50% | -0.25% |
| ASB | Associated Banc-Corp | | Financials | 22.27 | 76 | 0.41% | -0.27% |
| HOPE | Hope Bancorp | | Financials | 10.93 | 67 | 0.55% | -0.27% |
| FRME | First Merchants | | Financials | 35.78 | 90 | 0.68% | -0.28% |
| SKT | Tanger Factory | | Financials | 27.74 | 17 | -0.54% | -0.29% |
| AMBC | Ambac Financial | | Financials | 18.10 | 68 | 0.28% | -0.33% |
| SSB | South State | | Financials | 80.85 | 45 | 0.55% | -0.38% |
| NAVI | Navient | | Financials | 15.42 | 0 | -0.77% | -0.39% |
| WSR | Whitestone REIT | | Financials | 12.41 | 45 | -0.40% | -0.40% |
| ESRT | Empire State | | Financials | 9.54 | 32 | -1.45% | -0.42% |
| JOE | St. Joe | | Financials | 58.22 | 48 | -0.07% | -0.43% |
| SIGI | Selective Insurance | | Financials | 97.78 | 32 | -0.14% | -0.44% |
| GEO | GEO Group | | Financials | 13.42 | 58 | 1.44% | -0.45% |
| For chart view version of above stock list: Chart View ➞ 0 - 25 , 25 - 50 , 50 - 75 , 75 - 100 , 100 - 125 , 125 - 150 , 150 - 175 , 175 - 200 , 200 - 225 , 225 - 250 , 250 - 275 , 275 - 300 , 300 - 325 , 325 - 350 , 350 - 375 , 375 - 400 | ||
 | Click To Change The Sort Order: By Market Cap or Company Size Performance: Year-to-date, Week and Day |  |
| Too many stocks? View smallcap stocks filtered by marketcap & sector |
| Marketcap: All SmallCap Stocks (default-no microcap), Large, Mid-Range, Small |
| Smallcap Sector: Tech, Finance, Energy, Staples, Retail, Industrial, Materials, & Medical |
|
Get the most comprehensive stock market coverage daily at 12Stocks.com ➞ Best Stocks Today ➞ Best Stocks Weekly ➞ Best Stocks Year-to-Date ➞ Best Stocks Trends ➞  Best Stocks Today 12Stocks.com Best Nasdaq Stocks ➞ Best S&P 500 Stocks ➞ Best Tech Stocks ➞ Best Biotech Stocks ➞ |
| Detailed Overview of SmallCap Stocks |
| SmallCap Technical Overview, Leaders & Laggards, Top SmallCap ETF Funds & Detailed SmallCap Stocks List, Charts, Trends & More |
| Smallcap: Technical Analysis, Trends & YTD Performance | |
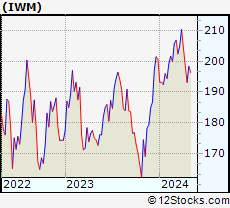
| SmallCap segment as represented by
IWM, an exchange-traded fund [ETF], holds basket of thousands of smallcap stocks from across all major sectors of the US stock market. The smallcap index (contains stocks like Riverbed & Sotheby's) is up by 3.67% and is currently underperforming the overall market by -6.9% year-to-date. Below is a quick view of technical charts and trends: | |
 IWM Weekly Chart |
|
| Long Term Trend: Very Good | |
| Medium Term Trend: Very Good | |
 IWM Daily Chart |
|
| Short Term Trend: Good | |
| Overall Trend Score: 76 | |
| YTD Performance: 3.67% | |
| **Trend Scores & Views Are Only For Educational Purposes And Not For Investing | |
| 12Stocks.com: Top Performing Small Cap Index Stocks | ||||||||||||||||||||||||||||||||||||||||||||||||
 The top performing Small Cap Index stocks year to date are
Now, more recently, over last week, the top performing Small Cap Index stocks on the move are


|
||||||||||||||||||||||||||||||||||||||||||||||||
| 12Stocks.com: Investing in Smallcap Index using Exchange Traded Funds | |
|
The following table shows list of key exchange traded funds (ETF) that
help investors track Smallcap index. The following list also includes leveraged ETF funds that track twice or thrice the daily returns of Smallcap indices. Short or inverse ETF funds move in the opposite direction to the index they track and are useful during market pullbacks or during bear markets. Quick View: Move mouse or cursor over ETF symbol (ticker) to view short-term technical chart and over ETF name to view long term chart. Click on ticker or stock name for detailed view. Click on to add stock symbol to your watchlist and to view watchlist. |
12Stocks.com List of ETFs that track Smallcap Index
| Ticker | ETF Name | Watchlist | Recent Price | Smart Investing & Trading Score | Change % | Week % | Year-to-date % |
| IWM | iShares Russell 2000 | | 208.08 | 76 | 0.07 | 1.85 | 3.67% |
| VTWO | Vanguard Russell 2000 ETF | | 84.11 | 71 | 0.00 | 1.8 | 3.71% |
| IJR | iShares Core S&P Small-Cap | | 110.39 | 68 | -0.22 | 1.29 | 1.98% |
| IWN | iShares Russell 2000 Value | | 158.71 | 76 | -0.07 | 1.61 | 2.18% |
| IWO | iShares Russell 2000 Growth | | 265.15 | 63 | -0.75 | 2.01 | 5.13% |
| IJS | iShares S&P Small-Cap 600 Value | | 101.87 | 76 | -0.15 | 1.34 | -1.16% |
| IJT | iShares S&P Small-Cap 600 Growth | | 131.34 | 71 | 0.04 | 1.14 | 4.95% |
| XSLV | PowerShares S&P SmallCap Low Volatil ETF | | 44.48 | 83 | -0.01 | 0.55 | 0.74% |
| SAA | ProShares Ultra SmallCap600 | | 24.90 | 71 | 0.50 | 2.28 | -0.18% |
| SMLV | SPDR SSGA US Small Cap Low Volatil ETF | | 113.28 | 95 | 0.43 | 1.85 | 0.68% |
| SDD | ProShares UltraShort SmallCap600 | | 17.84 | 35 | 0.96 | -2.41 | -3.19% |
| SBB | ProShares Short SmallCap600 | | 15.77 | 25 | 0.41 | -1.14 | -0.98% |
| 12Stocks.com: Charts, Trends, Fundamental Data and Performances of SmallCap Stocks | |
|
We now take in-depth look at all SmallCap stocks including charts, multi-period performances and overall trends (as measured by Smart Investing & Trading Score). One can sort SmallCap stocks (click link to choose) by Daily, Weekly and by Year-to-Date performances. Also, one can sort by size of the company or by market capitalization. |
| Select Your Default Chart Type: | |||||
| |||||
| Click on stock symbol or name for detailed view. Click on to add stock symbol to your watchlist and to view watchlist. Quick View: Move mouse or cursor over "Daily" to quickly view daily technical stock chart and over "Weekly" to view weekly technical stock chart. | |||||

 | PJT PJT Partners Inc. |
| Sector: Financials | |
| SubSector: Asset Management | |
| MarketCap: 1100.93 Millions | |
| Recent Price: 101.22 Smart Investing & Trading Score: 52 | |
| Day Percent Change: 1.65% Day Change: 1.64 | |
| Week Change: -0.04% Year-to-date Change: -0.6% | |
| PJT Links: Profile News Message Board | |
| Charts:- Daily , Weekly | |
| Add PJT to Watchlist: View: Get Complete PJT Trend Analysis ➞ | |
 | CUBI Customers Bancorp, Inc. |
| Sector: Financials | |
| SubSector: Regional - Northeast Banks | |
| MarketCap: 385.399 Millions | |
| Recent Price: 48.83 Smart Investing & Trading Score: 44 | |
| Day Percent Change: 1.24% Day Change: 0.60 | |
| Week Change: -0.06% Year-to-date Change: -15.3% | |
| CUBI Links: Profile News Message Board | |
| Charts:- Daily , Weekly | |
| Add CUBI to Watchlist: View: Get Complete CUBI Trend Analysis ➞ | |
 | OFG OFG Bancorp |
| Sector: Financials | |
| SubSector: Money Center Banks | |
| MarketCap: 537.599 Millions | |
| Recent Price: 37.82 Smart Investing & Trading Score: 71 | |
| Day Percent Change: -0.24% Day Change: -0.09 | |
| Week Change: -0.08% Year-to-date Change: 0.9% | |
| OFG Links: Profile News Message Board | |
| Charts:- Daily , Weekly | |
| Add OFG to Watchlist: View: Get Complete OFG Trend Analysis ➞ | |
 | CLDT Chatham Lodging Trust |
| Sector: Financials | |
| SubSector: REIT - Hotel/Motel | |
| MarketCap: 274.734 Millions | |
| Recent Price: 9.02 Smart Investing & Trading Score: 22 | |
| Day Percent Change: -0.44% Day Change: -0.04 | |
| Week Change: -0.11% Year-to-date Change: -15.9% | |
| CLDT Links: Profile News Message Board | |
| Charts:- Daily , Weekly | |
| Add CLDT to Watchlist: View: Get Complete CLDT Trend Analysis ➞ | |
 | CVLY Codorus Valley Bancorp, Inc. |
| Sector: Financials | |
| SubSector: Regional - Northeast Banks | |
| MarketCap: 173.799 Millions | |
| Recent Price: 22.47 Smart Investing & Trading Score: 25 | |
| Day Percent Change: 0.31% Day Change: 0.07 | |
| Week Change: -0.13% Year-to-date Change: -12.6% | |
| CVLY Links: Profile News Message Board | |
| Charts:- Daily , Weekly | |
| Add CVLY to Watchlist: View: Get Complete CVLY Trend Analysis ➞ | |
 | REFI Chicago Atlantic Financials Finance, Inc. |
| Sector: Financials | |
| SubSector: REIT - Mortgage | |
| MarketCap: 285 Millions | |
| Recent Price: 15.71 Smart Investing & Trading Score: 25 | |
| Day Percent Change: 0.77% Day Change: 0.12 | |
| Week Change: -0.13% Year-to-date Change: -3.0% | |
| REFI Links: Profile News Message Board | |
| Charts:- Daily , Weekly | |
| Add REFI to Watchlist: View: Get Complete REFI Trend Analysis ➞ | |
 | TCI Transcontinental Realty Investors, Inc. |
| Sector: Financials | |
| SubSector: REIT - Diversified | |
| MarketCap: 158.653 Millions | |
| Recent Price: 28.30 Smart Investing & Trading Score: 23 | |
| Day Percent Change: -0.53% Day Change: -0.15 | |
| Week Change: -0.18% Year-to-date Change: -18.1% | |
| TCI Links: Profile News Message Board | |
| Charts:- Daily , Weekly | |
| Add TCI to Watchlist: View: Get Complete TCI Trend Analysis ➞ | |
 | RDN Radian Group Inc. |
| Sector: Financials | |
| SubSector: Property & Casualty Insurance | |
| MarketCap: 2950.12 Millions | |
| Recent Price: 31.58 Smart Investing & Trading Score: 85 | |
| Day Percent Change: -0.44% Day Change: -0.14 | |
| Week Change: -0.19% Year-to-date Change: 10.6% | |
| RDN Links: Profile News Message Board | |
| Charts:- Daily , Weekly | |
| Add RDN to Watchlist: View: Get Complete RDN Trend Analysis ➞ | |
 | GOOD Gladstone Commercial Corporation |
| Sector: Financials | |
| SubSector: REIT - Diversified | |
| MarketCap: 425.253 Millions | |
| Recent Price: 14.73 Smart Investing & Trading Score: 76 | |
| Day Percent Change: -1.27% Day Change: -0.19 | |
| Week Change: -0.2% Year-to-date Change: 11.3% | |
| GOOD Links: Profile News Message Board | |
| Charts:- Daily , Weekly | |
| Add GOOD to Watchlist: View: Get Complete GOOD Trend Analysis ➞ | |
 | PSTL Postal Realty Trust, Inc. |
| Sector: Financials | |
| SubSector: REIT - Office | |
| MarketCap: 82.9866 Millions | |
| Recent Price: 13.73 Smart Investing & Trading Score: 28 | |
| Day Percent Change: -0.44% Day Change: -0.06 | |
| Week Change: -0.22% Year-to-date Change: -5.7% | |
| PSTL Links: Profile News Message Board | |
| Charts:- Daily , Weekly | |
| Add PSTL to Watchlist: View: Get Complete PSTL Trend Analysis ➞ | |
 | ECPG Encore Capital Group, Inc. |
| Sector: Financials | |
| SubSector: Asset Management | |
| MarketCap: 661.503 Millions | |
| Recent Price: 46.99 Smart Investing & Trading Score: 50 | |
| Day Percent Change: 0.84% Day Change: 0.39 | |
| Week Change: -0.25% Year-to-date Change: -7.4% | |
| ECPG Links: Profile News Message Board | |
| Charts:- Daily , Weekly | |
| Add ECPG to Watchlist: View: Get Complete ECPG Trend Analysis ➞ | |
 | FFBC First Financial Bancorp. |
| Sector: Financials | |
| SubSector: Regional - Midwest Banks | |
| MarketCap: 1363.7 Millions | |
| Recent Price: 23.66 Smart Investing & Trading Score: 83 | |
| Day Percent Change: 0.21% Day Change: 0.05 | |
| Week Change: -0.25% Year-to-date Change: -0.4% | |
| FFBC Links: Profile News Message Board | |
| Charts:- Daily , Weekly | |
| Add FFBC to Watchlist: View: Get Complete FFBC Trend Analysis ➞ | |
 | CLPR Clipper Realty Inc. |
| Sector: Financials | |
| SubSector: REIT - Diversified | |
| MarketCap: 113.253 Millions | |
| Recent Price: 4.00 Smart Investing & Trading Score: 28 | |
| Day Percent Change: 0.50% Day Change: 0.02 | |
| Week Change: -0.25% Year-to-date Change: -25.9% | |
| CLPR Links: Profile News Message Board | |
| Charts:- Daily , Weekly | |
| Add CLPR to Watchlist: View: Get Complete CLPR Trend Analysis ➞ | |
 | ASB Associated Banc-Corp |
| Sector: Financials | |
| SubSector: Regional - Midwest Banks | |
| MarketCap: 1904.8 Millions | |
| Recent Price: 22.27 Smart Investing & Trading Score: 76 | |
| Day Percent Change: 0.41% Day Change: 0.09 | |
| Week Change: -0.27% Year-to-date Change: 4.1% | |
| ASB Links: Profile News Message Board | |
| Charts:- Daily , Weekly | |
| Add ASB to Watchlist: View: Get Complete ASB Trend Analysis ➞ | |
 | HOPE Hope Bancorp, Inc. |
| Sector: Financials | |
| SubSector: Regional - Pacific Banks | |
| MarketCap: 1099.29 Millions | |
| Recent Price: 10.93 Smart Investing & Trading Score: 67 | |
| Day Percent Change: 0.55% Day Change: 0.06 | |
| Week Change: -0.27% Year-to-date Change: -9.5% | |
| HOPE Links: Profile News Message Board | |
| Charts:- Daily , Weekly | |
| Add HOPE to Watchlist: View: Get Complete HOPE Trend Analysis ➞ | |
 | FRME First Merchants Corporation |
| Sector: Financials | |
| SubSector: Regional - Midwest Banks | |
| MarketCap: 1490.4 Millions | |
| Recent Price: 35.78 Smart Investing & Trading Score: 90 | |
| Day Percent Change: 0.68% Day Change: 0.24 | |
| Week Change: -0.28% Year-to-date Change: -3.5% | |
| FRME Links: Profile News Message Board | |
| Charts:- Daily , Weekly | |
| Add FRME to Watchlist: View: Get Complete FRME Trend Analysis ➞ | |
 | SKT Tanger Factory Outlet Centers, Inc. |
| Sector: Financials | |
| SubSector: REIT - Retail | |
| MarketCap: 720.214 Millions | |
| Recent Price: 27.74 Smart Investing & Trading Score: 17 | |
| Day Percent Change: -0.54% Day Change: -0.15 | |
| Week Change: -0.29% Year-to-date Change: 0.1% | |
| SKT Links: Profile News Message Board | |
| Charts:- Daily , Weekly | |
| Add SKT to Watchlist: View: Get Complete SKT Trend Analysis ➞ | |
 | AMBC Ambac Financial Group, Inc. |
| Sector: Financials | |
| SubSector: Surety & Title Insurance | |
| MarketCap: 587.818 Millions | |
| Recent Price: 18.10 Smart Investing & Trading Score: 68 | |
| Day Percent Change: 0.28% Day Change: 0.05 | |
| Week Change: -0.33% Year-to-date Change: 9.8% | |
| AMBC Links: Profile News Message Board | |
| Charts:- Daily , Weekly | |
| Add AMBC to Watchlist: View: Get Complete AMBC Trend Analysis ➞ | |
 | SSB South State Corporation |
| Sector: Financials | |
| SubSector: Regional - Mid-Atlantic Banks | |
| MarketCap: 2113.49 Millions | |
| Recent Price: 80.85 Smart Investing & Trading Score: 45 | |
| Day Percent Change: 0.55% Day Change: 0.44 | |
| Week Change: -0.38% Year-to-date Change: -4.3% | |
| SSB Links: Profile News Message Board | |
| Charts:- Daily , Weekly | |
| Add SSB to Watchlist: View: Get Complete SSB Trend Analysis ➞ | |
 | NAVI Navient Corporation |
| Sector: Financials | |
| SubSector: Credit Services | |
| MarketCap: 1362.48 Millions | |
| Recent Price: 15.42 Smart Investing & Trading Score: 0 | |
| Day Percent Change: -0.77% Day Change: -0.12 | |
| Week Change: -0.39% Year-to-date Change: -17.2% | |
| NAVI Links: Profile News Message Board | |
| Charts:- Daily , Weekly | |
| Add NAVI to Watchlist: View: Get Complete NAVI Trend Analysis ➞ | |
 | WSR Whitestone REIT |
| Sector: Financials | |
| SubSector: REIT - Retail | |
| MarketCap: 316.114 Millions | |
| Recent Price: 12.41 Smart Investing & Trading Score: 45 | |
| Day Percent Change: -0.40% Day Change: -0.05 | |
| Week Change: -0.4% Year-to-date Change: 1.0% | |
| WSR Links: Profile News Message Board | |
| Charts:- Daily , Weekly | |
| Add WSR to Watchlist: View: Get Complete WSR Trend Analysis ➞ | |
 | ESRT Empire State Realty Trust, Inc. |
| Sector: Financials | |
| SubSector: REIT - Diversified | |
| MarketCap: 1632.13 Millions | |
| Recent Price: 9.54 Smart Investing & Trading Score: 32 | |
| Day Percent Change: -1.45% Day Change: -0.14 | |
| Week Change: -0.42% Year-to-date Change: -1.6% | |
| ESRT Links: Profile News Message Board | |
| Charts:- Daily , Weekly | |
| Add ESRT to Watchlist: View: Get Complete ESRT Trend Analysis ➞ | |
 | JOE The St. Joe Company |
| Sector: Financials | |
| SubSector: Real Estate Development | |
| MarketCap: 1029.39 Millions | |
| Recent Price: 58.22 Smart Investing & Trading Score: 48 | |
| Day Percent Change: -0.07% Day Change: -0.04 | |
| Week Change: -0.43% Year-to-date Change: -3.3% | |
| JOE Links: Profile News Message Board | |
| Charts:- Daily , Weekly | |
| Add JOE to Watchlist: View: Get Complete JOE Trend Analysis ➞ | |
 | SIGI Selective Insurance Group, Inc. |
| Sector: Financials | |
| SubSector: Property & Casualty Insurance | |
| MarketCap: 3039.12 Millions | |
| Recent Price: 97.78 Smart Investing & Trading Score: 32 | |
| Day Percent Change: -0.14% Day Change: -0.14 | |
| Week Change: -0.44% Year-to-date Change: -1.7% | |
| SIGI Links: Profile News Message Board | |
| Charts:- Daily , Weekly | |
| Add SIGI to Watchlist: View: Get Complete SIGI Trend Analysis ➞ | |
 | GEO The GEO Group, Inc. |
| Sector: Financials | |
| SubSector: REIT - Healthcare Facilities | |
| MarketCap: 1678.34 Millions | |
| Recent Price: 13.42 Smart Investing & Trading Score: 58 | |
| Day Percent Change: 1.44% Day Change: 0.19 | |
| Week Change: -0.45% Year-to-date Change: 23.9% | |
| GEO Links: Profile News Message Board | |
| Charts:- Daily , Weekly | |
| Add GEO to Watchlist: View: Get Complete GEO Trend Analysis ➞ | |
| For tabular summary view of above stock list: Summary View ➞ 0 - 25 , 25 - 50 , 50 - 75 , 75 - 100 , 100 - 125 , 125 - 150 , 150 - 175 , 175 - 200 , 200 - 225 , 225 - 250 , 250 - 275 , 275 - 300 , 300 - 325 , 325 - 350 , 350 - 375 , 375 - 400 | ||
| Click To Change The Sort Order: By Market Cap or Company Size Performance: Year-to-date, Week and Day | |
| Select Chart Type: | ||
| Too many stocks? View smallcap stocks filtered by marketcap & sector |
| Marketcap: All SmallCap Stocks (default-no microcap), Large, Mid-Range, Small & MicroCap |
| Sector: Tech, Finance, Energy, Staples, Retail, Industrial, Materials, Utilities & Medical |
|
Best Stocks Today 12Stocks.com |
© 2024 12Stocks.com Terms & Conditions Privacy Contact Us
All Information Provided Only For Education And Not To Be Used For Investing or Trading. See Terms & Conditions


One More Thing ... Get Best Stocks Delivered Daily!
Never Ever Miss A Move With Our Top Ten Stocks Lists
Find Best Stocks In Any Market - Bull or Bear Market
Take A Peek At Our Top Ten Stocks Lists: Daily, Weekly, Year-to-Date & Top Trends
Find Best Stocks In Any Market - Bull or Bear Market
Take A Peek At Our Top Ten Stocks Lists: Daily, Weekly, Year-to-Date & Top Trends
Smallcap Stocks With Best Up Trends [0-bearish to 100-bullish]: CommScope Holding[100], Coeur Mining[100], Hecla Mining[100], MicroStrategy [100], Enovix [100], Rayonier Advanced[100], Nurix [100], Energy Fuels[100], NovaGold Resources[100], Piedmont Lithium[100], Wave Life[100]
Best Smallcap Stocks Year-to-Date:
CareMax [495.88%], Bakkt [413.9%], Janux [338.34%], Viking [260.02%], Alpine Immune[241.23%], Longboard [238.63%], Avidity Biosciences[226.33%], Super Micro[212.35%], Arcutis Bio[184.83%], Sweetgreen [180.97%], Novavax [171.04%] Best Smallcap Stocks This Week:
Vaxxinity [58.82%], Novavax [46.51%], Vicarious Surgical[45.62%], Harrow Health[44.48%], ProKidney [44.31%], Workhorse Group[36.06%], Maxeon Solar[35.94%], Fossil Group[35.44%], Humacyte [34.68%], MicroStrategy [34.23%], Cadiz [33.48%] Best Smallcap Stocks Daily:
Vaxxinity [45.95%], Presto Automation[31.90%], Vicarious Surgical[27.93%], Orchestra BioMed[12.77%], CommScope Holding[11.86%], Coeur Mining[11.57%], Hecla Mining[11.11%], MicroStrategy [10.04%], Tenaya [9.65%], Bakkt [9.25%], Enovix [9.25%]