
 Login Sign Up


| |||||
 |  | ||||

| 12Stocks.com Market Intelligence |
Best SmallCap Stocks
|
| In a hurry? Small Cap Stock Lists: Performance Trends Table, Stock Charts
Sort Small Cap stocks: Daily, Weekly, Year-to-Date, Market Cap & Trends. Filter Small Cap stocks list by sector: Show all, Tech, Finance, Energy, Staples, Retail, Industrial, Materials, Utilities and HealthCare Filter Small Cap stocks list by size: All Large Medium Small and MicroCap |
| 12Stocks.com Small Cap Stocks Performances & Trends Daily | |||||||||
|
|  The overall Smart Investing & Trading Score is 76 (0-bearish to 100-bullish) which puts Small Cap index in short term neutral to bullish trend. The Smart Investing & Trading Score from previous trading session is 90 and hence a deterioration of trend.
| ||||||||
Here are the Smart Investing & Trading Scores of the most requested small cap stocks at 12Stocks.com (click stock name for detailed review):
|


| 12Stocks.com: Investing in Smallcap Index with Stocks | |
|
The following table helps investors and traders sort through current performance and trends (as measured by Smart Investing & Trading Score) of various
stocks in the Smallcap Index. Quick View: Move mouse or cursor over stock symbol (ticker) to view short-term technical chart and over stock name to view long term chart. Click on  to add stock symbol to your watchlist and to add stock symbol to your watchlist and  to view watchlist. Click on any ticker or stock name for detailed market intelligence report for that stock. to view watchlist. Click on any ticker or stock name for detailed market intelligence report for that stock. |
12Stocks.com Performance of Stocks in Smallcap Index
| Ticker | Stock Name | Watchlist | Category | Recent Price | Smart Investing & Trading Score | Change % | Weekly Change% |
| KW | Kennedy-Wilson |   | Financials | 10.40 | 68 | -0.67% | 2.46% |
| BWFG | Bankwell Financial | | Financials | 24.32 | 64 | 1.67% | 2.44% |
| WSBC | WesBanco | | Financials | 29.11 | 87 | 1.15% | 2.43% |
| FCPT | Four Corners | | Financials | 25.05 | 76 | 0.20% | 2.43% |
| OSBC | Old Second | | Financials | 14.92 | 100 | 0.81% | 2.40% |
| UE | Urban Edge | | Financials | 17.57 | 90 | 0.92% | 2.39% |
| EFSC | Enterprise Financial | | Financials | 40.90 | 100 | 0.71% | 2.38% |
| NWBI | Northwest Bancshares | | Financials | 11.40 | 82 | 0.62% | 2.33% |
| PPBI | Pacific Premier | | Financials | 23.82 | 100 | 1.49% | 2.32% |
| BY | Byline Bancorp | | Financials | 23.99 | 90 | 0.84% | 2.30% |
| OCFC | OceanFirst Financial | | Financials | 16.08 | 95 | 0.44% | 2.29% |
| PRK | Park National | | Financials | 142.47 | 95 | 0.52% | 2.28% |
| CNO | CNO Financial | | Financials | 28.90 | 95 | 0.31% | 2.26% |
| CCNE | CNB Financial | | Financials | 20.53 | 95 | 0.39% | 2.24% |
| INDB | Independent Bank | | Financials | 52.95 | 85 | 0.47% | 2.22% |
| STC | Stewart Information | | Financials | 64.65 | 95 | 0.40% | 2.20% |
| FLIC | First of Long Island | | Financials | 10.71 | 74 | 0.75% | 2.19% |
| NXRT | NexPoint Residential | | Financials | 36.51 | 83 | 0.41% | 2.13% |
| BDN | Brandywine Realty | | Financials | 4.81 | 68 | -1.64% | 2.12% |
| TCBK | TriCo Bancshares | | Financials | 38.74 | 90 | 0.75% | 2.11% |
| EFC | Ellington Financial | | Financials | 12.15 | 95 | 0.50% | 2.10% |
| SMBK | SmartFinancial | | Financials | 23.00 | 90 | 0.48% | 2.09% |
| JBGS | JBG SMITH | | Financials | 14.80 | 37 | -0.80% | 2.07% |
| LTC | LTC Properties | | Financials | 34.76 | 83 | 0.35% | 2.06% |
| FSBW | FS Bancorp | | Financials | 33.36 | 53 | -0.76% | 2.05% |
| For chart view version of above stock list: Chart View ➞ 0 - 25 , 25 - 50 , 50 - 75 , 75 - 100 , 100 - 125 , 125 - 150 , 150 - 175 , 175 - 200 , 200 - 225 , 225 - 250 , 250 - 275 , 275 - 300 , 300 - 325 , 325 - 350 , 350 - 375 , 375 - 400 | ||
 | Click To Change The Sort Order: By Market Cap or Company Size Performance: Year-to-date, Week and Day |  |
| Too many stocks? View smallcap stocks filtered by marketcap & sector |
| Marketcap: All SmallCap Stocks (default-no microcap), Large, Mid-Range, Small |
| Smallcap Sector: Tech, Finance, Energy, Staples, Retail, Industrial, Materials, & Medical |
|
Get the most comprehensive stock market coverage daily at 12Stocks.com ➞ Best Stocks Today ➞ Best Stocks Weekly ➞ Best Stocks Year-to-Date ➞ Best Stocks Trends ➞  Best Stocks Today 12Stocks.com Best Nasdaq Stocks ➞ Best S&P 500 Stocks ➞ Best Tech Stocks ➞ Best Biotech Stocks ➞ |
| Detailed Overview of SmallCap Stocks |
| SmallCap Technical Overview, Leaders & Laggards, Top SmallCap ETF Funds & Detailed SmallCap Stocks List, Charts, Trends & More |
| Smallcap: Technical Analysis, Trends & YTD Performance | |
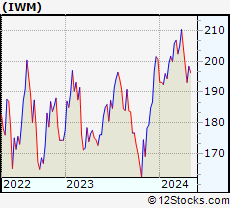
| SmallCap segment as represented by
IWM, an exchange-traded fund [ETF], holds basket of thousands of smallcap stocks from across all major sectors of the US stock market. The smallcap index (contains stocks like Riverbed & Sotheby's) is up by 3.67% and is currently underperforming the overall market by -6.9% year-to-date. Below is a quick view of technical charts and trends: | |
 IWM Weekly Chart |
|
| Long Term Trend: Very Good | |
| Medium Term Trend: Very Good | |
 IWM Daily Chart |
|
| Short Term Trend: Good | |
| Overall Trend Score: 76 | |
| YTD Performance: 3.67% | |
| **Trend Scores & Views Are Only For Educational Purposes And Not For Investing | |
| 12Stocks.com: Top Performing Small Cap Index Stocks | ||||||||||||||||||||||||||||||||||||||||||||||||
 The top performing Small Cap Index stocks year to date are
Now, more recently, over last week, the top performing Small Cap Index stocks on the move are


|
||||||||||||||||||||||||||||||||||||||||||||||||
| 12Stocks.com: Investing in Smallcap Index using Exchange Traded Funds | |
|
The following table shows list of key exchange traded funds (ETF) that
help investors track Smallcap index. The following list also includes leveraged ETF funds that track twice or thrice the daily returns of Smallcap indices. Short or inverse ETF funds move in the opposite direction to the index they track and are useful during market pullbacks or during bear markets. Quick View: Move mouse or cursor over ETF symbol (ticker) to view short-term technical chart and over ETF name to view long term chart. Click on ticker or stock name for detailed view. Click on to add stock symbol to your watchlist and to view watchlist. |
12Stocks.com List of ETFs that track Smallcap Index
| Ticker | ETF Name | Watchlist | Recent Price | Smart Investing & Trading Score | Change % | Week % | Year-to-date % |
| IWM | iShares Russell 2000 | | 208.08 | 76 | 0.07 | 1.85 | 3.67% |
| VTWO | Vanguard Russell 2000 ETF | | 84.11 | 71 | 0.00 | 1.8 | 3.71% |
| IJR | iShares Core S&P Small-Cap | | 110.39 | 68 | -0.22 | 1.29 | 1.98% |
| IWN | iShares Russell 2000 Value | | 158.71 | 76 | -0.07 | 1.61 | 2.18% |
| IWO | iShares Russell 2000 Growth | | 265.15 | 63 | -0.75 | 2.01 | 5.13% |
| IJS | iShares S&P Small-Cap 600 Value | | 101.87 | 76 | -0.15 | 1.34 | -1.16% |
| IJT | iShares S&P Small-Cap 600 Growth | | 131.34 | 71 | 0.04 | 1.14 | 4.95% |
| XSLV | PowerShares S&P SmallCap Low Volatil ETF | | 44.48 | 83 | -0.01 | 0.55 | 0.74% |
| SAA | ProShares Ultra SmallCap600 | | 24.90 | 71 | 0.50 | 2.28 | -0.18% |
| SMLV | SPDR SSGA US Small Cap Low Volatil ETF | | 113.28 | 95 | 0.43 | 1.85 | 0.68% |
| SDD | ProShares UltraShort SmallCap600 | | 17.84 | 35 | 0.96 | -2.41 | -3.19% |
| SBB | ProShares Short SmallCap600 | | 15.77 | 25 | 0.41 | -1.14 | -0.98% |
| 12Stocks.com: Charts, Trends, Fundamental Data and Performances of SmallCap Stocks | |
|
We now take in-depth look at all SmallCap stocks including charts, multi-period performances and overall trends (as measured by Smart Investing & Trading Score). One can sort SmallCap stocks (click link to choose) by Daily, Weekly and by Year-to-Date performances. Also, one can sort by size of the company or by market capitalization. |
| Select Your Default Chart Type: | |||||
| |||||
| Click on stock symbol or name for detailed view. Click on to add stock symbol to your watchlist and to view watchlist. Quick View: Move mouse or cursor over "Daily" to quickly view daily technical stock chart and over "Weekly" to view weekly technical stock chart. | |||||

 | KW Kennedy-Wilson Holdings, Inc. |
| Sector: Financials | |
| SubSector: Property Management | |
| MarketCap: 2025.42 Millions | |
| Recent Price: 10.40 Smart Investing & Trading Score: 68 | |
| Day Percent Change: -0.67% Day Change: -0.07 | |
| Week Change: 2.46% Year-to-date Change: -16.0% | |
| KW Links: Profile News Message Board | |
| Charts:- Daily , Weekly | |
| Add KW to Watchlist: View: Get Complete KW Trend Analysis ➞ | |
 | BWFG Bankwell Financial Group, Inc. |
| Sector: Financials | |
| SubSector: Regional - Northeast Banks | |
| MarketCap: 142.899 Millions | |
| Recent Price: 24.32 Smart Investing & Trading Score: 64 | |
| Day Percent Change: 1.67% Day Change: 0.40 | |
| Week Change: 2.44% Year-to-date Change: -19.4% | |
| BWFG Links: Profile News Message Board | |
| Charts:- Daily , Weekly | |
| Add BWFG to Watchlist: View: Get Complete BWFG Trend Analysis ➞ | |
 | WSBC WesBanco, Inc. |
| Sector: Financials | |
| SubSector: Regional - Mid-Atlantic Banks | |
| MarketCap: 1575.79 Millions | |
| Recent Price: 29.11 Smart Investing & Trading Score: 87 | |
| Day Percent Change: 1.15% Day Change: 0.33 | |
| Week Change: 2.43% Year-to-date Change: -7.2% | |
| WSBC Links: Profile News Message Board | |
| Charts:- Daily , Weekly | |
| Add WSBC to Watchlist: View: Get Complete WSBC Trend Analysis ➞ | |
 | FCPT Four Corners Property Trust, Inc. |
| Sector: Financials | |
| SubSector: REIT - Hotel/Motel | |
| MarketCap: 1218.94 Millions | |
| Recent Price: 25.05 Smart Investing & Trading Score: 76 | |
| Day Percent Change: 0.20% Day Change: 0.05 | |
| Week Change: 2.43% Year-to-date Change: -1.0% | |
| FCPT Links: Profile News Message Board | |
| Charts:- Daily , Weekly | |
| Add FCPT to Watchlist: View: Get Complete FCPT Trend Analysis ➞ | |
 | OSBC Old Second Bancorp, Inc. |
| Sector: Financials | |
| SubSector: Regional - Midwest Banks | |
| MarketCap: 237.17 Millions | |
| Recent Price: 14.92 Smart Investing & Trading Score: 100 | |
| Day Percent Change: 0.81% Day Change: 0.12 | |
| Week Change: 2.4% Year-to-date Change: -3.4% | |
| OSBC Links: Profile News Message Board | |
| Charts:- Daily , Weekly | |
| Add OSBC to Watchlist: View: Get Complete OSBC Trend Analysis ➞ | |
 | UE Urban Edge Properties |
| Sector: Financials | |
| SubSector: REIT - Diversified | |
| MarketCap: 1112.33 Millions | |
| Recent Price: 17.57 Smart Investing & Trading Score: 90 | |
| Day Percent Change: 0.92% Day Change: 0.16 | |
| Week Change: 2.39% Year-to-date Change: -4.0% | |
| UE Links: Profile News Message Board | |
| Charts:- Daily , Weekly | |
| Add UE to Watchlist: View: Get Complete UE Trend Analysis ➞ | |
 | EFSC Enterprise Financial Services Corp |
| Sector: Financials | |
| SubSector: Regional - Southwest Banks | |
| MarketCap: 770.165 Millions | |
| Recent Price: 40.90 Smart Investing & Trading Score: 100 | |
| Day Percent Change: 0.71% Day Change: 0.29 | |
| Week Change: 2.38% Year-to-date Change: -8.4% | |
| EFSC Links: Profile News Message Board | |
| Charts:- Daily , Weekly | |
| Add EFSC to Watchlist: View: Get Complete EFSC Trend Analysis ➞ | |
 | NWBI Northwest Bancshares, Inc. |
| Sector: Financials | |
| SubSector: Savings & Loans | |
| MarketCap: 1266.3 Millions | |
| Recent Price: 11.40 Smart Investing & Trading Score: 82 | |
| Day Percent Change: 0.62% Day Change: 0.07 | |
| Week Change: 2.33% Year-to-date Change: -8.7% | |
| NWBI Links: Profile News Message Board | |
| Charts:- Daily , Weekly | |
| Add NWBI to Watchlist: View: Get Complete NWBI Trend Analysis ➞ | |
 | PPBI Pacific Premier Bancorp, Inc. |
| Sector: Financials | |
| SubSector: Regional - Pacific Banks | |
| MarketCap: 978.029 Millions | |
| Recent Price: 23.82 Smart Investing & Trading Score: 100 | |
| Day Percent Change: 1.49% Day Change: 0.35 | |
| Week Change: 2.32% Year-to-date Change: -18.2% | |
| PPBI Links: Profile News Message Board | |
| Charts:- Daily , Weekly | |
| Add PPBI to Watchlist: View: Get Complete PPBI Trend Analysis ➞ | |
 | BY Byline Bancorp, Inc. |
| Sector: Financials | |
| SubSector: Regional - Midwest Banks | |
| MarketCap: 381.87 Millions | |
| Recent Price: 23.99 Smart Investing & Trading Score: 90 | |
| Day Percent Change: 0.84% Day Change: 0.20 | |
| Week Change: 2.3% Year-to-date Change: 1.8% | |
| BY Links: Profile News Message Board | |
| Charts:- Daily , Weekly | |
| Add BY to Watchlist: View: Get Complete BY Trend Analysis ➞ | |
 | OCFC OceanFirst Financial Corp. |
| Sector: Financials | |
| SubSector: Savings & Loans | |
| MarketCap: 867.43 Millions | |
| Recent Price: 16.08 Smart Investing & Trading Score: 95 | |
| Day Percent Change: 0.44% Day Change: 0.07 | |
| Week Change: 2.29% Year-to-date Change: -7.4% | |
| OCFC Links: Profile News Message Board | |
| Charts:- Daily , Weekly | |
| Add OCFC to Watchlist: View: Get Complete OCFC Trend Analysis ➞ | |
 | PRK Park National Corporation |
| Sector: Financials | |
| SubSector: Regional - Midwest Banks | |
| MarketCap: 1416.6 Millions | |
| Recent Price: 142.47 Smart Investing & Trading Score: 95 | |
| Day Percent Change: 0.52% Day Change: 0.74 | |
| Week Change: 2.28% Year-to-date Change: 7.2% | |
| PRK Links: Profile News Message Board | |
| Charts:- Daily , Weekly | |
| Add PRK to Watchlist: View: Get Complete PRK Trend Analysis ➞ | |
 | CNO CNO Financial Group, Inc. |
| Sector: Financials | |
| SubSector: Accident & Health Insurance | |
| MarketCap: 1746.9 Millions | |
| Recent Price: 28.90 Smart Investing & Trading Score: 95 | |
| Day Percent Change: 0.31% Day Change: 0.09 | |
| Week Change: 2.26% Year-to-date Change: 3.6% | |
| CNO Links: Profile News Message Board | |
| Charts:- Daily , Weekly | |
| Add CNO to Watchlist: View: Get Complete CNO Trend Analysis ➞ | |
 | CCNE CNB Financial Corporation |
| Sector: Financials | |
| SubSector: Regional - Northeast Banks | |
| MarketCap: 286.599 Millions | |
| Recent Price: 20.53 Smart Investing & Trading Score: 95 | |
| Day Percent Change: 0.39% Day Change: 0.08 | |
| Week Change: 2.24% Year-to-date Change: -9.1% | |
| CCNE Links: Profile News Message Board | |
| Charts:- Daily , Weekly | |
| Add CCNE to Watchlist: View: Get Complete CCNE Trend Analysis ➞ | |
 | INDB Independent Bank Corp. |
| Sector: Financials | |
| SubSector: Regional - Northeast Banks | |
| MarketCap: 2347.09 Millions | |
| Recent Price: 52.95 Smart Investing & Trading Score: 85 | |
| Day Percent Change: 0.47% Day Change: 0.25 | |
| Week Change: 2.22% Year-to-date Change: -19.5% | |
| INDB Links: Profile News Message Board | |
| Charts:- Daily , Weekly | |
| Add INDB to Watchlist: View: Get Complete INDB Trend Analysis ➞ | |
 | STC Stewart Information Services Corporation |
| Sector: Financials | |
| SubSector: Property & Casualty Insurance | |
| MarketCap: 629.912 Millions | |
| Recent Price: 64.65 Smart Investing & Trading Score: 95 | |
| Day Percent Change: 0.40% Day Change: 0.26 | |
| Week Change: 2.2% Year-to-date Change: 10.0% | |
| STC Links: Profile News Message Board | |
| Charts:- Daily , Weekly | |
| Add STC to Watchlist: View: Get Complete STC Trend Analysis ➞ | |
 | FLIC The First of Long Island Corporation |
| Sector: Financials | |
| SubSector: Regional - Northeast Banks | |
| MarketCap: 352.899 Millions | |
| Recent Price: 10.71 Smart Investing & Trading Score: 74 | |
| Day Percent Change: 0.75% Day Change: 0.08 | |
| Week Change: 2.19% Year-to-date Change: -19.1% | |
| FLIC Links: Profile News Message Board | |
| Charts:- Daily , Weekly | |
| Add FLIC to Watchlist: View: Get Complete FLIC Trend Analysis ➞ | |
 | NXRT NexPoint Residential Trust, Inc. |
| Sector: Financials | |
| SubSector: REIT - Residential | |
| MarketCap: 839.161 Millions | |
| Recent Price: 36.51 Smart Investing & Trading Score: 83 | |
| Day Percent Change: 0.41% Day Change: 0.15 | |
| Week Change: 2.13% Year-to-date Change: 6.0% | |
| NXRT Links: Profile News Message Board | |
| Charts:- Daily , Weekly | |
| Add NXRT to Watchlist: View: Get Complete NXRT Trend Analysis ➞ | |
 | BDN Brandywine Realty Trust |
| Sector: Financials | |
| SubSector: REIT - Diversified | |
| MarketCap: 1688.13 Millions | |
| Recent Price: 4.81 Smart Investing & Trading Score: 68 | |
| Day Percent Change: -1.64% Day Change: -0.08 | |
| Week Change: 2.12% Year-to-date Change: -10.9% | |
| BDN Links: Profile News Message Board | |
| Charts:- Daily , Weekly | |
| Add BDN to Watchlist: View: Get Complete BDN Trend Analysis ➞ | |
 | TCBK TriCo Bancshares |
| Sector: Financials | |
| SubSector: Regional - Pacific Banks | |
| MarketCap: 875.129 Millions | |
| Recent Price: 38.74 Smart Investing & Trading Score: 90 | |
| Day Percent Change: 0.75% Day Change: 0.29 | |
| Week Change: 2.11% Year-to-date Change: -9.8% | |
| TCBK Links: Profile News Message Board | |
| Charts:- Daily , Weekly | |
| Add TCBK to Watchlist: View: Get Complete TCBK Trend Analysis ➞ | |
 | EFC Ellington Financial Inc. |
| Sector: Financials | |
| SubSector: Mortgage Investment | |
| MarketCap: 380.239 Millions | |
| Recent Price: 12.15 Smart Investing & Trading Score: 95 | |
| Day Percent Change: 0.50% Day Change: 0.06 | |
| Week Change: 2.1% Year-to-date Change: -4.4% | |
| EFC Links: Profile News Message Board | |
| Charts:- Daily , Weekly | |
| Add EFC to Watchlist: View: Get Complete EFC Trend Analysis ➞ | |
 | SMBK SmartFinancial, Inc. |
| Sector: Financials | |
| SubSector: Regional - Southeast Banks | |
| MarketCap: 174.035 Millions | |
| Recent Price: 23.00 Smart Investing & Trading Score: 90 | |
| Day Percent Change: 0.48% Day Change: 0.11 | |
| Week Change: 2.09% Year-to-date Change: -6.1% | |
| SMBK Links: Profile News Message Board | |
| Charts:- Daily , Weekly | |
| Add SMBK to Watchlist: View: Get Complete SMBK Trend Analysis ➞ | |
 | JBGS JBG SMITH Properties |
| Sector: Financials | |
| SubSector: Property Management | |
| MarketCap: 4335.32 Millions | |
| Recent Price: 14.80 Smart Investing & Trading Score: 37 | |
| Day Percent Change: -0.80% Day Change: -0.12 | |
| Week Change: 2.07% Year-to-date Change: -13.0% | |
| JBGS Links: Profile News Message Board | |
| Charts:- Daily , Weekly | |
| Add JBGS to Watchlist: View: Get Complete JBGS Trend Analysis ➞ | |
 | LTC LTC Properties, Inc. |
| Sector: Financials | |
| SubSector: REIT - Healthcare Facilities | |
| MarketCap: 1369.24 Millions | |
| Recent Price: 34.76 Smart Investing & Trading Score: 83 | |
| Day Percent Change: 0.35% Day Change: 0.12 | |
| Week Change: 2.06% Year-to-date Change: 8.2% | |
| LTC Links: Profile News Message Board | |
| Charts:- Daily , Weekly | |
| Add LTC to Watchlist: View: Get Complete LTC Trend Analysis ➞ | |
 | FSBW FS Bancorp, Inc. |
| Sector: Financials | |
| SubSector: Regional - Pacific Banks | |
| MarketCap: 140.429 Millions | |
| Recent Price: 33.36 Smart Investing & Trading Score: 53 | |
| Day Percent Change: -0.76% Day Change: -0.26 | |
| Week Change: 2.05% Year-to-date Change: -9.7% | |
| FSBW Links: Profile News Message Board | |
| Charts:- Daily , Weekly | |
| Add FSBW to Watchlist: View: Get Complete FSBW Trend Analysis ➞ | |
| For tabular summary view of above stock list: Summary View ➞ 0 - 25 , 25 - 50 , 50 - 75 , 75 - 100 , 100 - 125 , 125 - 150 , 150 - 175 , 175 - 200 , 200 - 225 , 225 - 250 , 250 - 275 , 275 - 300 , 300 - 325 , 325 - 350 , 350 - 375 , 375 - 400 | ||
| Click To Change The Sort Order: By Market Cap or Company Size Performance: Year-to-date, Week and Day | |
| Select Chart Type: | ||
| Too many stocks? View smallcap stocks filtered by marketcap & sector |
| Marketcap: All SmallCap Stocks (default-no microcap), Large, Mid-Range, Small & MicroCap |
| Sector: Tech, Finance, Energy, Staples, Retail, Industrial, Materials, Utilities & Medical |
|
Best Stocks Today 12Stocks.com |
© 2024 12Stocks.com Terms & Conditions Privacy Contact Us
All Information Provided Only For Education And Not To Be Used For Investing or Trading. See Terms & Conditions


One More Thing ... Get Best Stocks Delivered Daily!
Never Ever Miss A Move With Our Top Ten Stocks Lists
Find Best Stocks In Any Market - Bull or Bear Market
Take A Peek At Our Top Ten Stocks Lists: Daily, Weekly, Year-to-Date & Top Trends
Find Best Stocks In Any Market - Bull or Bear Market
Take A Peek At Our Top Ten Stocks Lists: Daily, Weekly, Year-to-Date & Top Trends
Smallcap Stocks With Best Up Trends [0-bearish to 100-bullish]: CommScope Holding[100], Coeur Mining[100], Hecla Mining[100], MicroStrategy [100], Enovix [100], Rayonier Advanced[100], Nurix [100], Energy Fuels[100], NovaGold Resources[100], Piedmont Lithium[100], Wave Life[100]
Best Smallcap Stocks Year-to-Date:
CareMax [495.88%], Bakkt [413.9%], Janux [338.34%], Viking [260.02%], Alpine Immune[241.23%], Longboard [238.63%], Avidity Biosciences[226.33%], Super Micro[212.35%], Arcutis Bio[184.83%], Sweetgreen [180.97%], Novavax [171.04%] Best Smallcap Stocks This Week:
Vaxxinity [58.82%], Novavax [46.51%], Vicarious Surgical[45.62%], Harrow Health[44.48%], ProKidney [44.31%], Workhorse Group[36.06%], Maxeon Solar[35.94%], Fossil Group[35.44%], Humacyte [34.68%], MicroStrategy [34.23%], Cadiz [33.48%] Best Smallcap Stocks Daily:
Vaxxinity [45.95%], Presto Automation[31.90%], Vicarious Surgical[27.93%], Orchestra BioMed[12.77%], CommScope Holding[11.86%], Coeur Mining[11.57%], Hecla Mining[11.11%], MicroStrategy [10.04%], Tenaya [9.65%], Bakkt [9.25%], Enovix [9.25%]