
 Login Sign Up


| |||||
 |  | ||||

| 12Stocks.com Market Intelligence |
Best SmallCap Stocks
|
| In a hurry? Small Cap Stock Lists: Performance Trends Table, Stock Charts
Sort Small Cap stocks: Daily, Weekly, Year-to-Date, Market Cap & Trends. Filter Small Cap stocks list by sector: Show all, Tech, Finance, Energy, Staples, Retail, Industrial, Materials, Utilities and HealthCare Filter Small Cap stocks list by size: All Large Medium Small and MicroCap |
| 12Stocks.com Small Cap Stocks Performances & Trends Daily | |||||||||
|
|  The overall Smart Investing & Trading Score is 49 (0-bearish to 100-bullish) which puts Small Cap index in short term neutral trend. The Smart Investing & Trading Score from previous trading session is 14 and hence an improvement of trend.
| ||||||||
Here are the Smart Investing & Trading Scores of the most requested small cap stocks at 12Stocks.com (click stock name for detailed review):
|


| 12Stocks.com: Investing in Smallcap Index with Stocks | |
|
The following table helps investors and traders sort through current performance and trends (as measured by Smart Investing & Trading Score) of various
stocks in the Smallcap Index. Quick View: Move mouse or cursor over stock symbol (ticker) to view short-term technical chart and over stock name to view long term chart. Click on  to add stock symbol to your watchlist and to add stock symbol to your watchlist and  to view watchlist. Click on any ticker or stock name for detailed market intelligence report for that stock. to view watchlist. Click on any ticker or stock name for detailed market intelligence report for that stock. |
12Stocks.com Performance of Stocks in Smallcap Index
| Ticker | Stock Name | Watchlist | Category | Recent Price | Smart Investing & Trading Score | Change % | YTD Change% |
| SBRA | Sabra Health |   | Financials | 14.23 | 83 | 2.15% | -0.28% |
| EQC | Equity Commonwealth | | Financials | 19.15 | 100 | 2.22% | -0.29% |
| BRT | BRT Apartments | | Financials | 18.46 | 95 | 0.76% | -0.70% |
| NBN | Northeast Bank | | Financials | 54.74 | 90 | 3.25% | -0.81% |
| PFSI | PennyMac Financial | | Financials | 87.42 | 44 | 1.40% | -1.08% |
| OFG | OFG Bancorp | | Financials | 37.02 | 85 | 0.87% | -1.23% |
| GABC | German American | | Financials | 32.00 | 68 | 0.99% | -1.28% |
| AFCG | AFC Gamma | | Financials | 11.88 | 63 | -0.54% | -1.41% |
| CTBI | Community Trust | | Financials | 43.20 | 93 | 1.15% | -1.50% |
| CASH | Meta Financial | | Financials | 52.11 | 45 | 3.09% | -1.55% |
| FCPT | Four Corners | | Financials | 24.89 | 87 | 5.65% | -1.62% |
| QCRH | QCR | | Financials | 57.44 | 70 | 1.86% | -1.63% |
| UMBF | UMB Financial | | Financials | 82.13 | 65 | 2.90% | -1.71% |
| CNO | CNO Financial | | Financials | 27.42 | 90 | 2.66% | -1.72% |
| HTBI | HomeTrust Bancshares | | Financials | 26.45 | 67 | 1.52% | -1.73% |
| TRC | Tejon Ranch | | Financials | 16.90 | 68 | 0.42% | -1.74% |
| FOR | Forestar Group | | Financials | 32.37 | 39 | 3.80% | -2.13% |
| REFI | Chicago Atlantic | | Financials | 15.80 | 52 | -0.22% | -2.41% |
| WSFS | WSFS Financial | | Financials | 44.81 | 93 | 2.35% | -2.44% |
| FFBC | First Financial | | Financials | 23.17 | 100 | 2.12% | -2.44% |
| ARR | ARMOUR Residential | | Financials | 18.76 | 64 | 0.70% | -2.90% |
| USCB | USCB Financial | | Financials | 11.92 | 100 | 1.97% | -2.93% |
| HWC | Hancock Whitney | | Financials | 47.16 | 95 | 1.77% | -2.94% |
| CADE | Cadence Ban | | Financials | 28.71 | 88 | 1.70% | -2.97% |
| BY | Byline Bancorp | | Financials | 22.83 | 100 | 2.01% | -3.10% |
| For chart view version of above stock list: Chart View ➞ 0 - 25 , 25 - 50 , 50 - 75 , 75 - 100 , 100 - 125 , 125 - 150 , 150 - 175 , 175 - 200 , 200 - 225 , 225 - 250 , 250 - 275 , 275 - 300 , 300 - 325 , 325 - 350 , 350 - 375 , 375 - 400 | ||
 | Click To Change The Sort Order: By Market Cap or Company Size Performance: Year-to-date, Week and Day |  |
| Too many stocks? View smallcap stocks filtered by marketcap & sector |
| Marketcap: All SmallCap Stocks (default-no microcap), Large, Mid-Range, Small |
| Smallcap Sector: Tech, Finance, Energy, Staples, Retail, Industrial, Materials, & Medical |
|
Get the most comprehensive stock market coverage daily at 12Stocks.com ➞ Best Stocks Today ➞ Best Stocks Weekly ➞ Best Stocks Year-to-Date ➞ Best Stocks Trends ➞  Best Stocks Today 12Stocks.com Best Nasdaq Stocks ➞ Best S&P 500 Stocks ➞ Best Tech Stocks ➞ Best Biotech Stocks ➞ |
| Detailed Overview of SmallCap Stocks |
| SmallCap Technical Overview, Leaders & Laggards, Top SmallCap ETF Funds & Detailed SmallCap Stocks List, Charts, Trends & More |
| Smallcap: Technical Analysis, Trends & YTD Performance | |
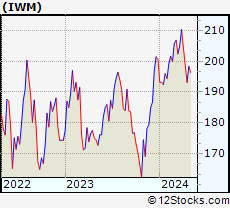
| SmallCap segment as represented by
IWM, an exchange-traded fund [ETF], holds basket of thousands of smallcap stocks from across all major sectors of the US stock market. The smallcap index (contains stocks like Riverbed & Sotheby's) is down by -0.42% and is currently underperforming the overall market by -6.01% year-to-date. Below is a quick view of technical charts and trends: | |
 IWM Weekly Chart |
|
| Long Term Trend: Not Good | |
| Medium Term Trend: Good | |
 IWM Daily Chart |
|
| Short Term Trend: Deteriorating | |
| Overall Trend Score: 49 | |
| YTD Performance: -0.42% | |
| **Trend Scores & Views Are Only For Educational Purposes And Not For Investing | |
| 12Stocks.com: Top Performing Small Cap Index Stocks | ||||||||||||||||||||||||||||||||||||||||||||||||
 The top performing Small Cap Index stocks year to date are
Now, more recently, over last week, the top performing Small Cap Index stocks on the move are


|
||||||||||||||||||||||||||||||||||||||||||||||||
| 12Stocks.com: Investing in Smallcap Index using Exchange Traded Funds | |
|
The following table shows list of key exchange traded funds (ETF) that
help investors track Smallcap index. The following list also includes leveraged ETF funds that track twice or thrice the daily returns of Smallcap indices. Short or inverse ETF funds move in the opposite direction to the index they track and are useful during market pullbacks or during bear markets. Quick View: Move mouse or cursor over ETF symbol (ticker) to view short-term technical chart and over ETF name to view long term chart. Click on ticker or stock name for detailed view. Click on to add stock symbol to your watchlist and to view watchlist. |
12Stocks.com List of ETFs that track Smallcap Index
| Ticker | ETF Name | Watchlist | Recent Price | Smart Investing & Trading Score | Change % | Week % | Year-to-date % |
| IWM | iShares Russell 2000 | | 199.87 | 49 | 1.81 | 0.75 | -0.42% |
| IJR | iShares Core S&P Small-Cap | | 106.30 | 50 | 1.49 | 0.62 | -1.8% |
| VTWO | Vanguard Russell 2000 ETF | | 80.62 | 7 | 1.59 | 0.5 | -0.59% |
| IWN | iShares Russell 2000 Value | | 152.63 | 50 | 1.87 | 0.98 | -1.74% |
| IWO | iShares Russell 2000 Growth | | 253.75 | 17 | 1.67 | 0.26 | 0.61% |
| IJS | iShares S&P Small-Cap 600 Value | | 97.92 | 13 | 1.58 | 0.75 | -5% |
| IJT | iShares S&P Small-Cap 600 Growth | | 126.18 | 20 | 0.99 | 0.07 | 0.83% |
| XSLV | PowerShares S&P SmallCap Low Volatil ETF | | 43.15 | 42 | 0.75 | 1.01 | -2.27% |
| SDD | ProShares UltraShort SmallCap600 | | 19.31 | 61 | -2.02 | -0.21 | 4.79% |
| SAA | ProShares Ultra SmallCap600 | | 22.93 | 32 | 1.56 | -0.46 | -8.08% |
| SMLV | SPDR SSGA US Small Cap Low Volatil ETF | | 108.63 | 37 | 1.11 | 1.04 | -3.45% |
| SBB | ProShares Short SmallCap600 | | 16.56 | 71 | 0.00 | 1.06 | 3.94% |
| 12Stocks.com: Charts, Trends, Fundamental Data and Performances of SmallCap Stocks | |
|
We now take in-depth look at all SmallCap stocks including charts, multi-period performances and overall trends (as measured by Smart Investing & Trading Score). One can sort SmallCap stocks (click link to choose) by Daily, Weekly and by Year-to-Date performances. Also, one can sort by size of the company or by market capitalization. |
| Select Your Default Chart Type: | |||||
| |||||
| Click on stock symbol or name for detailed view. Click on to add stock symbol to your watchlist and to view watchlist. Quick View: Move mouse or cursor over "Daily" to quickly view daily technical stock chart and over "Weekly" to view weekly technical stock chart. | |||||

 | SBRA Sabra Health Care REIT, Inc. |
| Sector: Financials | |
| SubSector: REIT - Healthcare Facilities | |
| MarketCap: 2576.54 Millions | |
| Recent Price: 14.23 Smart Investing & Trading Score: 83 | |
| Day Percent Change: 2.15% Day Change: 0.30 | |
| Week Change: 2.08% Year-to-date Change: -0.3% | |
| SBRA Links: Profile News Message Board | |
| Charts:- Daily , Weekly | |
| Add SBRA to Watchlist: View: Get Complete SBRA Trend Analysis ➞ | |
 | EQC Equity Commonwealth |
| Sector: Financials | |
| SubSector: REIT - Office | |
| MarketCap: 3659.36 Millions | |
| Recent Price: 19.15 Smart Investing & Trading Score: 100 | |
| Day Percent Change: 2.22% Day Change: 0.41 | |
| Week Change: 2.93% Year-to-date Change: -0.3% | |
| EQC Links: Profile News Message Board | |
| Charts:- Daily , Weekly | |
| Add EQC to Watchlist: View: Get Complete EQC Trend Analysis ➞ | |
 | BRT BRT Apartments Corp. |
| Sector: Financials | |
| SubSector: Mortgage Investment | |
| MarketCap: 163.239 Millions | |
| Recent Price: 18.46 Smart Investing & Trading Score: 95 | |
| Day Percent Change: 0.76% Day Change: 0.14 | |
| Week Change: 5.31% Year-to-date Change: -0.7% | |
| BRT Links: Profile News Message Board | |
| Charts:- Daily , Weekly | |
| Add BRT to Watchlist: View: Get Complete BRT Trend Analysis ➞ | |
 | NBN Northeast Bank |
| Sector: Financials | |
| SubSector: Regional - Northeast Banks | |
| MarketCap: 114.199 Millions | |
| Recent Price: 54.74 Smart Investing & Trading Score: 90 | |
| Day Percent Change: 3.25% Day Change: 1.72 | |
| Week Change: 4.26% Year-to-date Change: -0.8% | |
| NBN Links: Profile News Message Board | |
| Charts:- Daily , Weekly | |
| Add NBN to Watchlist: View: Get Complete NBN Trend Analysis ➞ | |
 | PFSI PennyMac Financial Services, Inc. |
| Sector: Financials | |
| SubSector: Mortgage Investment | |
| MarketCap: 1588.09 Millions | |
| Recent Price: 87.42 Smart Investing & Trading Score: 44 | |
| Day Percent Change: 1.40% Day Change: 1.21 | |
| Week Change: 0.48% Year-to-date Change: -1.1% | |
| PFSI Links: Profile News Message Board | |
| Charts:- Daily , Weekly | |
| Add PFSI to Watchlist: View: Get Complete PFSI Trend Analysis ➞ | |
 | OFG OFG Bancorp |
| Sector: Financials | |
| SubSector: Money Center Banks | |
| MarketCap: 537.599 Millions | |
| Recent Price: 37.02 Smart Investing & Trading Score: 85 | |
| Day Percent Change: 0.87% Day Change: 0.32 | |
| Week Change: 1.98% Year-to-date Change: -1.2% | |
| OFG Links: Profile News Message Board | |
| Charts:- Daily , Weekly | |
| Add OFG to Watchlist: View: Get Complete OFG Trend Analysis ➞ | |
 | GABC German American Bancorp, Inc. |
| Sector: Financials | |
| SubSector: Regional - Midwest Banks | |
| MarketCap: 731.47 Millions | |
| Recent Price: 32.00 Smart Investing & Trading Score: 68 | |
| Day Percent Change: 0.99% Day Change: 0.32 | |
| Week Change: -0.79% Year-to-date Change: -1.3% | |
| GABC Links: Profile News Message Board | |
| Charts:- Daily , Weekly | |
| Add GABC to Watchlist: View: Get Complete GABC Trend Analysis ➞ | |
 | AFCG AFC Gamma, Inc. |
| Sector: Financials | |
| SubSector: REIT - Specialty | |
| MarketCap: 269 Millions | |
| Recent Price: 11.88 Smart Investing & Trading Score: 63 | |
| Day Percent Change: -0.54% Day Change: -0.06 | |
| Week Change: 0.51% Year-to-date Change: -1.4% | |
| AFCG Links: Profile News Message Board | |
| Charts:- Daily , Weekly | |
| Add AFCG to Watchlist: View: Get Complete AFCG Trend Analysis ➞ | |
 | CTBI Community Trust Bancorp, Inc. |
| Sector: Financials | |
| SubSector: Regional - Southeast Banks | |
| MarketCap: 608.435 Millions | |
| Recent Price: 43.20 Smart Investing & Trading Score: 93 | |
| Day Percent Change: 1.15% Day Change: 0.49 | |
| Week Change: 1.31% Year-to-date Change: -1.5% | |
| CTBI Links: Profile News Message Board | |
| Charts:- Daily , Weekly | |
| Add CTBI to Watchlist: View: Get Complete CTBI Trend Analysis ➞ | |
 | CASH Meta Financial Group, Inc. |
| Sector: Financials | |
| SubSector: Savings & Loans | |
| MarketCap: 849.33 Millions | |
| Recent Price: 52.11 Smart Investing & Trading Score: 45 | |
| Day Percent Change: 3.09% Day Change: 1.56 | |
| Week Change: -0.06% Year-to-date Change: -1.6% | |
| CASH Links: Profile News Message Board | |
| Charts:- Daily , Weekly | |
| Add CASH to Watchlist: View: Get Complete CASH Trend Analysis ➞ | |
 | FCPT Four Corners Property Trust, Inc. |
| Sector: Financials | |
| SubSector: REIT - Hotel/Motel | |
| MarketCap: 1218.94 Millions | |
| Recent Price: 24.89 Smart Investing & Trading Score: 87 | |
| Day Percent Change: 5.65% Day Change: 1.33 | |
| Week Change: 6.19% Year-to-date Change: -1.6% | |
| FCPT Links: Profile News Message Board | |
| Charts:- Daily , Weekly | |
| Add FCPT to Watchlist: View: Get Complete FCPT Trend Analysis ➞ | |
 | QCRH QCR Holdings, Inc. |
| Sector: Financials | |
| SubSector: Regional - Southwest Banks | |
| MarketCap: 465.765 Millions | |
| Recent Price: 57.44 Smart Investing & Trading Score: 70 | |
| Day Percent Change: 1.86% Day Change: 1.05 | |
| Week Change: 2.19% Year-to-date Change: -1.6% | |
| QCRH Links: Profile News Message Board | |
| Charts:- Daily , Weekly | |
| Add QCRH to Watchlist: View: Get Complete QCRH Trend Analysis ➞ | |
 | UMBF UMB Financial Corporation |
| Sector: Financials | |
| SubSector: Regional - Southwest Banks | |
| MarketCap: 2207.35 Millions | |
| Recent Price: 82.13 Smart Investing & Trading Score: 65 | |
| Day Percent Change: 2.90% Day Change: 2.31 | |
| Week Change: -1.26% Year-to-date Change: -1.7% | |
| UMBF Links: Profile News Message Board | |
| Charts:- Daily , Weekly | |
| Add UMBF to Watchlist: View: Get Complete UMBF Trend Analysis ➞ | |
 | CNO CNO Financial Group, Inc. |
| Sector: Financials | |
| SubSector: Accident & Health Insurance | |
| MarketCap: 1746.9 Millions | |
| Recent Price: 27.42 Smart Investing & Trading Score: 90 | |
| Day Percent Change: 2.66% Day Change: 0.71 | |
| Week Change: 3.86% Year-to-date Change: -1.7% | |
| CNO Links: Profile News Message Board | |
| Charts:- Daily , Weekly | |
| Add CNO to Watchlist: View: Get Complete CNO Trend Analysis ➞ | |
 | HTBI HomeTrust Bancshares, Inc. |
| Sector: Financials | |
| SubSector: Regional - Northeast Banks | |
| MarketCap: 238.899 Millions | |
| Recent Price: 26.45 Smart Investing & Trading Score: 67 | |
| Day Percent Change: 1.52% Day Change: 0.39 | |
| Week Change: 1.44% Year-to-date Change: -1.7% | |
| HTBI Links: Profile News Message Board | |
| Charts:- Daily , Weekly | |
| Add HTBI to Watchlist: View: Get Complete HTBI Trend Analysis ➞ | |
 | TRC Tejon Ranch Co. |
| Sector: Financials | |
| SubSector: Property Management | |
| MarketCap: 346.442 Millions | |
| Recent Price: 16.90 Smart Investing & Trading Score: 68 | |
| Day Percent Change: 0.42% Day Change: 0.07 | |
| Week Change: -1% Year-to-date Change: -1.7% | |
| TRC Links: Profile News Message Board | |
| Charts:- Daily , Weekly | |
| Add TRC to Watchlist: View: Get Complete TRC Trend Analysis ➞ | |
 | FOR Forestar Group Inc. |
| Sector: Financials | |
| SubSector: Real Estate Development | |
| MarketCap: 661.019 Millions | |
| Recent Price: 32.37 Smart Investing & Trading Score: 39 | |
| Day Percent Change: 3.80% Day Change: 1.19 | |
| Week Change: 3.3% Year-to-date Change: -2.1% | |
| FOR Links: Profile News Message Board | |
| Charts:- Daily , Weekly | |
| Add FOR to Watchlist: View: Get Complete FOR Trend Analysis ➞ | |
 | REFI Chicago Atlantic Financials Finance, Inc. |
| Sector: Financials | |
| SubSector: REIT - Mortgage | |
| MarketCap: 285 Millions | |
| Recent Price: 15.80 Smart Investing & Trading Score: 52 | |
| Day Percent Change: -0.22% Day Change: -0.04 | |
| Week Change: 0.96% Year-to-date Change: -2.4% | |
| REFI Links: Profile News Message Board | |
| Charts:- Daily , Weekly | |
| Add REFI to Watchlist: View: Get Complete REFI Trend Analysis ➞ | |
 | WSFS WSFS Financial Corporation |
| Sector: Financials | |
| SubSector: Regional - Mid-Atlantic Banks | |
| MarketCap: 1191.29 Millions | |
| Recent Price: 44.81 Smart Investing & Trading Score: 93 | |
| Day Percent Change: 2.35% Day Change: 1.03 | |
| Week Change: 4.57% Year-to-date Change: -2.4% | |
| WSFS Links: Profile News Message Board | |
| Charts:- Daily , Weekly | |
| Add WSFS to Watchlist: View: Get Complete WSFS Trend Analysis ➞ | |
 | FFBC First Financial Bancorp. |
| Sector: Financials | |
| SubSector: Regional - Midwest Banks | |
| MarketCap: 1363.7 Millions | |
| Recent Price: 23.17 Smart Investing & Trading Score: 100 | |
| Day Percent Change: 2.12% Day Change: 0.48 | |
| Week Change: 2.66% Year-to-date Change: -2.4% | |
| FFBC Links: Profile News Message Board | |
| Charts:- Daily , Weekly | |
| Add FFBC to Watchlist: View: Get Complete FFBC Trend Analysis ➞ | |
 | ARR ARMOUR Residential REIT, Inc. |
| Sector: Financials | |
| SubSector: Mortgage Investment | |
| MarketCap: 578.739 Millions | |
| Recent Price: 18.76 Smart Investing & Trading Score: 64 | |
| Day Percent Change: 0.70% Day Change: 0.13 | |
| Week Change: 1.3% Year-to-date Change: -2.9% | |
| ARR Links: Profile News Message Board | |
| Charts:- Daily , Weekly | |
| Add ARR to Watchlist: View: Get Complete ARR Trend Analysis ➞ | |
 | USCB USCB Financial Holdings, Inc. |
| Sector: Financials | |
| SubSector: Banks - Regional | |
| MarketCap: 198 Millions | |
| Recent Price: 11.92 Smart Investing & Trading Score: 100 | |
| Day Percent Change: 1.97% Day Change: 0.23 | |
| Week Change: 11.09% Year-to-date Change: -2.9% | |
| USCB Links: Profile News Message Board | |
| Charts:- Daily , Weekly | |
| Add USCB to Watchlist: View: Get Complete USCB Trend Analysis ➞ | |
 | HWC Hancock Whitney Corporation |
| Sector: Financials | |
| SubSector: Regional - Southeast Banks | |
| MarketCap: 1438.55 Millions | |
| Recent Price: 47.16 Smart Investing & Trading Score: 95 | |
| Day Percent Change: 1.77% Day Change: 0.82 | |
| Week Change: 0.9% Year-to-date Change: -2.9% | |
| HWC Links: Profile News Message Board | |
| Charts:- Daily , Weekly | |
| Add HWC to Watchlist: View: Get Complete HWC Trend Analysis ➞ | |
 | CADE Cadence Bancorporation |
| Sector: Financials | |
| SubSector: Regional - Southeast Banks | |
| MarketCap: 756.335 Millions | |
| Recent Price: 28.71 Smart Investing & Trading Score: 88 | |
| Day Percent Change: 1.70% Day Change: 0.48 | |
| Week Change: -1.07% Year-to-date Change: -3.0% | |
| CADE Links: Profile News Message Board | |
| Charts:- Daily , Weekly | |
| Add CADE to Watchlist: View: Get Complete CADE Trend Analysis ➞ | |
 | BY Byline Bancorp, Inc. |
| Sector: Financials | |
| SubSector: Regional - Midwest Banks | |
| MarketCap: 381.87 Millions | |
| Recent Price: 22.83 Smart Investing & Trading Score: 100 | |
| Day Percent Change: 2.01% Day Change: 0.45 | |
| Week Change: 4.82% Year-to-date Change: -3.1% | |
| BY Links: Profile News Message Board | |
| Charts:- Daily , Weekly | |
| Add BY to Watchlist: View: Get Complete BY Trend Analysis ➞ | |
| For tabular summary view of above stock list: Summary View ➞ 0 - 25 , 25 - 50 , 50 - 75 , 75 - 100 , 100 - 125 , 125 - 150 , 150 - 175 , 175 - 200 , 200 - 225 , 225 - 250 , 250 - 275 , 275 - 300 , 300 - 325 , 325 - 350 , 350 - 375 , 375 - 400 | ||
| Click To Change The Sort Order: By Market Cap or Company Size Performance: Year-to-date, Week and Day | |
| Select Chart Type: | ||
| Too many stocks? View smallcap stocks filtered by marketcap & sector |
| Marketcap: All SmallCap Stocks (default-no microcap), Large, Mid-Range, Small & MicroCap |
| Sector: Tech, Finance, Energy, Staples, Retail, Industrial, Materials, Utilities & Medical |
|
Best Stocks Today 12Stocks.com |
© 2024 12Stocks.com Terms & Conditions Privacy Contact Us
All Information Provided Only For Education And Not To Be Used For Investing or Trading. See Terms & Conditions


One More Thing ... Get Best Stocks Delivered Daily!
Never Ever Miss A Move With Our Top Ten Stocks Lists
Find Best Stocks In Any Market - Bull or Bear Market
Take A Peek At Our Top Ten Stocks Lists: Daily, Weekly, Year-to-Date & Top Trends
Find Best Stocks In Any Market - Bull or Bear Market
Take A Peek At Our Top Ten Stocks Lists: Daily, Weekly, Year-to-Date & Top Trends
Smallcap Stocks With Best Up Trends [0-bearish to 100-bullish]: Emergent BioSolutions[100], Aspen Aerogels[100], Perdoceo Education[100], Gannett Co[100], Pitney Bowes[100], Origin Materials[100], Benchmark Electronics[100], Blueprint Medicines[100], FormFactor [100], Lantheus [100], Tronox [100]
Best Smallcap Stocks Year-to-Date:
Janux [440.16%], Viking [306.07%], Longboard [258.92%], Alpine Immune[239.44%], Bakkt [187.89%], Avidity Biosciences[184.07%], Arcutis Bio[171.83%], Vera [170.74%], Cullinan Oncology[169.74%], Super Micro[159.59%], Y-mAbs [153.08%] Best Smallcap Stocks This Week:
Deciphera [73.24%], Emergent BioSolutions[69.53%], Aspen Aerogels[47.24%], Eyenovia [45.27%], P3 Health[38.51%], Carvana Co[37.82%], Origin Materials[36.24%], Poseida [34.98%], Cue Biopharma[34.07%], Surmodics [33.44%], TransMedics Group[33.23%] Best Smallcap Stocks Daily:
Emergent BioSolutions[68.65%], Aspen Aerogels[55.75%], Carvana Co[33.42%], Enovix [31.06%], Perdoceo Education[28.82%], Office Properties[28.50%], Gannett Co[26.14%], Pitney Bowes[23.99%], Sunnova Energy[23.23%], Pulmonx [20.21%], CommScope Holding[19.80%]