
 Login Sign Up


| |||||
 |  | ||||

| 12Stocks.com Market Intelligence |
Best SmallCap Stocks
|
| In a hurry? Small Cap Stock Lists: Performance Trends Table, Stock Charts
Sort Small Cap stocks: Daily, Weekly, Year-to-Date, Market Cap & Trends. Filter Small Cap stocks list by sector: Show all, Tech, Finance, Energy, Staples, Retail, Industrial, Materials, Utilities and HealthCare Filter Small Cap stocks list by size: All Large Medium Small and MicroCap |
| 12Stocks.com Small Cap Stocks Performances & Trends Daily | |||||||||
|
|  The overall Smart Investing & Trading Score is 39 (0-bearish to 100-bullish) which puts Small Cap index in short term bearish to neutral trend. The Smart Investing & Trading Score from previous trading session is 14 and hence an improvement of trend.
| ||||||||
Here are the Smart Investing & Trading Scores of the most requested small cap stocks at 12Stocks.com (click stock name for detailed review):
|


| 12Stocks.com: Investing in Smallcap Index with Stocks | |
|
The following table helps investors and traders sort through current performance and trends (as measured by Smart Investing & Trading Score) of various
stocks in the Smallcap Index. Quick View: Move mouse or cursor over stock symbol (ticker) to view short-term technical chart and over stock name to view long term chart. Click on  to add stock symbol to your watchlist and to add stock symbol to your watchlist and  to view watchlist. Click on any ticker or stock name for detailed market intelligence report for that stock. to view watchlist. Click on any ticker or stock name for detailed market intelligence report for that stock. |
12Stocks.com Performance of Stocks in Smallcap Index
| Ticker | Stock Name | Watchlist | Category | Recent Price | Smart Investing & Trading Score | Change % | YTD Change% |
| HIPO | Hippo |   | Financials | 18.16 | 31 | -17.34% | 99.34% |
| EVER | EverQuote | | Financials | 22.20 | 100 | 8.69% | 81.41% |
| TREE | LendingTree | | Financials | 48.05 | 95 | 0.33% | 58.48% |
| RILY | B. Riley | | Financials | 32.87 | 68 | 0.55% | 56.60% |
| FIHL | Fidelis Insurance | | Financials | 18.79 | 51 | 1.46% | 48.71% |
| MCY | Mercury General | | Financials | 55.47 | 100 | 2.17% | 48.67% |
| VCTR | Victory Capital | | Financials | 50.62 | 63 | 0.34% | 46.98% |
| PLMR | Palomar | | Financials | 78.69 | 53 | -0.44% | 41.79% |
| GEO | GEO Group | | Financials | 15.07 | 56 | 2.20% | 39.10% |
| JXN | Jackson Financial | | Financials | 70.59 | 88 | 2.16% | 37.33% |
| AMRK | A-Mark Precious | | Financials | 41.49 | 100 | 1.74% | 37.16% |
| HCI | HCI Group | | Financials | 112.90 | 53 | -1.19% | 29.18% |
| MLP | Maui Land | | Financials | 20.43 | 90 | 2.54% | 28.54% |
| SLQT | SelectQuote | | Financials | 1.75 | 52 | 8.39% | 27.37% |
| TRTX | TPG RE | | Financials | 8.28 | 100 | -0.18% | 27.31% |
| MCBC | Macatawa Bank | | Financials | 14.30 | 76 | 0.63% | 26.77% |
| PWP | Perella Weinberg | | Financials | 15.28 | 63 | 1.70% | 23.68% |
| UVE | Universal Insurance | | Financials | 19.74 | 37 | -1.55% | 23.53% |
| COOP | Mr. Cooper | | Financials | 78.22 | 46 | 0.91% | 20.11% |
| BLX | Banco Latinoamericano | | Financials | 29.42 | 56 | 1.03% | 18.92% |
| BSIG | BrightSphere | | Financials | 22.64 | 50 | 0.96% | 18.14% |
| HMN | Horace Mann | | Financials | 37.63 | 95 | -0.27% | 15.08% |
| NHI | National Health | | Financials | 64.08 | 100 | 1.07% | 14.74% |
| HTLF | Heartland Financial | | Financials | 43.10 | 100 | 2.42% | 14.60% |
| NODK | NI | | Financials | 14.88 | 59 | 0.00% | 14.55% |
| For chart view version of above stock list: Chart View ➞ 0 - 25 , 25 - 50 , 50 - 75 , 75 - 100 , 100 - 125 , 125 - 150 , 150 - 175 , 175 - 200 , 200 - 225 , 225 - 250 , 250 - 275 , 275 - 300 , 300 - 325 , 325 - 350 , 350 - 375 , 375 - 400 | ||
 | Click To Change The Sort Order: By Market Cap or Company Size Performance: Year-to-date, Week and Day |  |
| Too many stocks? View smallcap stocks filtered by marketcap & sector |
| Marketcap: All SmallCap Stocks (default-no microcap), Large, Mid-Range, Small |
| Smallcap Sector: Tech, Finance, Energy, Staples, Retail, Industrial, Materials, & Medical |
|
Get the most comprehensive stock market coverage daily at 12Stocks.com ➞ Best Stocks Today ➞ Best Stocks Weekly ➞ Best Stocks Year-to-Date ➞ Best Stocks Trends ➞  Best Stocks Today 12Stocks.com Best Nasdaq Stocks ➞ Best S&P 500 Stocks ➞ Best Tech Stocks ➞ Best Biotech Stocks ➞ |
| Detailed Overview of SmallCap Stocks |
| SmallCap Technical Overview, Leaders & Laggards, Top SmallCap ETF Funds & Detailed SmallCap Stocks List, Charts, Trends & More |
| Smallcap: Technical Analysis, Trends & YTD Performance | |
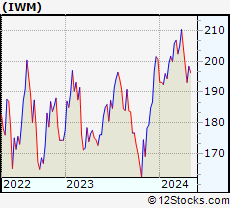
| SmallCap segment as represented by
IWM, an exchange-traded fund [ETF], holds basket of thousands of smallcap stocks from across all major sectors of the US stock market. The smallcap index (contains stocks like Riverbed & Sotheby's) is down by -1.02% and is currently underperforming the overall market by -6.17% year-to-date. Below is a quick view of technical charts and trends: | |
 IWM Weekly Chart |
|
| Long Term Trend: Not Good | |
| Medium Term Trend: Not Good | |
 IWM Daily Chart |
|
| Short Term Trend: Deteriorating | |
| Overall Trend Score: 39 | |
| YTD Performance: -1.02% | |
| **Trend Scores & Views Are Only For Educational Purposes And Not For Investing | |
| 12Stocks.com: Top Performing Small Cap Index Stocks | ||||||||||||||||||||||||||||||||||||||||||||||||
 The top performing Small Cap Index stocks year to date are
Now, more recently, over last week, the top performing Small Cap Index stocks on the move are


|
||||||||||||||||||||||||||||||||||||||||||||||||
| 12Stocks.com: Investing in Smallcap Index using Exchange Traded Funds | |
|
The following table shows list of key exchange traded funds (ETF) that
help investors track Smallcap index. The following list also includes leveraged ETF funds that track twice or thrice the daily returns of Smallcap indices. Short or inverse ETF funds move in the opposite direction to the index they track and are useful during market pullbacks or during bear markets. Quick View: Move mouse or cursor over ETF symbol (ticker) to view short-term technical chart and over ETF name to view long term chart. Click on ticker or stock name for detailed view. Click on to add stock symbol to your watchlist and to view watchlist. |
12Stocks.com List of ETFs that track Smallcap Index
| Ticker | ETF Name | Watchlist | Recent Price | Smart Investing & Trading Score | Change % | Week % | Year-to-date % |
| IWM | iShares Russell 2000 | | 198.66 | 39 | 1.20 | 0.14 | -1.02% |
| IJR | iShares Core S&P Small-Cap | | 105.66 | 50 | 0.88 | 0.01 | -2.39% |
| IWN | iShares Russell 2000 Value | | 151.74 | 50 | 1.28 | 0.39 | -2.31% |
| IWO | iShares Russell 2000 Growth | | 252.43 | 17 | 1.14 | -0.26 | 0.08% |
| 12Stocks.com: Charts, Trends, Fundamental Data and Performances of SmallCap Stocks | |
|
We now take in-depth look at all SmallCap stocks including charts, multi-period performances and overall trends (as measured by Smart Investing & Trading Score). One can sort SmallCap stocks (click link to choose) by Daily, Weekly and by Year-to-Date performances. Also, one can sort by size of the company or by market capitalization. |
| Select Your Default Chart Type: | |||||
| |||||
| Click on stock symbol or name for detailed view. Click on to add stock symbol to your watchlist and to view watchlist. Quick View: Move mouse or cursor over "Daily" to quickly view daily technical stock chart and over "Weekly" to view weekly technical stock chart. | |||||

 | HIPO Hippo Holdings Inc. |
| Sector: Financials | |
| SubSector: Insurance - Specialty | |
| MarketCap: 377 Millions | |
| Recent Price: 18.16 Smart Investing & Trading Score: 31 | |
| Day Percent Change: -17.34% Day Change: -3.81 | |
| Week Change: -16.77% Year-to-date Change: 99.3% | |
| HIPO Links: Profile News Message Board | |
| Charts:- Daily , Weekly | |
| Add HIPO to Watchlist: View: Get Complete HIPO Trend Analysis ➞ | |
 | EVER EverQuote, Inc. |
| Sector: Financials | |
| SubSector: Regional - Southeast Banks | |
| MarketCap: 767.135 Millions | |
| Recent Price: 22.20 Smart Investing & Trading Score: 100 | |
| Day Percent Change: 8.69% Day Change: 1.77 | |
| Week Change: 13.58% Year-to-date Change: 81.4% | |
| EVER Links: Profile News Message Board | |
| Charts:- Daily , Weekly | |
| Add EVER to Watchlist: View: Get Complete EVER Trend Analysis ➞ | |
 | TREE LendingTree, Inc. |
| Sector: Financials | |
| SubSector: Mortgage Investment | |
| MarketCap: 2745.99 Millions | |
| Recent Price: 48.05 Smart Investing & Trading Score: 95 | |
| Day Percent Change: 0.33% Day Change: 0.16 | |
| Week Change: 26.78% Year-to-date Change: 58.5% | |
| TREE Links: Profile News Message Board | |
| Charts:- Daily , Weekly | |
| Add TREE to Watchlist: View: Get Complete TREE Trend Analysis ➞ | |
 | RILY B. Riley Financial, Inc. |
| Sector: Financials | |
| SubSector: Asset Management | |
| MarketCap: 443.703 Millions | |
| Recent Price: 32.87 Smart Investing & Trading Score: 68 | |
| Day Percent Change: 0.55% Day Change: 0.18 | |
| Week Change: -10.73% Year-to-date Change: 56.6% | |
| RILY Links: Profile News Message Board | |
| Charts:- Daily , Weekly | |
| Add RILY to Watchlist: View: Get Complete RILY Trend Analysis ➞ | |
 | FIHL Fidelis Insurance Holdings Limited |
| Sector: Financials | |
| SubSector: Insurance - Diversified | |
| MarketCap: 1590 Millions | |
| Recent Price: 18.79 Smart Investing & Trading Score: 51 | |
| Day Percent Change: 1.46% Day Change: 0.27 | |
| Week Change: -3.64% Year-to-date Change: 48.7% | |
| FIHL Links: Profile News Message Board | |
| Charts:- Daily , Weekly | |
| Add FIHL to Watchlist: View: Get Complete FIHL Trend Analysis ➞ | |
 | MCY Mercury General Corporation |
| Sector: Financials | |
| SubSector: Property & Casualty Insurance | |
| MarketCap: 2122.12 Millions | |
| Recent Price: 55.47 Smart Investing & Trading Score: 100 | |
| Day Percent Change: 2.17% Day Change: 1.18 | |
| Week Change: 7.38% Year-to-date Change: 48.7% | |
| MCY Links: Profile News Message Board | |
| Charts:- Daily , Weekly | |
| Add MCY to Watchlist: View: Get Complete MCY Trend Analysis ➞ | |
 | VCTR Victory Capital Holdings, Inc. |
| Sector: Financials | |
| SubSector: Asset Management | |
| MarketCap: 1148.33 Millions | |
| Recent Price: 50.62 Smart Investing & Trading Score: 63 | |
| Day Percent Change: 0.34% Day Change: 0.17 | |
| Week Change: -1.86% Year-to-date Change: 47.0% | |
| VCTR Links: Profile News Message Board | |
| Charts:- Daily , Weekly | |
| Add VCTR to Watchlist: View: Get Complete VCTR Trend Analysis ➞ | |
 | PLMR Palomar Holdings, Inc. |
| Sector: Financials | |
| SubSector: Property & Casualty Insurance | |
| MarketCap: 1297.42 Millions | |
| Recent Price: 78.69 Smart Investing & Trading Score: 53 | |
| Day Percent Change: -0.44% Day Change: -0.35 | |
| Week Change: -1.01% Year-to-date Change: 41.8% | |
| PLMR Links: Profile News Message Board | |
| Charts:- Daily , Weekly | |
| Add PLMR to Watchlist: View: Get Complete PLMR Trend Analysis ➞ | |
 | GEO The GEO Group, Inc. |
| Sector: Financials | |
| SubSector: REIT - Healthcare Facilities | |
| MarketCap: 1678.34 Millions | |
| Recent Price: 15.07 Smart Investing & Trading Score: 56 | |
| Day Percent Change: 2.20% Day Change: 0.32 | |
| Week Change: 1.31% Year-to-date Change: 39.1% | |
| GEO Links: Profile News Message Board | |
| Charts:- Daily , Weekly | |
| Add GEO to Watchlist: View: Get Complete GEO Trend Analysis ➞ | |
 | JXN Jackson Financial Inc. |
| Sector: Financials | |
| SubSector: Insurance - Life | |
| MarketCap: 2460 Millions | |
| Recent Price: 70.59 Smart Investing & Trading Score: 88 | |
| Day Percent Change: 2.16% Day Change: 1.49 | |
| Week Change: 1.48% Year-to-date Change: 37.3% | |
| JXN Links: Profile News Message Board | |
| Charts:- Daily , Weekly | |
| Add JXN to Watchlist: View: Get Complete JXN Trend Analysis ➞ | |
 | AMRK A-Mark Precious Metals, Inc. |
| Sector: Financials | |
| SubSector: Investment Brokerage - National | |
| MarketCap: 60.2805 Millions | |
| Recent Price: 41.49 Smart Investing & Trading Score: 100 | |
| Day Percent Change: 1.74% Day Change: 0.71 | |
| Week Change: 3.41% Year-to-date Change: 37.2% | |
| AMRK Links: Profile News Message Board | |
| Charts:- Daily , Weekly | |
| Add AMRK to Watchlist: View: Get Complete AMRK Trend Analysis ➞ | |
 | HCI HCI Group, Inc. |
| Sector: Financials | |
| SubSector: Property & Casualty Insurance | |
| MarketCap: 297.412 Millions | |
| Recent Price: 112.90 Smart Investing & Trading Score: 53 | |
| Day Percent Change: -1.19% Day Change: -1.36 | |
| Week Change: -1.83% Year-to-date Change: 29.2% | |
| HCI Links: Profile News Message Board | |
| Charts:- Daily , Weekly | |
| Add HCI to Watchlist: View: Get Complete HCI Trend Analysis ➞ | |
 | MLP Maui Land & Pineapple Company, Inc. |
| Sector: Financials | |
| SubSector: Real Estate Development | |
| MarketCap: 186.619 Millions | |
| Recent Price: 20.43 Smart Investing & Trading Score: 90 | |
| Day Percent Change: 2.54% Day Change: 0.50 | |
| Week Change: 3.1% Year-to-date Change: 28.5% | |
| MLP Links: Profile News Message Board | |
| Charts:- Daily , Weekly | |
| Add MLP to Watchlist: View: Get Complete MLP Trend Analysis ➞ | |
 | SLQT SelectQuote, Inc. |
| Sector: Financials | |
| SubSector: Insurance Brokers | |
| MarketCap: 38257 Millions | |
| Recent Price: 1.75 Smart Investing & Trading Score: 52 | |
| Day Percent Change: 8.39% Day Change: 0.14 | |
| Week Change: 8.39% Year-to-date Change: 27.4% | |
| SLQT Links: Profile News Message Board | |
| Charts:- Daily , Weekly | |
| Add SLQT to Watchlist: View: Get Complete SLQT Trend Analysis ➞ | |
 | TRTX TPG RE Finance Trust, Inc. |
| Sector: Financials | |
| SubSector: Mortgage Investment | |
| MarketCap: 607.739 Millions | |
| Recent Price: 8.28 Smart Investing & Trading Score: 100 | |
| Day Percent Change: -0.18% Day Change: -0.01 | |
| Week Change: 9.6% Year-to-date Change: 27.3% | |
| TRTX Links: Profile News Message Board | |
| Charts:- Daily , Weekly | |
| Add TRTX to Watchlist: View: Get Complete TRTX Trend Analysis ➞ | |
 | MCBC Macatawa Bank Corporation |
| Sector: Financials | |
| SubSector: Regional - Midwest Banks | |
| MarketCap: 264.37 Millions | |
| Recent Price: 14.30 Smart Investing & Trading Score: 76 | |
| Day Percent Change: 0.63% Day Change: 0.09 | |
| Week Change: 0.42% Year-to-date Change: 26.8% | |
| MCBC Links: Profile News Message Board | |
| Charts:- Daily , Weekly | |
| Add MCBC to Watchlist: View: Get Complete MCBC Trend Analysis ➞ | |
 | PWP Perella Weinberg Partners |
| Sector: Financials | |
| SubSector: Capital Markets | |
| MarketCap: 705 Millions | |
| Recent Price: 15.28 Smart Investing & Trading Score: 63 | |
| Day Percent Change: 1.70% Day Change: 0.26 | |
| Week Change: -0.23% Year-to-date Change: 23.7% | |
| PWP Links: Profile News Message Board | |
| Charts:- Daily , Weekly | |
| Add PWP to Watchlist: View: Get Complete PWP Trend Analysis ➞ | |
 | UVE Universal Insurance Holdings, Inc. |
| Sector: Financials | |
| SubSector: Property & Casualty Insurance | |
| MarketCap: 616.212 Millions | |
| Recent Price: 19.74 Smart Investing & Trading Score: 37 | |
| Day Percent Change: -1.55% Day Change: -0.31 | |
| Week Change: 1.02% Year-to-date Change: 23.5% | |
| UVE Links: Profile News Message Board | |
| Charts:- Daily , Weekly | |
| Add UVE to Watchlist: View: Get Complete UVE Trend Analysis ➞ | |
 | COOP Mr. Cooper Group Inc. |
| Sector: Financials | |
| SubSector: Savings & Loans | |
| MarketCap: 648.33 Millions | |
| Recent Price: 78.22 Smart Investing & Trading Score: 46 | |
| Day Percent Change: 0.91% Day Change: 0.70 | |
| Week Change: -0.65% Year-to-date Change: 20.1% | |
| COOP Links: Profile News Message Board | |
| Charts:- Daily , Weekly | |
| Add COOP to Watchlist: View: Get Complete COOP Trend Analysis ➞ | |
 | BLX Banco Latinoamericano de Comercio Exterior, S.A |
| Sector: Financials | |
| SubSector: Foreign Money Center Banks | |
| MarketCap: 390.471 Millions | |
| Recent Price: 29.42 Smart Investing & Trading Score: 56 | |
| Day Percent Change: 1.03% Day Change: 0.30 | |
| Week Change: -0.54% Year-to-date Change: 18.9% | |
| BLX Links: Profile News Message Board | |
| Charts:- Daily , Weekly | |
| Add BLX to Watchlist: View: Get Complete BLX Trend Analysis ➞ | |
 | BSIG BrightSphere Investment Group Inc. |
| Sector: Financials | |
| SubSector: Asset Management | |
| MarketCap: 430.103 Millions | |
| Recent Price: 22.64 Smart Investing & Trading Score: 50 | |
| Day Percent Change: 0.96% Day Change: 0.21 | |
| Week Change: 0.11% Year-to-date Change: 18.1% | |
| BSIG Links: Profile News Message Board | |
| Charts:- Daily , Weekly | |
| Add BSIG to Watchlist: View: Get Complete BSIG Trend Analysis ➞ | |
 | HMN Horace Mann Educators Corporation |
| Sector: Financials | |
| SubSector: Property & Casualty Insurance | |
| MarketCap: 1545.52 Millions | |
| Recent Price: 37.63 Smart Investing & Trading Score: 95 | |
| Day Percent Change: -0.27% Day Change: -0.10 | |
| Week Change: 2.42% Year-to-date Change: 15.1% | |
| HMN Links: Profile News Message Board | |
| Charts:- Daily , Weekly | |
| Add HMN to Watchlist: View: Get Complete HMN Trend Analysis ➞ | |
 | NHI National Health Investors, Inc. |
| Sector: Financials | |
| SubSector: REIT - Healthcare Facilities | |
| MarketCap: 2156.54 Millions | |
| Recent Price: 64.08 Smart Investing & Trading Score: 100 | |
| Day Percent Change: 1.07% Day Change: 0.68 | |
| Week Change: 1.89% Year-to-date Change: 14.7% | |
| NHI Links: Profile News Message Board | |
| Charts:- Daily , Weekly | |
| Add NHI to Watchlist: View: Get Complete NHI Trend Analysis ➞ | |
 | HTLF Heartland Financial USA, Inc. |
| Sector: Financials | |
| SubSector: Regional - Southwest Banks | |
| MarketCap: 1143.85 Millions | |
| Recent Price: 43.10 Smart Investing & Trading Score: 100 | |
| Day Percent Change: 2.42% Day Change: 1.02 | |
| Week Change: 20.66% Year-to-date Change: 14.6% | |
| HTLF Links: Profile News Message Board | |
| Charts:- Daily , Weekly | |
| Add HTLF to Watchlist: View: Get Complete HTLF Trend Analysis ➞ | |
 | NODK NI Holdings, Inc. |
| Sector: Financials | |
| SubSector: Property & Casualty Insurance | |
| MarketCap: 238.112 Millions | |
| Recent Price: 14.88 Smart Investing & Trading Score: 59 | |
| Day Percent Change: 0.00% Day Change: 0.00 | |
| Week Change: -0.6% Year-to-date Change: 14.6% | |
| NODK Links: Profile News Message Board | |
| Charts:- Daily , Weekly | |
| Add NODK to Watchlist: View: Get Complete NODK Trend Analysis ➞ | |
| For tabular summary view of above stock list: Summary View ➞ 0 - 25 , 25 - 50 , 50 - 75 , 75 - 100 , 100 - 125 , 125 - 150 , 150 - 175 , 175 - 200 , 200 - 225 , 225 - 250 , 250 - 275 , 275 - 300 , 300 - 325 , 325 - 350 , 350 - 375 , 375 - 400 | ||
| Click To Change The Sort Order: By Market Cap or Company Size Performance: Year-to-date, Week and Day | |
| Select Chart Type: | ||
| Too many stocks? View smallcap stocks filtered by marketcap & sector |
| Marketcap: All SmallCap Stocks (default-no microcap), Large, Mid-Range, Small & MicroCap |
| Sector: Tech, Finance, Energy, Staples, Retail, Industrial, Materials, Utilities & Medical |
|
Best Stocks Today 12Stocks.com |
© 2024 12Stocks.com Terms & Conditions Privacy Contact Us
All Information Provided Only For Education And Not To Be Used For Investing or Trading. See Terms & Conditions


One More Thing ... Get Best Stocks Delivered Daily!
Never Ever Miss A Move With Our Top Ten Stocks Lists
Find Best Stocks In Any Market - Bull or Bear Market
Take A Peek At Our Top Ten Stocks Lists: Daily, Weekly, Year-to-Date & Top Trends
Find Best Stocks In Any Market - Bull or Bear Market
Take A Peek At Our Top Ten Stocks Lists: Daily, Weekly, Year-to-Date & Top Trends
Smallcap Stocks With Best Up Trends [0-bearish to 100-bullish]: Emergent BioSolutions[100], Aspen Aerogels[100], Gannett Co[100], Pitney Bowes[100], Perdoceo Education[100], Origin Materials[100], Benchmark Electronics[100], Sprouts Farmers[100], FormFactor [100], Lantheus [100], TTM [100]
Best Smallcap Stocks Year-to-Date:
Janux [440.16%], Viking [306.02%], Longboard [258.92%], Alpine Immune[239.44%], Bakkt [187.89%], Avidity Biosciences[184.07%], Vera [170.74%], Cullinan Oncology[169.74%], Arcutis Bio[163.93%], Super Micro[161.15%], Y-mAbs [145.23%] Best Smallcap Stocks This Week:
Emergent BioSolutions[110.94%], Eyenovia [45.27%], P3 Health[38.51%], Aspen Aerogels[37.17%], Origin Materials[36.24%], Cue Biopharma[35.9%], Poseida [34.98%], Enovix [32.07%], Surmodics [31.94%], Phibro Animal[28.44%], TransMedics Group[28.2%] Best Smallcap Stocks Daily:
Emergent BioSolutions[109.84%], Aspen Aerogels[45.11%], Gannett Co[31.12%], Enovix [31.06%], Pitney Bowes[23.87%], Office Properties[22.00%], Pulmonx [20.21%], Perdoceo Education[19.25%], Origin Materials[17.75%], Benchmark Electronics[17.40%], Children s[14.21%]