
 Login Sign Up


| |||||
 |  | ||||

| 12Stocks.com Market Intelligence |
Best SmallCap Stocks
|
| In a hurry? Small Cap Stock Lists: Performance Trends Table, Stock Charts
Sort Small Cap stocks: Daily, Weekly, Year-to-Date, Market Cap & Trends. Filter Small Cap stocks list by sector: Show all, Tech, Finance, Energy, Staples, Retail, Industrial, Materials, Utilities and HealthCare Filter Small Cap stocks list by size: All Large Medium Small and MicroCap |
| 12Stocks.com Small Cap Stocks Performances & Trends Daily | |||||||||
|
|  The overall Smart Investing & Trading Score is 49 (0-bearish to 100-bullish) which puts Small Cap index in short term neutral trend. The Smart Investing & Trading Score from previous trading session is 14 and hence an improvement of trend.
| ||||||||
Here are the Smart Investing & Trading Scores of the most requested small cap stocks at 12Stocks.com (click stock name for detailed review):
|


| 12Stocks.com: Investing in Smallcap Index with Stocks | |
|
The following table helps investors and traders sort through current performance and trends (as measured by Smart Investing & Trading Score) of various
stocks in the Smallcap Index. Quick View: Move mouse or cursor over stock symbol (ticker) to view short-term technical chart and over stock name to view long term chart. Click on  to add stock symbol to your watchlist and to add stock symbol to your watchlist and  to view watchlist. Click on any ticker or stock name for detailed market intelligence report for that stock. to view watchlist. Click on any ticker or stock name for detailed market intelligence report for that stock. |
12Stocks.com Performance of Stocks in Smallcap Index
| Ticker | Stock Name | Watchlist | Category | Recent Price | Smart Investing & Trading Score | Change % | Weekly Change% |
| DSP | Viant |   | Technology | 8.08 | 10 | -0.49% | -3.00% |
| FARO | FARO | | Technology | 18.35 | 7 | -2.86% | -3.01% |
| NVTS | Navitas Semiconductor | | Technology | 4.32 | 29 | 1.17% | -3.03% |
| CCSI | Consensus Cloud | | Technology | 11.88 | 37 | 0.76% | -3.18% |
| MTTR | Matterport | | Technology | 4.57 | 68 | 1.44% | -3.18% |
| OLO | Olo | | Technology | 4.83 | 38 | -1.83% | -3.40% |
| IVAC | Intevac | | Technology | 4.24 | 83 | -0.93% | -3.42% |
| CCOI | Cogent | | Technology | 63.51 | 32 | -2.14% | -3.47% |
| ZETA | Zeta Global | | Technology | 12.44 | 65 | -1.31% | -3.53% |
| IIIV | i3 Verticals | | Technology | 22.26 | 36 | 0.04% | -3.64% |
| PWSC | PowerSchool | | Technology | 16.91 | 10 | 0.48% | -3.76% |
| KLTR | Kaltura | | Technology | 1.20 | 10 | -4.00% | -4.00% |
| UIS | Unisys | | Technology | 5.24 | 28 | 0.58% | -4.03% |
| BBAI | BigBear.ai | | Technology | 1.73 | 27 | 0.29% | -4.17% |
| XRX | Xerox | | Technology | 13.39 | 17 | 2.53% | -4.36% |
| NOTE | FiscalNote | | Technology | 1.31 | 32 | -2.24% | -4.38% |
| COMP | Compass | | Technology | 3.15 | 10 | 0.48% | -4.70% |
| VICR | Vicor | | Technology | 32.78 | 27 | 3.02% | -4.74% |
| SPT | Sprout Social | | Technology | 48.15 | 0 | -3.53% | -6.30% |
| MXL | MaxLinear | | Technology | 19.27 | 10 | 1.42% | -6.41% |
| AUR | Aurora Innovation | | Technology | 2.82 | 43 | -1.40% | -6.47% |
| VERI | Veritone | | Technology | 3.27 | 46 | 1.71% | -6.70% |
| RMNI | Rimini Street | | Technology | 2.61 | 0 | -5.43% | -6.79% |
| CMTL | Comtech Tele | | Technology | 1.91 | 27 | 3.80% | -6.83% |
| CNXN | PC Connection | | Technology | 59.29 | 0 | -4.31% | -6.91% |
| For chart view version of above stock list: Chart View ➞ 0 - 25 , 25 - 50 , 50 - 75 , 75 - 100 , 100 - 125 , 125 - 150 , 150 - 175 , 175 - 200 , 200 - 225 , 225 - 250 , 250 - 275 | ||
 | Click To Change The Sort Order: By Market Cap or Company Size Performance: Year-to-date, Week and Day |  |
| Too many stocks? View smallcap stocks filtered by marketcap & sector |
| Marketcap: All SmallCap Stocks (default-no microcap), Large, Mid-Range, Small |
| Smallcap Sector: Tech, Finance, Energy, Staples, Retail, Industrial, Materials, & Medical |
|
Get the most comprehensive stock market coverage daily at 12Stocks.com ➞ Best Stocks Today ➞ Best Stocks Weekly ➞ Best Stocks Year-to-Date ➞ Best Stocks Trends ➞  Best Stocks Today 12Stocks.com Best Nasdaq Stocks ➞ Best S&P 500 Stocks ➞ Best Tech Stocks ➞ Best Biotech Stocks ➞ |
| Detailed Overview of SmallCap Stocks |
| SmallCap Technical Overview, Leaders & Laggards, Top SmallCap ETF Funds & Detailed SmallCap Stocks List, Charts, Trends & More |
| Smallcap: Technical Analysis, Trends & YTD Performance | |
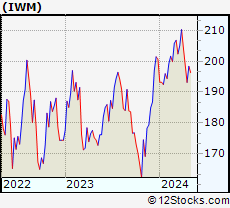
| SmallCap segment as represented by
IWM, an exchange-traded fund [ETF], holds basket of thousands of smallcap stocks from across all major sectors of the US stock market. The smallcap index (contains stocks like Riverbed & Sotheby's) is down by -0.39% and is currently underperforming the overall market by -6.01% year-to-date. Below is a quick view of technical charts and trends: | |
 IWM Weekly Chart |
|
| Long Term Trend: Not Good | |
| Medium Term Trend: Good | |
 IWM Daily Chart |
|
| Short Term Trend: Deteriorating | |
| Overall Trend Score: 49 | |
| YTD Performance: -0.39% | |
| **Trend Scores & Views Are Only For Educational Purposes And Not For Investing | |
| 12Stocks.com: Top Performing Small Cap Index Stocks | ||||||||||||||||||||||||||||||||||||||||||||||||
 The top performing Small Cap Index stocks year to date are
Now, more recently, over last week, the top performing Small Cap Index stocks on the move are


|
||||||||||||||||||||||||||||||||||||||||||||||||
| 12Stocks.com: Investing in Smallcap Index using Exchange Traded Funds | |
|
The following table shows list of key exchange traded funds (ETF) that
help investors track Smallcap index. The following list also includes leveraged ETF funds that track twice or thrice the daily returns of Smallcap indices. Short or inverse ETF funds move in the opposite direction to the index they track and are useful during market pullbacks or during bear markets. Quick View: Move mouse or cursor over ETF symbol (ticker) to view short-term technical chart and over ETF name to view long term chart. Click on ticker or stock name for detailed view. Click on to add stock symbol to your watchlist and to view watchlist. |
12Stocks.com List of ETFs that track Smallcap Index
| Ticker | ETF Name | Watchlist | Recent Price | Smart Investing & Trading Score | Change % | Week % | Year-to-date % |
| IWM | iShares Russell 2000 | | 199.92 | 49 | 1.84 | 0.77 | -0.39% |
| IJR | iShares Core S&P Small-Cap | | 106.33 | 50 | 1.52 | 0.64 | -1.77% |
| VTWO | Vanguard Russell 2000 ETF | | 80.85 | 42 | 1.88 | 0.79 | -0.31% |
| IWN | iShares Russell 2000 Value | | 152.88 | 75 | 2.04 | 1.15 | -1.58% |
| IWO | iShares Russell 2000 Growth | | 254.34 | 32 | 1.91 | 0.49 | 0.84% |
| IJS | iShares S&P Small-Cap 600 Value | | 98.02 | 43 | 1.68 | 0.85 | -4.9% |
| IJT | iShares S&P Small-Cap 600 Growth | | 126.72 | 63 | 1.42 | 0.5 | 1.26% |
| XSLV | PowerShares S&P SmallCap Low Volatil ETF | | 43.14 | 73 | 0.72 | 0.98 | -2.29% |
| SDD | ProShares UltraShort SmallCap600 | | 19.31 | 56 | -2.02 | -0.21 | 4.79% |
| SMLV | SPDR SSGA US Small Cap Low Volatil ETF | | 108.83 | 87 | 1.30 | 1.22 | -3.27% |
| SAA | ProShares Ultra SmallCap600 | | 22.93 | 42 | 1.56 | -0.46 | -8.08% |
| SBB | ProShares Short SmallCap600 | | 16.37 | 49 | -1.14 | -0.09 | 2.76% |
| 12Stocks.com: Charts, Trends, Fundamental Data and Performances of SmallCap Stocks | |
|
We now take in-depth look at all SmallCap stocks including charts, multi-period performances and overall trends (as measured by Smart Investing & Trading Score). One can sort SmallCap stocks (click link to choose) by Daily, Weekly and by Year-to-Date performances. Also, one can sort by size of the company or by market capitalization. |
| Select Your Default Chart Type: | |||||
| |||||
| Click on stock symbol or name for detailed view. Click on to add stock symbol to your watchlist and to view watchlist. Quick View: Move mouse or cursor over "Daily" to quickly view daily technical stock chart and over "Weekly" to view weekly technical stock chart. | |||||

 | DSP Viant Technology Inc. |
| Sector: Technology | |
| SubSector: Software - Application | |
| MarketCap: 279 Millions | |
| Recent Price: 8.08 Smart Investing & Trading Score: 10 | |
| Day Percent Change: -0.49% Day Change: -0.04 | |
| Week Change: -3% Year-to-date Change: 16.4% | |
| DSP Links: Profile News Message Board | |
| Charts:- Daily , Weekly | |
| Add DSP to Watchlist: View: Get Complete DSP Trend Analysis ➞ | |
 | FARO FARO Technologies, Inc. |
| Sector: Technology | |
| SubSector: Scientific & Technical Instruments | |
| MarketCap: 721.953 Millions | |
| Recent Price: 18.35 Smart Investing & Trading Score: 7 | |
| Day Percent Change: -2.86% Day Change: -0.54 | |
| Week Change: -3.01% Year-to-date Change: -18.6% | |
| FARO Links: Profile News Message Board | |
| Charts:- Daily , Weekly | |
| Add FARO to Watchlist: View: Get Complete FARO Trend Analysis ➞ | |
 | NVTS Navitas Semiconductor Corporation |
| Sector: Technology | |
| SubSector: Semiconductors | |
| MarketCap: 1790 Millions | |
| Recent Price: 4.32 Smart Investing & Trading Score: 29 | |
| Day Percent Change: 1.17% Day Change: 0.05 | |
| Week Change: -3.03% Year-to-date Change: -46.8% | |
| NVTS Links: Profile News Message Board | |
| Charts:- Daily , Weekly | |
| Add NVTS to Watchlist: View: Get Complete NVTS Trend Analysis ➞ | |
 | CCSI Consensus Cloud Solutions, Inc. |
| Sector: Technology | |
| SubSector: Software - Infrastructure | |
| MarketCap: 609 Millions | |
| Recent Price: 11.88 Smart Investing & Trading Score: 37 | |
| Day Percent Change: 0.76% Day Change: 0.09 | |
| Week Change: -3.18% Year-to-date Change: -55.4% | |
| CCSI Links: Profile News Message Board | |
| Charts:- Daily , Weekly | |
| Add CCSI to Watchlist: View: Get Complete CCSI Trend Analysis ➞ | |
 | MTTR Matterport, Inc. |
| Sector: Technology | |
| SubSector: Software - Application | |
| MarketCap: 920 Millions | |
| Recent Price: 4.57 Smart Investing & Trading Score: 68 | |
| Day Percent Change: 1.44% Day Change: 0.07 | |
| Week Change: -3.18% Year-to-date Change: 69.1% | |
| MTTR Links: Profile News Message Board | |
| Charts:- Daily , Weekly | |
| Add MTTR to Watchlist: View: Get Complete MTTR Trend Analysis ➞ | |
 | OLO Olo Inc. |
| Sector: Technology | |
| SubSector: Software - Application | |
| MarketCap: 1030 Millions | |
| Recent Price: 4.83 Smart Investing & Trading Score: 38 | |
| Day Percent Change: -1.83% Day Change: -0.09 | |
| Week Change: -3.4% Year-to-date Change: -15.6% | |
| OLO Links: Profile News Message Board | |
| Charts:- Daily , Weekly | |
| Add OLO to Watchlist: View: Get Complete OLO Trend Analysis ➞ | |
 | IVAC Intevac, Inc. |
| Sector: Technology | |
| SubSector: Diversified Electronics | |
| MarketCap: 89.2396 Millions | |
| Recent Price: 4.24 Smart Investing & Trading Score: 83 | |
| Day Percent Change: -0.93% Day Change: -0.04 | |
| Week Change: -3.42% Year-to-date Change: -1.9% | |
| IVAC Links: Profile News Message Board | |
| Charts:- Daily , Weekly | |
| Add IVAC to Watchlist: View: Get Complete IVAC Trend Analysis ➞ | |
 | CCOI Cogent Communications Holdings, Inc. |
| Sector: Technology | |
| SubSector: Diversified Communication Services | |
| MarketCap: 3868.14 Millions | |
| Recent Price: 63.51 Smart Investing & Trading Score: 32 | |
| Day Percent Change: -2.14% Day Change: -1.39 | |
| Week Change: -3.47% Year-to-date Change: -16.5% | |
| CCOI Links: Profile News Message Board | |
| Charts:- Daily , Weekly | |
| Add CCOI to Watchlist: View: Get Complete CCOI Trend Analysis ➞ | |
 | ZETA Zeta Global Holdings Corp. |
| Sector: Technology | |
| SubSector: Software - Application | |
| MarketCap: 1780 Millions | |
| Recent Price: 12.44 Smart Investing & Trading Score: 65 | |
| Day Percent Change: -1.31% Day Change: -0.16 | |
| Week Change: -3.53% Year-to-date Change: 40.9% | |
| ZETA Links: Profile News Message Board | |
| Charts:- Daily , Weekly | |
| Add ZETA to Watchlist: View: Get Complete ZETA Trend Analysis ➞ | |
 | IIIV i3 Verticals, Inc. |
| Sector: Technology | |
| SubSector: Business Software & Services | |
| MarketCap: 448.458 Millions | |
| Recent Price: 22.26 Smart Investing & Trading Score: 36 | |
| Day Percent Change: 0.04% Day Change: 0.01 | |
| Week Change: -3.64% Year-to-date Change: 5.2% | |
| IIIV Links: Profile News Message Board | |
| Charts:- Daily , Weekly | |
| Add IIIV to Watchlist: View: Get Complete IIIV Trend Analysis ➞ | |
 | PWSC PowerSchool Holdings, Inc. |
| Sector: Technology | |
| SubSector: Software - Application | |
| MarketCap: 3870 Millions | |
| Recent Price: 16.91 Smart Investing & Trading Score: 10 | |
| Day Percent Change: 0.48% Day Change: 0.08 | |
| Week Change: -3.76% Year-to-date Change: -28.5% | |
| PWSC Links: Profile News Message Board | |
| Charts:- Daily , Weekly | |
| Add PWSC to Watchlist: View: Get Complete PWSC Trend Analysis ➞ | |
 | KLTR Kaltura, Inc. |
| Sector: Technology | |
| SubSector: Software - Application | |
| MarketCap: 293 Millions | |
| Recent Price: 1.20 Smart Investing & Trading Score: 10 | |
| Day Percent Change: -4.00% Day Change: -0.05 | |
| Week Change: -4% Year-to-date Change: -38.8% | |
| KLTR Links: Profile News Message Board | |
| Charts:- Daily , Weekly | |
| Add KLTR to Watchlist: View: Get Complete KLTR Trend Analysis ➞ | |
 | UIS Unisys Corporation |
| Sector: Technology | |
| SubSector: Information Technology Services | |
| MarketCap: 803.868 Millions | |
| Recent Price: 5.24 Smart Investing & Trading Score: 28 | |
| Day Percent Change: 0.58% Day Change: 0.03 | |
| Week Change: -4.03% Year-to-date Change: -6.8% | |
| UIS Links: Profile News Message Board | |
| Charts:- Daily , Weekly | |
| Add UIS to Watchlist: View: Get Complete UIS Trend Analysis ➞ | |
 | BBAI BigBear.ai Holdings, Inc. |
| Sector: Technology | |
| SubSector: Information Technology Services | |
| MarketCap: 339 Millions | |
| Recent Price: 1.73 Smart Investing & Trading Score: 27 | |
| Day Percent Change: 0.29% Day Change: 0.01 | |
| Week Change: -4.17% Year-to-date Change: -19.0% | |
| BBAI Links: Profile News Message Board | |
| Charts:- Daily , Weekly | |
| Add BBAI to Watchlist: View: Get Complete BBAI Trend Analysis ➞ | |
 | XRX Xerox Holdings Corporation |
| Sector: Technology | |
| SubSector: Information Technology Services | |
| MarketCap: 4077.48 Millions | |
| Recent Price: 13.39 Smart Investing & Trading Score: 17 | |
| Day Percent Change: 2.53% Day Change: 0.33 | |
| Week Change: -4.36% Year-to-date Change: -27.0% | |
| XRX Links: Profile News Message Board | |
| Charts:- Daily , Weekly | |
| Add XRX to Watchlist: View: Get Complete XRX Trend Analysis ➞ | |
 | NOTE FiscalNote Holdings, Inc. |
| Sector: Technology | |
| SubSector: Information Technology Services | |
| MarketCap: 493 Millions | |
| Recent Price: 1.31 Smart Investing & Trading Score: 32 | |
| Day Percent Change: -2.24% Day Change: -0.03 | |
| Week Change: -4.38% Year-to-date Change: 12.0% | |
| NOTE Links: Profile News Message Board | |
| Charts:- Daily , Weekly | |
| Add NOTE to Watchlist: View: Get Complete NOTE Trend Analysis ➞ | |
 | COMP Compass, Inc. |
| Sector: Technology | |
| SubSector: Software - Application | |
| MarketCap: 1580 Millions | |
| Recent Price: 3.15 Smart Investing & Trading Score: 10 | |
| Day Percent Change: 0.48% Day Change: 0.02 | |
| Week Change: -4.7% Year-to-date Change: -15.6% | |
| COMP Links: Profile News Message Board | |
| Charts:- Daily , Weekly | |
| Add COMP to Watchlist: View: Get Complete COMP Trend Analysis ➞ | |
 | VICR Vicor Corporation |
| Sector: Technology | |
| SubSector: Diversified Electronics | |
| MarketCap: 1526.76 Millions | |
| Recent Price: 32.78 Smart Investing & Trading Score: 27 | |
| Day Percent Change: 3.02% Day Change: 0.96 | |
| Week Change: -4.74% Year-to-date Change: -27.1% | |
| VICR Links: Profile News Message Board | |
| Charts:- Daily , Weekly | |
| Add VICR to Watchlist: View: Get Complete VICR Trend Analysis ➞ | |
 | SPT Sprout Social, Inc. |
| Sector: Technology | |
| SubSector: Software Application | |
| MarketCap: 25087 Millions | |
| Recent Price: 48.15 Smart Investing & Trading Score: 0 | |
| Day Percent Change: -3.53% Day Change: -1.76 | |
| Week Change: -6.3% Year-to-date Change: -21.6% | |
| SPT Links: Profile News Message Board | |
| Charts:- Daily , Weekly | |
| Add SPT to Watchlist: View: Get Complete SPT Trend Analysis ➞ | |
 | MXL MaxLinear, Inc. |
| Sector: Technology | |
| SubSector: Semiconductor - Integrated Circuits | |
| MarketCap: 751.31 Millions | |
| Recent Price: 19.27 Smart Investing & Trading Score: 10 | |
| Day Percent Change: 1.42% Day Change: 0.27 | |
| Week Change: -6.41% Year-to-date Change: -18.9% | |
| MXL Links: Profile News Message Board | |
| Charts:- Daily , Weekly | |
| Add MXL to Watchlist: View: Get Complete MXL Trend Analysis ➞ | |
 | AUR Aurora Innovation, Inc. |
| Sector: Technology | |
| SubSector: Information Technology Services | |
| MarketCap: 3220 Millions | |
| Recent Price: 2.82 Smart Investing & Trading Score: 43 | |
| Day Percent Change: -1.40% Day Change: -0.04 | |
| Week Change: -6.47% Year-to-date Change: -36.0% | |
| AUR Links: Profile News Message Board | |
| Charts:- Daily , Weekly | |
| Add AUR to Watchlist: View: Get Complete AUR Trend Analysis ➞ | |
 | VERI Veritone, Inc. |
| Sector: Technology | |
| SubSector: Application Software | |
| MarketCap: 52.1662 Millions | |
| Recent Price: 3.27 Smart Investing & Trading Score: 46 | |
| Day Percent Change: 1.71% Day Change: 0.05 | |
| Week Change: -6.7% Year-to-date Change: 80.0% | |
| VERI Links: Profile News Message Board | |
| Charts:- Daily , Weekly | |
| Add VERI to Watchlist: View: Get Complete VERI Trend Analysis ➞ | |
 | RMNI Rimini Street, Inc. |
| Sector: Technology | |
| SubSector: Application Software | |
| MarketCap: 288.762 Millions | |
| Recent Price: 2.61 Smart Investing & Trading Score: 0 | |
| Day Percent Change: -5.43% Day Change: -0.15 | |
| Week Change: -6.79% Year-to-date Change: -20.2% | |
| RMNI Links: Profile News Message Board | |
| Charts:- Daily , Weekly | |
| Add RMNI to Watchlist: View: Get Complete RMNI Trend Analysis ➞ | |
 | CMTL Comtech Telecommunications Corp. |
| Sector: Technology | |
| SubSector: Communication Equipment | |
| MarketCap: 399.539 Millions | |
| Recent Price: 1.91 Smart Investing & Trading Score: 27 | |
| Day Percent Change: 3.80% Day Change: 0.07 | |
| Week Change: -6.83% Year-to-date Change: -77.3% | |
| CMTL Links: Profile News Message Board | |
| Charts:- Daily , Weekly | |
| Add CMTL to Watchlist: View: Get Complete CMTL Trend Analysis ➞ | |
 | CNXN PC Connection, Inc. |
| Sector: Technology | |
| SubSector: Computers Wholesale | |
| MarketCap: 1020.19 Millions | |
| Recent Price: 59.29 Smart Investing & Trading Score: 0 | |
| Day Percent Change: -4.31% Day Change: -2.67 | |
| Week Change: -6.91% Year-to-date Change: -11.8% | |
| CNXN Links: Profile News Message Board | |
| Charts:- Daily , Weekly | |
| Add CNXN to Watchlist: View: Get Complete CNXN Trend Analysis ➞ | |
| For tabular summary view of above stock list: Summary View ➞ 0 - 25 , 25 - 50 , 50 - 75 , 75 - 100 , 100 - 125 , 125 - 150 , 150 - 175 , 175 - 200 , 200 - 225 , 225 - 250 , 250 - 275 | ||
| Click To Change The Sort Order: By Market Cap or Company Size Performance: Year-to-date, Week and Day | |
| Select Chart Type: | ||
| Too many stocks? View smallcap stocks filtered by marketcap & sector |
| Marketcap: All SmallCap Stocks (default-no microcap), Large, Mid-Range, Small & MicroCap |
| Sector: Tech, Finance, Energy, Staples, Retail, Industrial, Materials, Utilities & Medical |
|
Best Stocks Today 12Stocks.com |
© 2024 12Stocks.com Terms & Conditions Privacy Contact Us
All Information Provided Only For Education And Not To Be Used For Investing or Trading. See Terms & Conditions


One More Thing ... Get Best Stocks Delivered Daily!
Never Ever Miss A Move With Our Top Ten Stocks Lists
Find Best Stocks In Any Market - Bull or Bear Market
Take A Peek At Our Top Ten Stocks Lists: Daily, Weekly, Year-to-Date & Top Trends
Find Best Stocks In Any Market - Bull or Bear Market
Take A Peek At Our Top Ten Stocks Lists: Daily, Weekly, Year-to-Date & Top Trends
Smallcap Stocks With Best Up Trends [0-bearish to 100-bullish]: Emergent BioSolutions[100], Aspen Aerogels[100], Carvana Co[100], Perdoceo Education[100], Gannett Co[100], Pitney Bowes[100], Benchmark Electronics[100], Origin Materials[100], FormFactor [100], Lantheus [100], Q2 [100]
Best Smallcap Stocks Year-to-Date:
Janux [440.16%], Viking [307.09%], Longboard [273.98%], Alpine Immune[239.29%], Bakkt [187.89%], Avidity Biosciences[182.96%], Vera [170.74%], Cullinan Oncology[169.74%], Super Micro[168.25%], Arcutis Bio[166.25%], Y-mAbs [152.93%] Best Smallcap Stocks This Week:
Deciphera [73.24%], Emergent BioSolutions[71.88%], Eyenovia [49.22%], Aspen Aerogels[48.14%], P3 Health[38.51%], Carvana Co[38.18%], Cue Biopharma[37.73%], Origin Materials[36.24%], TransMedics Group[35.14%], Seres [34.55%], Enovix [32.07%] Best Smallcap Stocks Daily:
Emergent BioSolutions[70.98%], Aspen Aerogels[56.70%], Carvana Co[33.77%], Perdoceo Education[31.46%], Enovix [31.06%], Office Properties[28.00%], Gannett Co[26.97%], Sunnova Energy[25.21%], Pitney Bowes[24.70%], Pulmonx [21.50%], CommScope Holding[20.95%]