
 Login Sign Up


| |||||
 |  | ||||

| 12Stocks.com Market Intelligence |
Best SmallCap Stocks
|
| In a hurry? Small Cap Stock Lists: Performance Trends Table, Stock Charts
Sort Small Cap stocks: Daily, Weekly, Year-to-Date, Market Cap & Trends. Filter Small Cap stocks list by sector: Show all, Tech, Finance, Energy, Staples, Retail, Industrial, Materials, Utilities and HealthCare Filter Small Cap stocks list by size: All Large Medium Small and MicroCap |
| 12Stocks.com Small Cap Stocks Performances & Trends Daily | |||||||||
|
|  The overall Smart Investing & Trading Score is 49 (0-bearish to 100-bullish) which puts Small Cap index in short term neutral trend. The Smart Investing & Trading Score from previous trading session is 14 and hence an improvement of trend.
| ||||||||
Here are the Smart Investing & Trading Scores of the most requested small cap stocks at 12Stocks.com (click stock name for detailed review):
|


| 12Stocks.com: Investing in Smallcap Index with Stocks | |
|
The following table helps investors and traders sort through current performance and trends (as measured by Smart Investing & Trading Score) of various
stocks in the Smallcap Index. Quick View: Move mouse or cursor over stock symbol (ticker) to view short-term technical chart and over stock name to view long term chart. Click on  to add stock symbol to your watchlist and to add stock symbol to your watchlist and  to view watchlist. Click on any ticker or stock name for detailed market intelligence report for that stock. to view watchlist. Click on any ticker or stock name for detailed market intelligence report for that stock. |
12Stocks.com Performance of Stocks in Smallcap Index
| Ticker | Stock Name | Watchlist | Category | Recent Price | Smart Investing & Trading Score | Change % | Weekly Change% |
| CRNC | Cerence |   | Technology | 9.74 | 17 | 4.84% | 0.31% |
| MKTW | MarketWise | | Technology | 1.61 | 57 | 1.26% | 0.31% |
| PDFS | PDF Solutions | | Technology | 31.13 | 34 | 3.56% | 0.29% |
| KODK | Eastman Kodak | | Technology | 4.53 | 15 | 2.26% | 0.22% |
| PRGS | Progress | | Technology | 50.44 | 35 | 0.66% | 0.20% |
| SNPO | Snap One | | Technology | 10.60 | 76 | 0.00% | 0.19% |
| NOVT | Novanta | | Technology | 159.65 | 12 | 1.83% | 0.15% |
| MSGE | Madison Square | | Technology | 39.48 | 83 | -0.20% | 0.15% |
| ESE | ESCO | | Technology | 105.48 | 83 | 3.24% | 0.13% |
| VIAV | Viavi Solutions | | Technology | 8.02 | 10 | 1.26% | 0.12% |
| PGNY | Progyny | | Technology | 32.07 | 0 | -0.68% | 0.09% |
| PRST | Presto Automation | | Technology | 0.17 | 10 | -0.59% | 0.06% |
| HCKT | Hackett Group | | Technology | 21.96 | 10 | 0.32% | 0.05% |
| LASR | nLIGHT | | Technology | 11.56 | 64 | 1.76% | 0.04% |
| GSAT | Globalstar | | Technology | 1.29 | 35 | 0.00% | 0.00% |
| TRUE | TrueCar | | Technology | 2.88 | 17 | 6.86% | 0.00% |
| ATOM | Atomera | | Technology | 4.45 | 0 | 1.14% | 0.00% |
| TGAN | Transphorm | | Technology | 4.86 | 47 | 0.62% | 0.00% |
| STER | Sterling Check | | Technology | 15.30 | 29 | 0.99% | -0.07% |
| AGYS | Agilysys | | Technology | 82.93 | 69 | 0.28% | -0.08% |
| NABL | N-able | | Technology | 12.39 | 34 | 0.65% | -0.08% |
| YOU | Clear Secure | | Technology | 17.52 | 18 | -0.11% | -0.11% |
| ATEX | Anterix | | Technology | 32.17 | 19 | 0.53% | -0.12% |
| SONO | Sonos | | Technology | 16.94 | 0 | 0.41% | -0.18% |
| VSH | Vishay Inter | | Technology | 22.59 | 68 | 1.62% | -0.18% |
| For chart view version of above stock list: Chart View ➞ 0 - 25 , 25 - 50 , 50 - 75 , 75 - 100 , 100 - 125 , 125 - 150 , 150 - 175 , 175 - 200 , 200 - 225 , 225 - 250 , 250 - 275 | ||
 | Click To Change The Sort Order: By Market Cap or Company Size Performance: Year-to-date, Week and Day |  |
| Too many stocks? View smallcap stocks filtered by marketcap & sector |
| Marketcap: All SmallCap Stocks (default-no microcap), Large, Mid-Range, Small |
| Smallcap Sector: Tech, Finance, Energy, Staples, Retail, Industrial, Materials, & Medical |
|
Get the most comprehensive stock market coverage daily at 12Stocks.com ➞ Best Stocks Today ➞ Best Stocks Weekly ➞ Best Stocks Year-to-Date ➞ Best Stocks Trends ➞  Best Stocks Today 12Stocks.com Best Nasdaq Stocks ➞ Best S&P 500 Stocks ➞ Best Tech Stocks ➞ Best Biotech Stocks ➞ |
| Detailed Overview of SmallCap Stocks |
| SmallCap Technical Overview, Leaders & Laggards, Top SmallCap ETF Funds & Detailed SmallCap Stocks List, Charts, Trends & More |
| Smallcap: Technical Analysis, Trends & YTD Performance | |
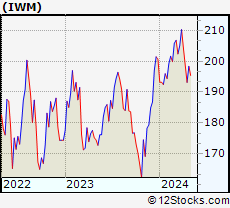
| SmallCap segment as represented by
IWM, an exchange-traded fund [ETF], holds basket of thousands of smallcap stocks from across all major sectors of the US stock market. The smallcap index (contains stocks like Riverbed & Sotheby's) is down by -0.39% and is currently underperforming the overall market by -6.01% year-to-date. Below is a quick view of technical charts and trends: | |
 IWM Weekly Chart |
|
| Long Term Trend: Not Good | |
| Medium Term Trend: Good | |
 IWM Daily Chart |
|
| Short Term Trend: Deteriorating | |
| Overall Trend Score: 49 | |
| YTD Performance: -0.39% | |
| **Trend Scores & Views Are Only For Educational Purposes And Not For Investing | |
| 12Stocks.com: Top Performing Small Cap Index Stocks | ||||||||||||||||||||||||||||||||||||||||||||||||
 The top performing Small Cap Index stocks year to date are
Now, more recently, over last week, the top performing Small Cap Index stocks on the move are


|
||||||||||||||||||||||||||||||||||||||||||||||||
| 12Stocks.com: Investing in Smallcap Index using Exchange Traded Funds | |
|
The following table shows list of key exchange traded funds (ETF) that
help investors track Smallcap index. The following list also includes leveraged ETF funds that track twice or thrice the daily returns of Smallcap indices. Short or inverse ETF funds move in the opposite direction to the index they track and are useful during market pullbacks or during bear markets. Quick View: Move mouse or cursor over ETF symbol (ticker) to view short-term technical chart and over ETF name to view long term chart. Click on ticker or stock name for detailed view. Click on to add stock symbol to your watchlist and to view watchlist. |
12Stocks.com List of ETFs that track Smallcap Index
| Ticker | ETF Name | Watchlist | Recent Price | Smart Investing & Trading Score | Change % | Week % | Year-to-date % |
| IWM | iShares Russell 2000 | | 199.92 | 49 | 1.84 | 0.77 | -0.39% |
| IJR | iShares Core S&P Small-Cap | | 106.33 | 50 | 1.52 | 0.64 | -1.77% |
| VTWO | Vanguard Russell 2000 ETF | | 80.85 | 7 | 1.88 | 0.79 | -0.31% |
| IWN | iShares Russell 2000 Value | | 152.88 | 57 | 2.04 | 1.15 | -1.58% |
| IWO | iShares Russell 2000 Growth | | 254.34 | 17 | 1.91 | 0.49 | 0.84% |
| IJS | iShares S&P Small-Cap 600 Value | | 98.02 | 13 | 1.68 | 0.85 | -4.9% |
| IJT | iShares S&P Small-Cap 600 Growth | | 126.72 | 20 | 1.42 | 0.5 | 1.26% |
| XSLV | PowerShares S&P SmallCap Low Volatil ETF | | 43.14 | 42 | 0.72 | 0.98 | -2.29% |
| SDD | ProShares UltraShort SmallCap600 | | 19.31 | 61 | -2.02 | -0.21 | 4.79% |
| SMLV | SPDR SSGA US Small Cap Low Volatil ETF | | 108.83 | 44 | 1.30 | 1.22 | -3.27% |
| SAA | ProShares Ultra SmallCap600 | | 22.93 | 32 | 1.56 | -0.46 | -8.08% |
| SBB | ProShares Short SmallCap600 | | 16.37 | 71 | -1.14 | -0.09 | 2.76% |
| 12Stocks.com: Charts, Trends, Fundamental Data and Performances of SmallCap Stocks | |
|
We now take in-depth look at all SmallCap stocks including charts, multi-period performances and overall trends (as measured by Smart Investing & Trading Score). One can sort SmallCap stocks (click link to choose) by Daily, Weekly and by Year-to-Date performances. Also, one can sort by size of the company or by market capitalization. |
| Select Your Default Chart Type: | |||||
| |||||
| Click on stock symbol or name for detailed view. Click on to add stock symbol to your watchlist and to view watchlist. Quick View: Move mouse or cursor over "Daily" to quickly view daily technical stock chart and over "Weekly" to view weekly technical stock chart. | |||||

 | CRNC Cerence Inc. |
| Sector: Technology | |
| SubSector: Application Software | |
| MarketCap: 640.662 Millions | |
| Recent Price: 9.74 Smart Investing & Trading Score: 17 | |
| Day Percent Change: 4.84% Day Change: 0.45 | |
| Week Change: 0.31% Year-to-date Change: -50.5% | |
| CRNC Links: Profile News Message Board | |
| Charts:- Daily , Weekly | |
| Add CRNC to Watchlist: View: Get Complete CRNC Trend Analysis ➞ | |
 | MKTW MarketWise, Inc. |
| Sector: Technology | |
| SubSector: Software - Application | |
| MarketCap: 646 Millions | |
| Recent Price: 1.61 Smart Investing & Trading Score: 57 | |
| Day Percent Change: 1.26% Day Change: 0.02 | |
| Week Change: 0.31% Year-to-date Change: -40.4% | |
| MKTW Links: Profile News Message Board | |
| Charts:- Daily , Weekly | |
| Add MKTW to Watchlist: View: Get Complete MKTW Trend Analysis ➞ | |
 | PDFS PDF Solutions, Inc. |
| Sector: Technology | |
| SubSector: Technical & System Software | |
| MarketCap: 345.1 Millions | |
| Recent Price: 31.13 Smart Investing & Trading Score: 34 | |
| Day Percent Change: 3.56% Day Change: 1.07 | |
| Week Change: 0.29% Year-to-date Change: -3.1% | |
| PDFS Links: Profile News Message Board | |
| Charts:- Daily , Weekly | |
| Add PDFS to Watchlist: View: Get Complete PDFS Trend Analysis ➞ | |
 | KODK Eastman Kodak Company |
| Sector: Technology | |
| SubSector: Electronic Equipment | |
| MarketCap: 78.47 Millions | |
| Recent Price: 4.53 Smart Investing & Trading Score: 15 | |
| Day Percent Change: 2.26% Day Change: 0.10 | |
| Week Change: 0.22% Year-to-date Change: 16.2% | |
| KODK Links: Profile News Message Board | |
| Charts:- Daily , Weekly | |
| Add KODK to Watchlist: View: Get Complete KODK Trend Analysis ➞ | |
 | PRGS Progress Software Corporation |
| Sector: Technology | |
| SubSector: Application Software | |
| MarketCap: 1407.22 Millions | |
| Recent Price: 50.44 Smart Investing & Trading Score: 35 | |
| Day Percent Change: 0.66% Day Change: 0.33 | |
| Week Change: 0.2% Year-to-date Change: -7.1% | |
| PRGS Links: Profile News Message Board | |
| Charts:- Daily , Weekly | |
| Add PRGS to Watchlist: View: Get Complete PRGS Trend Analysis ➞ | |
 | SNPO Snap One Holdings Corp. |
| Sector: Technology | |
| SubSector: Electronics & Computer Distribution | |
| MarketCap: 807 Millions | |
| Recent Price: 10.60 Smart Investing & Trading Score: 76 | |
| Day Percent Change: 0.00% Day Change: 0.00 | |
| Week Change: 0.19% Year-to-date Change: 14.1% | |
| SNPO Links: Profile News Message Board | |
| Charts:- Daily , Weekly | |
| Add SNPO to Watchlist: View: Get Complete SNPO Trend Analysis ➞ | |
 | NOVT Novanta Inc. |
| Sector: Technology | |
| SubSector: Scientific & Technical Instruments | |
| MarketCap: 2680.83 Millions | |
| Recent Price: 159.65 Smart Investing & Trading Score: 12 | |
| Day Percent Change: 1.83% Day Change: 2.87 | |
| Week Change: 0.15% Year-to-date Change: -5.2% | |
| NOVT Links: Profile News Message Board | |
| Charts:- Daily , Weekly | |
| Add NOVT to Watchlist: View: Get Complete NOVT Trend Analysis ➞ | |
 | MSGE Madison Square Garden Entertainment Corp. |
| Sector: Technology | |
| SubSector: Entertainment | |
| MarketCap: 18837 Millions | |
| Recent Price: 39.48 Smart Investing & Trading Score: 83 | |
| Day Percent Change: -0.20% Day Change: -0.08 | |
| Week Change: 0.15% Year-to-date Change: 24.1% | |
| MSGE Links: Profile News Message Board | |
| Charts:- Daily , Weekly | |
| Add MSGE to Watchlist: View: Get Complete MSGE Trend Analysis ➞ | |
 | ESE ESCO Technologies Inc. |
| Sector: Technology | |
| SubSector: Scientific & Technical Instruments | |
| MarketCap: 1968.03 Millions | |
| Recent Price: 105.48 Smart Investing & Trading Score: 83 | |
| Day Percent Change: 3.24% Day Change: 3.31 | |
| Week Change: 0.13% Year-to-date Change: -9.9% | |
| ESE Links: Profile News Message Board | |
| Charts:- Daily , Weekly | |
| Add ESE to Watchlist: View: Get Complete ESE Trend Analysis ➞ | |
 | VIAV Viavi Solutions Inc. |
| Sector: Technology | |
| SubSector: Communication Equipment | |
| MarketCap: 2653.29 Millions | |
| Recent Price: 8.02 Smart Investing & Trading Score: 10 | |
| Day Percent Change: 1.26% Day Change: 0.10 | |
| Week Change: 0.12% Year-to-date Change: -20.4% | |
| VIAV Links: Profile News Message Board | |
| Charts:- Daily , Weekly | |
| Add VIAV to Watchlist: View: Get Complete VIAV Trend Analysis ➞ | |
 | PGNY Progyny, Inc. |
| Sector: Technology | |
| SubSector: Healthcare Information Services | |
| MarketCap: 1839.05 Millions | |
| Recent Price: 32.07 Smart Investing & Trading Score: 0 | |
| Day Percent Change: -0.68% Day Change: -0.22 | |
| Week Change: 0.09% Year-to-date Change: -13.7% | |
| PGNY Links: Profile News Message Board | |
| Charts:- Daily , Weekly | |
| Add PGNY to Watchlist: View: Get Complete PGNY Trend Analysis ➞ | |
 | PRST Presto Automation Inc. |
| Sector: Technology | |
| SubSector: Software - Application | |
| MarketCap: 238 Millions | |
| Recent Price: 0.17 Smart Investing & Trading Score: 10 | |
| Day Percent Change: -0.59% Day Change: 0.00 | |
| Week Change: 0.06% Year-to-date Change: -68.0% | |
| PRST Links: Profile News Message Board | |
| Charts:- Daily , Weekly | |
| Add PRST to Watchlist: View: Get Complete PRST Trend Analysis ➞ | |
 | HCKT The Hackett Group, Inc. |
| Sector: Technology | |
| SubSector: Information Technology Services | |
| MarketCap: 334.468 Millions | |
| Recent Price: 21.96 Smart Investing & Trading Score: 10 | |
| Day Percent Change: 0.32% Day Change: 0.07 | |
| Week Change: 0.05% Year-to-date Change: -3.6% | |
| HCKT Links: Profile News Message Board | |
| Charts:- Daily , Weekly | |
| Add HCKT to Watchlist: View: Get Complete HCKT Trend Analysis ➞ | |
 | LASR nLIGHT, Inc. |
| Sector: Technology | |
| SubSector: Semiconductor - Broad Line | |
| MarketCap: 445.642 Millions | |
| Recent Price: 11.56 Smart Investing & Trading Score: 64 | |
| Day Percent Change: 1.76% Day Change: 0.20 | |
| Week Change: 0.04% Year-to-date Change: -14.4% | |
| LASR Links: Profile News Message Board | |
| Charts:- Daily , Weekly | |
| Add LASR to Watchlist: View: Get Complete LASR Trend Analysis ➞ | |
 | GSAT Globalstar, Inc. |
| Sector: Technology | |
| SubSector: Wireless Communications | |
| MarketCap: 485.127 Millions | |
| Recent Price: 1.29 Smart Investing & Trading Score: 35 | |
| Day Percent Change: 0.00% Day Change: 0.00 | |
| Week Change: 0% Year-to-date Change: -33.5% | |
| GSAT Links: Profile News Message Board | |
| Charts:- Daily , Weekly | |
| Add GSAT to Watchlist: View: Get Complete GSAT Trend Analysis ➞ | |
 | TRUE TrueCar, Inc. |
| Sector: Technology | |
| SubSector: Internet Service Providers | |
| MarketCap: 244.18 Millions | |
| Recent Price: 2.88 Smart Investing & Trading Score: 17 | |
| Day Percent Change: 6.86% Day Change: 0.19 | |
| Week Change: 0% Year-to-date Change: -16.8% | |
| TRUE Links: Profile News Message Board | |
| Charts:- Daily , Weekly | |
| Add TRUE to Watchlist: View: Get Complete TRUE Trend Analysis ➞ | |
 | ATOM Atomera Incorporated |
| Sector: Technology | |
| SubSector: Semiconductor Equipment & Materials | |
| MarketCap: 60.6918 Millions | |
| Recent Price: 4.45 Smart Investing & Trading Score: 0 | |
| Day Percent Change: 1.14% Day Change: 0.05 | |
| Week Change: 0% Year-to-date Change: -36.5% | |
| ATOM Links: Profile News Message Board | |
| Charts:- Daily , Weekly | |
| Add ATOM to Watchlist: View: Get Complete ATOM Trend Analysis ➞ | |
 | TGAN Transphorm, Inc. |
| Sector: Technology | |
| SubSector: Semiconductor Equipment & Materials | |
| MarketCap: 194 Millions | |
| Recent Price: 4.86 Smart Investing & Trading Score: 47 | |
| Day Percent Change: 0.62% Day Change: 0.03 | |
| Week Change: 0% Year-to-date Change: 32.6% | |
| TGAN Links: Profile News Message Board | |
| Charts:- Daily , Weekly | |
| Add TGAN to Watchlist: View: Get Complete TGAN Trend Analysis ➞ | |
 | STER Sterling Check Corp. |
| Sector: Technology | |
| SubSector: Software - Infrastructure | |
| MarketCap: 1180 Millions | |
| Recent Price: 15.30 Smart Investing & Trading Score: 29 | |
| Day Percent Change: 0.99% Day Change: 0.15 | |
| Week Change: -0.07% Year-to-date Change: 9.8% | |
| STER Links: Profile News Message Board | |
| Charts:- Daily , Weekly | |
| Add STER to Watchlist: View: Get Complete STER Trend Analysis ➞ | |
 | AGYS Agilysys, Inc. |
| Sector: Technology | |
| SubSector: Application Software | |
| MarketCap: 391.862 Millions | |
| Recent Price: 82.93 Smart Investing & Trading Score: 69 | |
| Day Percent Change: 0.28% Day Change: 0.23 | |
| Week Change: -0.08% Year-to-date Change: -2.2% | |
| AGYS Links: Profile News Message Board | |
| Charts:- Daily , Weekly | |
| Add AGYS to Watchlist: View: Get Complete AGYS Trend Analysis ➞ | |
 | NABL N-able, Inc. |
| Sector: Technology | |
| SubSector: Information Technology Services | |
| MarketCap: 2590 Millions | |
| Recent Price: 12.39 Smart Investing & Trading Score: 34 | |
| Day Percent Change: 0.65% Day Change: 0.08 | |
| Week Change: -0.08% Year-to-date Change: -6.9% | |
| NABL Links: Profile News Message Board | |
| Charts:- Daily , Weekly | |
| Add NABL to Watchlist: View: Get Complete NABL Trend Analysis ➞ | |
 | YOU Clear Secure, Inc. |
| Sector: Technology | |
| SubSector: Software - Application | |
| MarketCap: 3510 Millions | |
| Recent Price: 17.52 Smart Investing & Trading Score: 18 | |
| Day Percent Change: -0.11% Day Change: -0.02 | |
| Week Change: -0.11% Year-to-date Change: -15.4% | |
| YOU Links: Profile News Message Board | |
| Charts:- Daily , Weekly | |
| Add YOU to Watchlist: View: Get Complete YOU Trend Analysis ➞ | |
 | ATEX Anterix Inc. |
| Sector: Technology | |
| SubSector: Telecom Services - Domestic | |
| MarketCap: 694.077 Millions | |
| Recent Price: 32.17 Smart Investing & Trading Score: 19 | |
| Day Percent Change: 0.53% Day Change: 0.17 | |
| Week Change: -0.12% Year-to-date Change: -3.5% | |
| ATEX Links: Profile News Message Board | |
| Charts:- Daily , Weekly | |
| Add ATEX to Watchlist: View: Get Complete ATEX Trend Analysis ➞ | |
 | SONO Sonos, Inc. |
| Sector: Technology | |
| SubSector: Diversified Electronics | |
| MarketCap: 1047.96 Millions | |
| Recent Price: 16.94 Smart Investing & Trading Score: 0 | |
| Day Percent Change: 0.41% Day Change: 0.07 | |
| Week Change: -0.18% Year-to-date Change: -1.2% | |
| SONO Links: Profile News Message Board | |
| Charts:- Daily , Weekly | |
| Add SONO to Watchlist: View: Get Complete SONO Trend Analysis ➞ | |
 | VSH Vishay Intertechnology, Inc. |
| Sector: Technology | |
| SubSector: Semiconductor - Broad Line | |
| MarketCap: 2132.52 Millions | |
| Recent Price: 22.59 Smart Investing & Trading Score: 68 | |
| Day Percent Change: 1.62% Day Change: 0.36 | |
| Week Change: -0.18% Year-to-date Change: -5.8% | |
| VSH Links: Profile News Message Board | |
| Charts:- Daily , Weekly | |
| Add VSH to Watchlist: View: Get Complete VSH Trend Analysis ➞ | |
| For tabular summary view of above stock list: Summary View ➞ 0 - 25 , 25 - 50 , 50 - 75 , 75 - 100 , 100 - 125 , 125 - 150 , 150 - 175 , 175 - 200 , 200 - 225 , 225 - 250 , 250 - 275 | ||
| Click To Change The Sort Order: By Market Cap or Company Size Performance: Year-to-date, Week and Day | |
| Select Chart Type: | ||
| Too many stocks? View smallcap stocks filtered by marketcap & sector |
| Marketcap: All SmallCap Stocks (default-no microcap), Large, Mid-Range, Small & MicroCap |
| Sector: Tech, Finance, Energy, Staples, Retail, Industrial, Materials, Utilities & Medical |
|
Best Stocks Today 12Stocks.com |
© 2024 12Stocks.com Terms & Conditions Privacy Contact Us
All Information Provided Only For Education And Not To Be Used For Investing or Trading. See Terms & Conditions


One More Thing ... Get Best Stocks Delivered Daily!
Never Ever Miss A Move With Our Top Ten Stocks Lists
Find Best Stocks In Any Market - Bull or Bear Market
Take A Peek At Our Top Ten Stocks Lists: Daily, Weekly, Year-to-Date & Top Trends
Find Best Stocks In Any Market - Bull or Bear Market
Take A Peek At Our Top Ten Stocks Lists: Daily, Weekly, Year-to-Date & Top Trends
Smallcap Stocks With Best Up Trends [0-bearish to 100-bullish]: Emergent BioSolutions[100], Aspen Aerogels[100], Perdoceo Education[100], Gannett Co[100], Pitney Bowes[100], Benchmark Electronics[100], Origin Materials[100], FormFactor [100], Lantheus [100], Q2 [100], Blueprint Medicines[100]
Best Smallcap Stocks Year-to-Date:
Janux [440.16%], Viking [307.09%], Longboard [273.98%], Alpine Immune[239.29%], Bakkt [187.89%], Avidity Biosciences[182.96%], Vera [170.74%], Cullinan Oncology[169.74%], Super Micro[168.25%], Arcutis Bio[166.25%], Y-mAbs [152.93%] Best Smallcap Stocks This Week:
Deciphera [73.24%], Emergent BioSolutions[71.88%], Eyenovia [49.22%], Aspen Aerogels[48.14%], P3 Health[38.51%], Carvana Co[38.18%], Cue Biopharma[37.73%], Origin Materials[36.24%], TransMedics Group[35.14%], Seres [34.55%], Enovix [32.07%] Best Smallcap Stocks Daily:
Emergent BioSolutions[70.98%], Aspen Aerogels[56.70%], Carvana Co[33.77%], Perdoceo Education[31.46%], Enovix [31.06%], Office Properties[28.00%], Gannett Co[26.97%], Sunnova Energy[25.21%], Pitney Bowes[24.70%], Pulmonx [21.50%], CommScope Holding[20.95%]