
 Login Sign Up


| |||||
 |  | ||||

| 12Stocks.com Market Intelligence |
Best SmallCap Stocks
|
| In a hurry? Small Cap Stock Lists: Performance Trends Table, Stock Charts
Sort Small Cap stocks: Daily, Weekly, Year-to-Date, Market Cap & Trends. Filter Small Cap stocks list by sector: Show all, Tech, Finance, Energy, Staples, Retail, Industrial, Materials, Utilities and HealthCare Filter Small Cap stocks list by size: All Large Medium Small and MicroCap |
| 12Stocks.com Small Cap Stocks Performances & Trends Daily | |||||||||
|
|  The overall Smart Investing & Trading Score is 49 (0-bearish to 100-bullish) which puts Small Cap index in short term neutral trend. The Smart Investing & Trading Score from previous trading session is 14 and hence an improvement of trend.
| ||||||||
Here are the Smart Investing & Trading Scores of the most requested small cap stocks at 12Stocks.com (click stock name for detailed review):
|


| 12Stocks.com: Investing in Smallcap Index with Stocks | |
|
The following table helps investors and traders sort through current performance and trends (as measured by Smart Investing & Trading Score) of various
stocks in the Smallcap Index. Quick View: Move mouse or cursor over stock symbol (ticker) to view short-term technical chart and over stock name to view long term chart. Click on  to add stock symbol to your watchlist and to add stock symbol to your watchlist and  to view watchlist. Click on any ticker or stock name for detailed market intelligence report for that stock. to view watchlist. Click on any ticker or stock name for detailed market intelligence report for that stock. |
12Stocks.com Performance of Stocks in Smallcap Index
| Ticker | Stock Name | Watchlist | Category | Recent Price | Smart Investing & Trading Score | Change % | Weekly Change% |
| EYEN | Eyenovia |   | Health Care | 0.94 | 64 | 2.45% | 49.22% |
| RCKY | Rocky Brands | | Consumer Staples | 34.00 | 93 | 2.75% | 28.35% |
| ATNM | Actinium | | Health Care | 8.75 | 85 | 12.47% | 27.37% |
| ASRT | Assertio | | Health Care | 1.01 | 100 | 9.64% | 21.95% |
| CUTR | Cutera | | Health Care | 2.57 | 100 | 4.90% | 21.23% |
| BLNK | Blink Charging | | Services & Goods | 2.89 | 74 | 11.15% | 19.42% |
| EYPT | EyePoint | | Health Care | 19.94 | 49 | 10.53% | 19.04% |
| EOLS | Evolus | | Health Care | 13.22 | 69 | 4.75% | 15.66% |
| GRWG | GrowGeneration | | Materials | 2.54 | 95 | 3.67% | 14.41% |
| PDSB | PDS | | Health Care | 3.73 | 64 | 3.32% | 14.07% |
| KALV | KalVista | | Health Care | 12.17 | 57 | -0.08% | 12.89% |
| CLDX | Celldex | | Health Care | 40.86 | 74 | 3.84% | 12.56% |
| PLSE | Pulse Biosciences | | Health Care | 8.05 | 64 | 5.92% | 11.96% |
| LINC | Loln Educational | | Services & Goods | 11.23 | 95 | 4.47% | 11.08% |
| CELC | Celcuity | | Health Care | 17.66 | 58 | 8.34% | 10.93% |
| ASUR | Asure | | Technology | 7.96 | 74 | 6.70% | 9.49% |
| INOD | Innodata | | Technology | 6.48 | 57 | 7.82% | 9.46% |
| ACRS | Aclaris | | Health Care | 1.31 | 95 | 3.97% | 9.17% |
| LEU | Centrus Energy | | Materials | 45.07 | 90 | 4.67% | 8.42% |
| CFFI | C&F Financial | | Financials | 41.74 | 64 | 3.65% | 8.30% |
| TRVI | Trevi | | Health Care | 3.01 | 83 | 5.24% | 8.27% |
| CLFD | Clearfield | | Technology | 31.91 | 100 | 3.14% | 8.13% |
| RRGB | Red Robin | | Services & Goods | 7.52 | 63 | -0.27% | 7.28% |
| PLL | Piedmont Lithium | | Industrials | 13.04 | 59 | 7.77% | 7.15% |
| ALDX | Aldeyra | | Health Care | 4.21 | 81 | 0.24% | 7.12% |
| For chart view version of above stock list: Chart View ➞ 0 - 25 , 25 - 50 , 50 - 75 , 75 - 100 , 100 - 125 , 125 - 150 , 150 - 175 , 175 - 200 | ||
 | Click To Change The Sort Order: By Market Cap or Company Size Performance: Year-to-date, Week and Day |  |
| Too many stocks? View smallcap stocks filtered by marketcap & sector |
| Marketcap: All SmallCap Stocks (default-no microcap), Large, Mid-Range, Small |
| Smallcap Sector: Tech, Finance, Energy, Staples, Retail, Industrial, Materials, & Medical |
|
Get the most comprehensive stock market coverage daily at 12Stocks.com ➞ Best Stocks Today ➞ Best Stocks Weekly ➞ Best Stocks Year-to-Date ➞ Best Stocks Trends ➞  Best Stocks Today 12Stocks.com Best Nasdaq Stocks ➞ Best S&P 500 Stocks ➞ Best Tech Stocks ➞ Best Biotech Stocks ➞ |
| Detailed Overview of SmallCap Stocks |
| SmallCap Technical Overview, Leaders & Laggards, Top SmallCap ETF Funds & Detailed SmallCap Stocks List, Charts, Trends & More |
| Smallcap: Technical Analysis, Trends & YTD Performance | |
| SmallCap segment as represented by
IWM, an exchange-traded fund [ETF], holds basket of thousands of smallcap stocks from across all major sectors of the US stock market. The smallcap index (contains stocks like Riverbed & Sotheby's) is down by -0.39% and is currently underperforming the overall market by -6.01% year-to-date. Below is a quick view of technical charts and trends: | |
 IWM Weekly Chart |
|
| Long Term Trend: Not Good | |
| Medium Term Trend: Good | |
 IWM Daily Chart |
|
| Short Term Trend: Deteriorating | |
| Overall Trend Score: 49 | |
| YTD Performance: -0.39% | |
| **Trend Scores & Views Are Only For Educational Purposes And Not For Investing | |
| 12Stocks.com: Top Performing Small Cap Index Stocks | ||||||||||||||||||||||||||||||||||||||||||||||||
 The top performing Small Cap Index stocks year to date are
Now, more recently, over last week, the top performing Small Cap Index stocks on the move are


|
||||||||||||||||||||||||||||||||||||||||||||||||
| 12Stocks.com: Investing in Smallcap Index using Exchange Traded Funds | |
|
The following table shows list of key exchange traded funds (ETF) that
help investors track Smallcap index. The following list also includes leveraged ETF funds that track twice or thrice the daily returns of Smallcap indices. Short or inverse ETF funds move in the opposite direction to the index they track and are useful during market pullbacks or during bear markets. Quick View: Move mouse or cursor over ETF symbol (ticker) to view short-term technical chart and over ETF name to view long term chart. Click on ticker or stock name for detailed view. Click on to add stock symbol to your watchlist and to view watchlist. |
12Stocks.com List of ETFs that track Smallcap Index
| Ticker | ETF Name | Watchlist | Recent Price | Smart Investing & Trading Score | Change % | Week % | Year-to-date % |
| IWM | iShares Russell 2000 | | 199.92 | 49 | 1.84 | 0.77 | -0.39% |
| IJR | iShares Core S&P Small-Cap | | 106.33 | 50 | 1.52 | 0.64 | -1.77% |
| VTWO | Vanguard Russell 2000 ETF | | 80.85 | 42 | 1.88 | 0.79 | -0.31% |
| IWN | iShares Russell 2000 Value | | 152.88 | 75 | 2.04 | 1.15 | -1.58% |
| IWO | iShares Russell 2000 Growth | | 254.34 | 32 | 1.91 | 0.49 | 0.84% |
| IJS | iShares S&P Small-Cap 600 Value | | 98.02 | 43 | 1.68 | 0.85 | -4.9% |
| IJT | iShares S&P Small-Cap 600 Growth | | 126.72 | 63 | 1.42 | 0.5 | 1.26% |
| XSLV | PowerShares S&P SmallCap Low Volatil ETF | | 43.14 | 73 | 0.72 | 0.98 | -2.29% |
| SDD | ProShares UltraShort SmallCap600 | | 19.31 | 56 | -2.02 | -0.21 | 4.79% |
| SMLV | SPDR SSGA US Small Cap Low Volatil ETF | | 108.83 | 87 | 1.30 | 1.22 | -3.27% |
| SAA | ProShares Ultra SmallCap600 | | 22.93 | 42 | 1.56 | -0.46 | -8.08% |
| SBB | ProShares Short SmallCap600 | | 16.37 | 49 | -1.14 | -0.09 | 2.76% |
| 12Stocks.com: Charts, Trends, Fundamental Data and Performances of SmallCap Stocks | |
|
We now take in-depth look at all SmallCap stocks including charts, multi-period performances and overall trends (as measured by Smart Investing & Trading Score). One can sort SmallCap stocks (click link to choose) by Daily, Weekly and by Year-to-Date performances. Also, one can sort by size of the company or by market capitalization. |
| Select Your Default Chart Type: | |||||
| |||||
| Click on stock symbol or name for detailed view. Click on to add stock symbol to your watchlist and to view watchlist. Quick View: Move mouse or cursor over "Daily" to quickly view daily technical stock chart and over "Weekly" to view weekly technical stock chart. | |||||

 | EYEN Eyenovia, Inc. |
| Sector: Health Care | |
| SubSector: Biotechnology | |
| MarketCap: 52.2785 Millions | |
| Recent Price: 0.94 Smart Investing & Trading Score: 64 | |
| Day Percent Change: 2.45% Day Change: 0.02 | |
| Week Change: 49.22% Year-to-date Change: -55.2% | |
| EYEN Links: Profile News Message Board | |
| Charts:- Daily , Weekly | |
| Add EYEN to Watchlist: View: Get Complete EYEN Trend Analysis ➞ | |
 | RCKY Rocky Brands, Inc. |
| Sector: Consumer Staples | |
| SubSector: Textile - Apparel Footwear & Accessories | |
| MarketCap: 137.47 Millions | |
| Recent Price: 34.00 Smart Investing & Trading Score: 93 | |
| Day Percent Change: 2.75% Day Change: 0.91 | |
| Week Change: 28.35% Year-to-date Change: 12.7% | |
| RCKY Links: Profile News Message Board | |
| Charts:- Daily , Weekly | |
| Add RCKY to Watchlist: View: Get Complete RCKY Trend Analysis ➞ | |
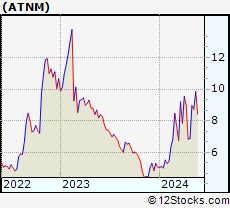 | ATNM Actinium Pharmaceuticals, Inc. |
| Sector: Health Care | |
| SubSector: Biotechnology | |
| MarketCap: 34.6785 Millions | |
| Recent Price: 8.75 Smart Investing & Trading Score: 85 | |
| Day Percent Change: 12.47% Day Change: 0.97 | |
| Week Change: 27.37% Year-to-date Change: 72.2% | |
| ATNM Links: Profile News Message Board | |
| Charts:- Daily , Weekly | |
| Add ATNM to Watchlist: View: Get Complete ATNM Trend Analysis ➞ | |
 | ASRT Assertio Therapeutics, Inc. |
| Sector: Health Care | |
| SubSector: Drugs - Generic | |
| MarketCap: 65.8185 Millions | |
| Recent Price: 1.01 Smart Investing & Trading Score: 100 | |
| Day Percent Change: 9.64% Day Change: 0.09 | |
| Week Change: 21.95% Year-to-date Change: -6.5% | |
| ASRT Links: Profile News Message Board | |
| Charts:- Daily , Weekly | |
| Add ASRT to Watchlist: View: Get Complete ASRT Trend Analysis ➞ | |
 | CUTR Cutera, Inc. |
| Sector: Health Care | |
| SubSector: Medical Appliances & Equipment | |
| MarketCap: 143.68 Millions | |
| Recent Price: 2.57 Smart Investing & Trading Score: 100 | |
| Day Percent Change: 4.90% Day Change: 0.12 | |
| Week Change: 21.23% Year-to-date Change: -27.1% | |
| CUTR Links: Profile News Message Board | |
| Charts:- Daily , Weekly | |
| Add CUTR to Watchlist: View: Get Complete CUTR Trend Analysis ➞ | |
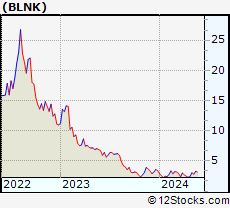 | BLNK Blink Charging Co. |
| Sector: Services & Goods | |
| SubSector: Business Services | |
| MarketCap: 44.4782 Millions | |
| Recent Price: 2.89 Smart Investing & Trading Score: 74 | |
| Day Percent Change: 11.15% Day Change: 0.29 | |
| Week Change: 19.42% Year-to-date Change: -14.8% | |
| BLNK Links: Profile News Message Board | |
| Charts:- Daily , Weekly | |
| Add BLNK to Watchlist: View: Get Complete BLNK Trend Analysis ➞ | |
 | EYPT EyePoint Pharmaceuticals, Inc. |
| Sector: Health Care | |
| SubSector: Biotechnology | |
| MarketCap: 125.085 Millions | |
| Recent Price: 19.94 Smart Investing & Trading Score: 49 | |
| Day Percent Change: 10.53% Day Change: 1.90 | |
| Week Change: 19.04% Year-to-date Change: -13.7% | |
| EYPT Links: Profile News Message Board | |
| Charts:- Daily , Weekly | |
| Add EYPT to Watchlist: View: Get Complete EYPT Trend Analysis ➞ | |
 | EOLS Evolus, Inc. |
| Sector: Health Care | |
| SubSector: Drugs - Generic | |
| MarketCap: 145.885 Millions | |
| Recent Price: 13.22 Smart Investing & Trading Score: 69 | |
| Day Percent Change: 4.75% Day Change: 0.60 | |
| Week Change: 15.66% Year-to-date Change: 25.6% | |
| EOLS Links: Profile News Message Board | |
| Charts:- Daily , Weekly | |
| Add EOLS to Watchlist: View: Get Complete EOLS Trend Analysis ➞ | |
 | GRWG GrowGeneration Corp. |
| Sector: Materials | |
| SubSector: Agricultural Chemicals | |
| MarketCap: 118.429 Millions | |
| Recent Price: 2.54 Smart Investing & Trading Score: 95 | |
| Day Percent Change: 3.67% Day Change: 0.09 | |
| Week Change: 14.41% Year-to-date Change: 1.2% | |
| GRWG Links: Profile News Message Board | |
| Charts:- Daily , Weekly | |
| Add GRWG to Watchlist: View: Get Complete GRWG Trend Analysis ➞ | |
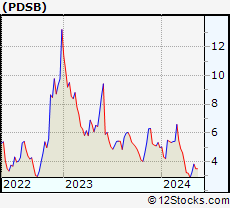 | PDSB PDS Biotechnology Corporation |
| Sector: Health Care | |
| SubSector: Biotechnology | |
| MarketCap: 9.72785 Millions | |
| Recent Price: 3.73 Smart Investing & Trading Score: 64 | |
| Day Percent Change: 3.32% Day Change: 0.12 | |
| Week Change: 14.07% Year-to-date Change: -25.2% | |
| PDSB Links: Profile News Message Board | |
| Charts:- Daily , Weekly | |
| Add PDSB to Watchlist: View: Get Complete PDSB Trend Analysis ➞ | |
 | KALV KalVista Pharmaceuticals, Inc. |
| Sector: Health Care | |
| SubSector: Biotechnology | |
| MarketCap: 138.385 Millions | |
| Recent Price: 12.17 Smart Investing & Trading Score: 57 | |
| Day Percent Change: -0.08% Day Change: -0.01 | |
| Week Change: 12.89% Year-to-date Change: -0.7% | |
| KALV Links: Profile News Message Board | |
| Charts:- Daily , Weekly | |
| Add KALV to Watchlist: View: Get Complete KALV Trend Analysis ➞ | |
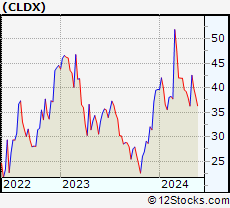 | CLDX Celldex Therapeutics, Inc. |
| Sector: Health Care | |
| SubSector: Biotechnology | |
| MarketCap: 29.8785 Millions | |
| Recent Price: 40.86 Smart Investing & Trading Score: 74 | |
| Day Percent Change: 3.84% Day Change: 1.51 | |
| Week Change: 12.56% Year-to-date Change: 3.0% | |
| CLDX Links: Profile News Message Board | |
| Charts:- Daily , Weekly | |
| Add CLDX to Watchlist: View: Get Complete CLDX Trend Analysis ➞ | |
 | PLSE Pulse Biosciences, Inc. |
| Sector: Health Care | |
| SubSector: Medical Instruments & Supplies | |
| MarketCap: 131.96 Millions | |
| Recent Price: 8.05 Smart Investing & Trading Score: 64 | |
| Day Percent Change: 5.92% Day Change: 0.45 | |
| Week Change: 11.96% Year-to-date Change: -34.2% | |
| PLSE Links: Profile News Message Board | |
| Charts:- Daily , Weekly | |
| Add PLSE to Watchlist: View: Get Complete PLSE Trend Analysis ➞ | |
 | LINC Lincoln Educational Services Corporation |
| Sector: Services & Goods | |
| SubSector: Education & Training Services | |
| MarketCap: 59.5006 Millions | |
| Recent Price: 11.23 Smart Investing & Trading Score: 95 | |
| Day Percent Change: 4.47% Day Change: 0.48 | |
| Week Change: 11.08% Year-to-date Change: 11.9% | |
| LINC Links: Profile News Message Board | |
| Charts:- Daily , Weekly | |
| Add LINC to Watchlist: View: Get Complete LINC Trend Analysis ➞ | |
 | CELC Celcuity Inc. |
| Sector: Health Care | |
| SubSector: Medical Laboratories & Research | |
| MarketCap: 70.53 Millions | |
| Recent Price: 17.66 Smart Investing & Trading Score: 58 | |
| Day Percent Change: 8.34% Day Change: 1.36 | |
| Week Change: 10.93% Year-to-date Change: 20.5% | |
| CELC Links: Profile News Message Board | |
| Charts:- Daily , Weekly | |
| Add CELC to Watchlist: View: Get Complete CELC Trend Analysis ➞ | |
 | ASUR Asure Software, Inc. |
| Sector: Technology | |
| SubSector: Business Software & Services | |
| MarketCap: 103.758 Millions | |
| Recent Price: 7.96 Smart Investing & Trading Score: 74 | |
| Day Percent Change: 6.70% Day Change: 0.50 | |
| Week Change: 9.49% Year-to-date Change: -16.4% | |
| ASUR Links: Profile News Message Board | |
| Charts:- Daily , Weekly | |
| Add ASUR to Watchlist: View: Get Complete ASUR Trend Analysis ➞ | |
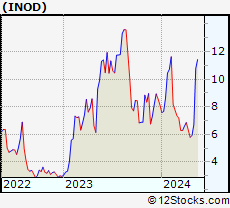 | INOD Innodata Inc. |
| Sector: Technology | |
| SubSector: Information Technology Services | |
| MarketCap: 19.9468 Millions | |
| Recent Price: 6.48 Smart Investing & Trading Score: 57 | |
| Day Percent Change: 7.82% Day Change: 0.47 | |
| Week Change: 9.46% Year-to-date Change: -20.4% | |
| INOD Links: Profile News Message Board | |
| Charts:- Daily , Weekly | |
| Add INOD to Watchlist: View: Get Complete INOD Trend Analysis ➞ | |
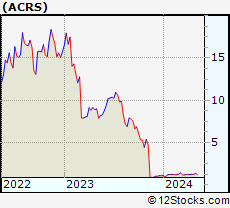 | ACRS Aclaris Therapeutics, Inc. |
| Sector: Health Care | |
| SubSector: Biotechnology | |
| MarketCap: 38.0785 Millions | |
| Recent Price: 1.31 Smart Investing & Trading Score: 95 | |
| Day Percent Change: 3.97% Day Change: 0.05 | |
| Week Change: 9.17% Year-to-date Change: 24.8% | |
| ACRS Links: Profile News Message Board | |
| Charts:- Daily , Weekly | |
| Add ACRS to Watchlist: View: Get Complete ACRS Trend Analysis ➞ | |
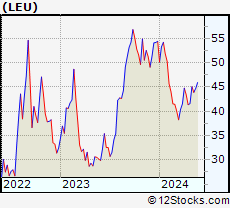 | LEU Centrus Energy Corp. |
| Sector: Materials | |
| SubSector: Industrial Metals & Minerals | |
| MarketCap: 41.191 Millions | |
| Recent Price: 45.07 Smart Investing & Trading Score: 90 | |
| Day Percent Change: 4.67% Day Change: 2.01 | |
| Week Change: 8.42% Year-to-date Change: -17.2% | |
| LEU Links: Profile News Message Board | |
| Charts:- Daily , Weekly | |
| Add LEU to Watchlist: View: Get Complete LEU Trend Analysis ➞ | |
 | CFFI C&F Financial Corporation |
| Sector: Financials | |
| SubSector: Regional - Mid-Atlantic Banks | |
| MarketCap: 145.559 Millions | |
| Recent Price: 41.74 Smart Investing & Trading Score: 64 | |
| Day Percent Change: 3.65% Day Change: 1.47 | |
| Week Change: 8.3% Year-to-date Change: -38.8% | |
| CFFI Links: Profile News Message Board | |
| Charts:- Daily , Weekly | |
| Add CFFI to Watchlist: View: Get Complete CFFI Trend Analysis ➞ | |
 | TRVI Trevi Therapeutics, Inc. |
| Sector: Health Care | |
| SubSector: Biotechnology | |
| MarketCap: 50.6785 Millions | |
| Recent Price: 3.01 Smart Investing & Trading Score: 83 | |
| Day Percent Change: 5.24% Day Change: 0.15 | |
| Week Change: 8.27% Year-to-date Change: 124.6% | |
| TRVI Links: Profile News Message Board | |
| Charts:- Daily , Weekly | |
| Add TRVI to Watchlist: View: Get Complete TRVI Trend Analysis ➞ | |
 | CLFD Clearfield, Inc. |
| Sector: Technology | |
| SubSector: Communication Equipment | |
| MarketCap: 138.439 Millions | |
| Recent Price: 31.91 Smart Investing & Trading Score: 100 | |
| Day Percent Change: 3.14% Day Change: 0.97 | |
| Week Change: 8.13% Year-to-date Change: 9.7% | |
| CLFD Links: Profile News Message Board | |
| Charts:- Daily , Weekly | |
| Add CLFD to Watchlist: View: Get Complete CLFD Trend Analysis ➞ | |
 | RRGB Red Robin Gourmet Burgers, Inc. |
| Sector: Services & Goods | |
| SubSector: Restaurants | |
| MarketCap: 121.57 Millions | |
| Recent Price: 7.52 Smart Investing & Trading Score: 63 | |
| Day Percent Change: -0.27% Day Change: -0.02 | |
| Week Change: 7.28% Year-to-date Change: -39.7% | |
| RRGB Links: Profile News Message Board | |
| Charts:- Daily , Weekly | |
| Add RRGB to Watchlist: View: Get Complete RRGB Trend Analysis ➞ | |
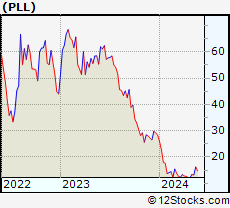 | PLL Piedmont Lithium Limited |
| Sector: Industrials | |
| SubSector: Diversified Machinery | |
| MarketCap: 36.2016 Millions | |
| Recent Price: 13.04 Smart Investing & Trading Score: 59 | |
| Day Percent Change: 7.77% Day Change: 0.94 | |
| Week Change: 7.15% Year-to-date Change: -53.9% | |
| PLL Links: Profile News Message Board | |
| Charts:- Daily , Weekly | |
| Add PLL to Watchlist: View: Get Complete PLL Trend Analysis ➞ | |
 | ALDX Aldeyra Therapeutics, Inc. |
| Sector: Health Care | |
| SubSector: Biotechnology | |
| MarketCap: 61.2785 Millions | |
| Recent Price: 4.21 Smart Investing & Trading Score: 81 | |
| Day Percent Change: 0.24% Day Change: 0.01 | |
| Week Change: 7.12% Year-to-date Change: 19.9% | |
| ALDX Links: Profile News Message Board | |
| Charts:- Daily , Weekly | |
| Add ALDX to Watchlist: View: Get Complete ALDX Trend Analysis ➞ | |
| For tabular summary view of above stock list: Summary View ➞ 0 - 25 , 25 - 50 , 50 - 75 , 75 - 100 , 100 - 125 , 125 - 150 , 150 - 175 , 175 - 200 | ||
| Click To Change The Sort Order: By Market Cap or Company Size Performance: Year-to-date, Week and Day | |
| Select Chart Type: | ||
| Too many stocks? View smallcap stocks filtered by marketcap & sector |
| Marketcap: All SmallCap Stocks (default-no microcap), Large, Mid-Range, Small & MicroCap |
| Sector: Tech, Finance, Energy, Staples, Retail, Industrial, Materials, Utilities & Medical |
|
Best Stocks Today 12Stocks.com |
© 2024 12Stocks.com Terms & Conditions Privacy Contact Us
All Information Provided Only For Education And Not To Be Used For Investing or Trading. See Terms & Conditions


One More Thing ... Get Best Stocks Delivered Daily!
Never Ever Miss A Move With Our Top Ten Stocks Lists
Find Best Stocks In Any Market - Bull or Bear Market
Take A Peek At Our Top Ten Stocks Lists: Daily, Weekly, Year-to-Date & Top Trends
Find Best Stocks In Any Market - Bull or Bear Market
Take A Peek At Our Top Ten Stocks Lists: Daily, Weekly, Year-to-Date & Top Trends
Smallcap Stocks With Best Up Trends [0-bearish to 100-bullish]: Emergent BioSolutions[100], Aspen Aerogels[100], Carvana Co[100], Perdoceo Education[100], Gannett Co[100], Pitney Bowes[100], Benchmark Electronics[100], Origin Materials[100], FormFactor [100], Lantheus [100], Q2 [100]
Best Smallcap Stocks Year-to-Date:
Janux [440.16%], Viking [307.09%], Longboard [273.98%], Alpine Immune[239.29%], Bakkt [187.89%], Avidity Biosciences[182.96%], Vera [170.74%], Cullinan Oncology[169.74%], Super Micro[168.25%], Arcutis Bio[166.25%], Y-mAbs [152.93%] Best Smallcap Stocks This Week:
Deciphera [73.24%], Emergent BioSolutions[71.88%], Eyenovia [49.22%], Aspen Aerogels[48.14%], P3 Health[38.51%], Carvana Co[38.18%], Cue Biopharma[37.73%], Origin Materials[36.24%], TransMedics Group[35.14%], Seres [34.55%], Enovix [32.07%] Best Smallcap Stocks Daily:
Emergent BioSolutions[70.98%], Aspen Aerogels[56.70%], Carvana Co[33.77%], Perdoceo Education[31.46%], Enovix [31.06%], Office Properties[28.00%], Gannett Co[26.97%], Sunnova Energy[25.21%], Pitney Bowes[24.70%], Pulmonx [21.50%], CommScope Holding[20.95%]