
 Login Sign Up


| |||||
 |  | ||||

| 12Stocks.com Market Intelligence |
Best SmallCap Stocks
|
| In a hurry? Small Cap Stock Lists: Performance Trends Table, Stock Charts
Sort Small Cap stocks: Daily, Weekly, Year-to-Date, Market Cap & Trends. Filter Small Cap stocks list by sector: Show all, Tech, Finance, Energy, Staples, Retail, Industrial, Materials, Utilities and HealthCare Filter Small Cap stocks list by size: All Large Medium Small and MicroCap |
| 12Stocks.com Small Cap Stocks Performances & Trends Daily | |||||||||
|
|  The overall Smart Investing & Trading Score is 88 (0-bearish to 100-bullish) which puts Small Cap index in short term bullish trend. The Smart Investing & Trading Score from previous trading session is 56 and hence an improvement of trend.
| ||||||||
Here are the Smart Investing & Trading Scores of the most requested small cap stocks at 12Stocks.com (click stock name for detailed review):
|


| 12Stocks.com: Investing in Smallcap Index with Stocks | |
|
The following table helps investors and traders sort through current performance and trends (as measured by Smart Investing & Trading Score) of various
stocks in the Smallcap Index. Quick View: Move mouse or cursor over stock symbol (ticker) to view short-term technical chart and over stock name to view long term chart. Click on  to add stock symbol to your watchlist and to add stock symbol to your watchlist and  to view watchlist. Click on any ticker or stock name for detailed market intelligence report for that stock. to view watchlist. Click on any ticker or stock name for detailed market intelligence report for that stock. |
12Stocks.com Performance of Stocks in Smallcap Index
| Ticker | Stock Name | Watchlist | Category | Recent Price | Smart Investing & Trading Score | Change % | Weekly Change% |
| VRRM | Verra Mobility |   | Services & Goods | 24.35 | 63 | 0.50% | 0.50% |
| PRCT | PROCEPT BioRobotics | | Health Care | 52.05 | 53 | 0.50% | 0.50% |
| IGT | Game | | Services & Goods | 20.40 | 57 | 0.49% | 0.49% |
| AWR | American States | | Utilities | 70.25 | 62 | 0.49% | 0.49% |
| ALG | Alamo Group | | Industrials | 199.50 | 17 | 0.49% | 0.49% |
| PLOW | Douglas Dynamics | | Consumer Staples | 22.49 | 64 | 0.49% | 0.49% |
| PBI | Pitney Bowes | | Consumer Staples | 4.15 | 57 | 0.48% | 0.48% |
| AVA | Avista | | Utilities | 35.72 | 88 | 0.48% | 0.48% |
| ATRO | Astronics | | Industrials | 16.66 | 25 | 0.48% | 0.48% |
| TWO | Two Harbors | | Financials | 12.59 | 90 | 0.48% | 0.48% |
| ATGE | Adtalem Global | | Services & Goods | 49.92 | 64 | 0.48% | 0.48% |
| AFRI | Forafric Global | | Consumer Staples | 10.48 | 73 | 0.48% | 0.48% |
| KRT | Karat Packaging | | Services & Goods | 27.44 | 65 | 0.48% | 0.48% |
| SYNA | Synaptics | | Technology | 89.68 | 49 | 0.47% | 0.47% |
| VZIO | VIZIO Holding | | Technology | 10.80 | 65 | 0.47% | 0.47% |
| FELE | Franklin Electric | | Industrials | 103.24 | 83 | 0.46% | 0.46% |
| SIGA | SIGA | | Health Care | 8.83 | 90 | 0.46% | 0.46% |
| CBNK | Capital Bancorp | | Financials | 19.67 | 42 | 0.46% | 0.46% |
| PFSI | PennyMac Financial | | Financials | 87.40 | 7 | 0.46% | 0.46% |
| JXN | Jackson Financial | | Financials | 69.88 | 69 | 0.46% | 0.46% |
| NSIT | Insight Enterprises | | Technology | 183.57 | 62 | 0.45% | 0.45% |
| APOG | Apogee Enterprises | | Industrials | 62.33 | 88 | 0.45% | 0.45% |
| TCBI | Texas Capital | | Financials | 58.07 | 42 | 0.45% | 0.45% |
| AXGN | AxoGen | | Health Care | 6.66 | 27 | 0.45% | 0.45% |
| CDZI | Cadiz | | Utilities | 2.26 | 17 | 0.44% | 0.44% |


| Too many stocks? View smallcap stocks filtered by marketcap & sector |
| Marketcap: All SmallCap Stocks (default-no microcap), Large, Mid-Range, Small |
| Smallcap Sector: Tech, Finance, Energy, Staples, Retail, Industrial, Materials, & Medical |
|
Get the most comprehensive stock market coverage daily at 12Stocks.com ➞ Best Stocks Today ➞ Best Stocks Weekly ➞ Best Stocks Year-to-Date ➞ Best Stocks Trends ➞  Best Stocks Today 12Stocks.com Best Nasdaq Stocks ➞ Best S&P 500 Stocks ➞ Best Tech Stocks ➞ Best Biotech Stocks ➞ |
| Detailed Overview of SmallCap Stocks |
| SmallCap Technical Overview, Leaders & Laggards, Top SmallCap ETF Funds & Detailed SmallCap Stocks List, Charts, Trends & More |
| Smallcap: Technical Analysis, Trends & YTD Performance | |
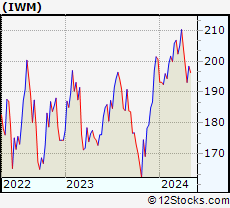
| SmallCap segment as represented by
IWM, an exchange-traded fund [ETF], holds basket of thousands of smallcap stocks from across all major sectors of the US stock market. The smallcap index (contains stocks like Riverbed & Sotheby's) is down by -0.37% and is currently underperforming the overall market by -6.93% year-to-date. Below is a quick view of technical charts and trends: | |
 IWM Weekly Chart |
|
| Long Term Trend: Very Good | |
| Medium Term Trend: Good | |
 IWM Daily Chart |
|
| Short Term Trend: Very Good | |
| Overall Trend Score: 88 | |
| YTD Performance: -0.37% | |
| **Trend Scores & Views Are Only For Educational Purposes And Not For Investing | |
| 12Stocks.com: Top Performing Small Cap Index Stocks | ||||||||||||||||||||||||||||||||||||||||||||||||
 The top performing Small Cap Index stocks year to date are
Now, more recently, over last week, the top performing Small Cap Index stocks on the move are


|
||||||||||||||||||||||||||||||||||||||||||||||||
| 12Stocks.com: Investing in Smallcap Index using Exchange Traded Funds | |
|
The following table shows list of key exchange traded funds (ETF) that
help investors track Smallcap index. The following list also includes leveraged ETF funds that track twice or thrice the daily returns of Smallcap indices. Short or inverse ETF funds move in the opposite direction to the index they track and are useful during market pullbacks or during bear markets. Quick View: Move mouse or cursor over ETF symbol (ticker) to view short-term technical chart and over ETF name to view long term chart. Click on ticker or stock name for detailed view. Click on to add stock symbol to your watchlist and to view watchlist. |
12Stocks.com List of ETFs that track Smallcap Index
| Ticker | ETF Name | Watchlist | Recent Price | Smart Investing & Trading Score | Change % | Week % | Year-to-date % |
| IWM | iShares Russell 2000 | | 199.96 | 88 | 0.79 | 0.79 | -0.37% |
| IJR | iShares Core S&P Small-Cap | | 106.41 | 93 | 0.72 | 0.72 | -1.7% |
| VTWO | Vanguard Russell 2000 ETF | | 80.78 | 88 | 0.70 | 0.7 | -0.39% |
| IWN | iShares Russell 2000 Value | | 152.05 | 93 | 0.60 | 0.6 | -2.11% |
| IWO | iShares Russell 2000 Growth | | 255.74 | 78 | 1.05 | 1.05 | 1.4% |
| IJS | iShares S&P Small-Cap 600 Value | | 97.95 | 70 | 0.78 | 0.78 | -4.97% |
| IJT | iShares S&P Small-Cap 600 Growth | | 126.96 | 88 | 0.69 | 0.69 | 1.45% |
| XSLV | PowerShares S&P SmallCap Low Volatil ETF | | 42.87 | 80 | 0.35 | 0.35 | -2.9% |
| SMLV | SPDR SSGA US Small Cap Low Volatil ETF | | 107.77 | 68 | 0.23 | 0.23 | -4.22% |
| SAA | ProShares Ultra SmallCap600 | | 23.27 | 88 | 1.00 | 1 | -6.73% |
| SBB | ProShares Short SmallCap600 | | 16.28 | 8 | -0.64 | -0.64 | 2.2% |
| SDD | ProShares UltraShort SmallCap600 | | 19.09 | 15 | -1.34 | -1.34 | 3.6% |
| 12Stocks.com: Charts, Trends, Fundamental Data and Performances of SmallCap Stocks | |
|
We now take in-depth look at all SmallCap stocks including charts, multi-period performances and overall trends (as measured by Smart Investing & Trading Score). One can sort SmallCap stocks (click link to choose) by Daily, Weekly and by Year-to-Date performances. Also, one can sort by size of the company or by market capitalization. |
| Select Your Default Chart Type: | |||||
| |||||
| Click on stock symbol or name for detailed view. Click on to add stock symbol to your watchlist and to view watchlist. Quick View: Move mouse or cursor over "Daily" to quickly view daily technical stock chart and over "Weekly" to view weekly technical stock chart. | |||||

 | VRRM Verra Mobility Corporation |
| Sector: Services & Goods | |
| SubSector: Security & Protection Services | |
| MarketCap: 1265.03 Millions | |
| Recent Price: 24.35 Smart Investing & Trading Score: 63 | |
| Day Percent Change: 0.50% Day Change: 0.12 | |
| Week Change: 0.5% Year-to-date Change: 5.7% | |
| VRRM Links: Profile News Message Board | |
| Charts:- Daily , Weekly | |
| Add VRRM to Watchlist: View: Get Complete VRRM Trend Analysis ➞ | |
 | PRCT PROCEPT BioRobotics Corporation |
| Sector: Health Care | |
| SubSector: Medical Devices | |
| MarketCap: 1600 Millions | |
| Recent Price: 52.05 Smart Investing & Trading Score: 53 | |
| Day Percent Change: 0.50% Day Change: 0.26 | |
| Week Change: 0.5% Year-to-date Change: 22.9% | |
| PRCT Links: Profile News Message Board | |
| Charts:- Daily , Weekly | |
| Add PRCT to Watchlist: View: Get Complete PRCT Trend Analysis ➞ | |
 | IGT International Game Technology PLC |
| Sector: Services & Goods | |
| SubSector: Gaming Activities | |
| MarketCap: 1030.89 Millions | |
| Recent Price: 20.40 Smart Investing & Trading Score: 57 | |
| Day Percent Change: 0.49% Day Change: 0.10 | |
| Week Change: 0.49% Year-to-date Change: -25.6% | |
| IGT Links: Profile News Message Board | |
| Charts:- Daily , Weekly | |
| Add IGT to Watchlist: View: Get Complete IGT Trend Analysis ➞ | |
 | AWR American States Water Company |
| Sector: Utilities | |
| SubSector: Water Utilities | |
| MarketCap: 3519.12 Millions | |
| Recent Price: 70.25 Smart Investing & Trading Score: 62 | |
| Day Percent Change: 0.49% Day Change: 0.34 | |
| Week Change: 0.49% Year-to-date Change: -12.7% | |
| AWR Links: Profile News Message Board | |
| Charts:- Daily , Weekly | |
| Add AWR to Watchlist: View: Get Complete AWR Trend Analysis ➞ | |
 | ALG Alamo Group Inc. |
| Sector: Industrials | |
| SubSector: Farm & Construction Machinery | |
| MarketCap: 964.107 Millions | |
| Recent Price: 199.50 Smart Investing & Trading Score: 17 | |
| Day Percent Change: 0.49% Day Change: 0.98 | |
| Week Change: 0.49% Year-to-date Change: -5.1% | |
| ALG Links: Profile News Message Board | |
| Charts:- Daily , Weekly | |
| Add ALG to Watchlist: View: Get Complete ALG Trend Analysis ➞ | |
 | PLOW Douglas Dynamics, Inc. |
| Sector: Consumer Staples | |
| SubSector: Auto Parts | |
| MarketCap: 654.739 Millions | |
| Recent Price: 22.49 Smart Investing & Trading Score: 64 | |
| Day Percent Change: 0.49% Day Change: 0.11 | |
| Week Change: 0.49% Year-to-date Change: -24.2% | |
| PLOW Links: Profile News Message Board | |
| Charts:- Daily , Weekly | |
| Add PLOW to Watchlist: View: Get Complete PLOW Trend Analysis ➞ | |
 | PBI Pitney Bowes Inc. |
| Sector: Consumer Staples | |
| SubSector: Business Equipment | |
| MarketCap: 408.067 Millions | |
| Recent Price: 4.15 Smart Investing & Trading Score: 57 | |
| Day Percent Change: 0.48% Day Change: 0.02 | |
| Week Change: 0.48% Year-to-date Change: -5.7% | |
| PBI Links: Profile News Message Board | |
| Charts:- Daily , Weekly | |
| Add PBI to Watchlist: View: Get Complete PBI Trend Analysis ➞ | |
 | AVA Avista Corporation |
| Sector: Utilities | |
| SubSector: Diversified Utilities | |
| MarketCap: 2755.7 Millions | |
| Recent Price: 35.72 Smart Investing & Trading Score: 88 | |
| Day Percent Change: 0.48% Day Change: 0.17 | |
| Week Change: 0.48% Year-to-date Change: -0.1% | |
| AVA Links: Profile News Message Board | |
| Charts:- Daily , Weekly | |
| Add AVA to Watchlist: View: Get Complete AVA Trend Analysis ➞ | |
 | ATRO Astronics Corporation |
| Sector: Industrials | |
| SubSector: Aerospace/Defense Products & Services | |
| MarketCap: 287.201 Millions | |
| Recent Price: 16.66 Smart Investing & Trading Score: 25 | |
| Day Percent Change: 0.48% Day Change: 0.08 | |
| Week Change: 0.48% Year-to-date Change: -4.4% | |
| ATRO Links: Profile News Message Board | |
| Charts:- Daily , Weekly | |
| Add ATRO to Watchlist: View: Get Complete ATRO Trend Analysis ➞ | |
 | TWO Two Harbors Investment Corp. |
| Sector: Financials | |
| SubSector: Mortgage Investment | |
| MarketCap: 1979.59 Millions | |
| Recent Price: 12.59 Smart Investing & Trading Score: 90 | |
| Day Percent Change: 0.48% Day Change: 0.06 | |
| Week Change: 0.48% Year-to-date Change: -9.6% | |
| TWO Links: Profile News Message Board | |
| Charts:- Daily , Weekly | |
| Add TWO to Watchlist: View: Get Complete TWO Trend Analysis ➞ | |
 | ATGE Adtalem Global Education Inc. |
| Sector: Services & Goods | |
| SubSector: Education & Training Services | |
| MarketCap: 1273.86 Millions | |
| Recent Price: 49.92 Smart Investing & Trading Score: 64 | |
| Day Percent Change: 0.48% Day Change: 0.24 | |
| Week Change: 0.48% Year-to-date Change: -15.3% | |
| ATGE Links: Profile News Message Board | |
| Charts:- Daily , Weekly | |
| Add ATGE to Watchlist: View: Get Complete ATGE Trend Analysis ➞ | |
 | AFRI Forafric Global PLC |
| Sector: Consumer Staples | |
| SubSector: Farm Products | |
| MarketCap: 295 Millions | |
| Recent Price: 10.48 Smart Investing & Trading Score: 73 | |
| Day Percent Change: 0.48% Day Change: 0.05 | |
| Week Change: 0.48% Year-to-date Change: -1.0% | |
| AFRI Links: Profile News Message Board | |
| Charts:- Daily , Weekly | |
| Add AFRI to Watchlist: View: Get Complete AFRI Trend Analysis ➞ | |
 | KRT Karat Packaging Inc. |
| Sector: Services & Goods | |
| SubSector: Packaging & Containers | |
| MarketCap: 357 Millions | |
| Recent Price: 27.44 Smart Investing & Trading Score: 65 | |
| Day Percent Change: 0.48% Day Change: 0.13 | |
| Week Change: 0.48% Year-to-date Change: 10.2% | |
| KRT Links: Profile News Message Board | |
| Charts:- Daily , Weekly | |
| Add KRT to Watchlist: View: Get Complete KRT Trend Analysis ➞ | |
 | SYNA Synaptics Incorporated |
| Sector: Technology | |
| SubSector: Application Software | |
| MarketCap: 1822.82 Millions | |
| Recent Price: 89.68 Smart Investing & Trading Score: 49 | |
| Day Percent Change: 0.47% Day Change: 0.42 | |
| Week Change: 0.47% Year-to-date Change: -21.4% | |
| SYNA Links: Profile News Message Board | |
| Charts:- Daily , Weekly | |
| Add SYNA to Watchlist: View: Get Complete SYNA Trend Analysis ➞ | |
 | VZIO VIZIO Holding Corp. |
| Sector: Technology | |
| SubSector: Consumer Electronics | |
| MarketCap: 1300 Millions | |
| Recent Price: 10.80 Smart Investing & Trading Score: 65 | |
| Day Percent Change: 0.47% Day Change: 0.05 | |
| Week Change: 0.47% Year-to-date Change: 40.1% | |
| VZIO Links: Profile News Message Board | |
| Charts:- Daily , Weekly | |
| Add VZIO to Watchlist: View: Get Complete VZIO Trend Analysis ➞ | |
 | FELE Franklin Electric Co., Inc. |
| Sector: Industrials | |
| SubSector: Industrial Electrical Equipment | |
| MarketCap: 2397.89 Millions | |
| Recent Price: 103.24 Smart Investing & Trading Score: 83 | |
| Day Percent Change: 0.46% Day Change: 0.47 | |
| Week Change: 0.46% Year-to-date Change: 6.8% | |
| FELE Links: Profile News Message Board | |
| Charts:- Daily , Weekly | |
| Add FELE to Watchlist: View: Get Complete FELE Trend Analysis ➞ | |
 | SIGA SIGA Technologies, Inc. |
| Sector: Health Care | |
| SubSector: Biotechnology | |
| MarketCap: 424.285 Millions | |
| Recent Price: 8.83 Smart Investing & Trading Score: 90 | |
| Day Percent Change: 0.46% Day Change: 0.04 | |
| Week Change: 0.46% Year-to-date Change: 57.7% | |
| SIGA Links: Profile News Message Board | |
| Charts:- Daily , Weekly | |
| Add SIGA to Watchlist: View: Get Complete SIGA Trend Analysis ➞ | |
 | CBNK Capital Bancorp, Inc. |
| Sector: Financials | |
| SubSector: Savings & Loans | |
| MarketCap: 174.93 Millions | |
| Recent Price: 19.67 Smart Investing & Trading Score: 42 | |
| Day Percent Change: 0.46% Day Change: 0.09 | |
| Week Change: 0.46% Year-to-date Change: -18.7% | |
| CBNK Links: Profile News Message Board | |
| Charts:- Daily , Weekly | |
| Add CBNK to Watchlist: View: Get Complete CBNK Trend Analysis ➞ | |
 | PFSI PennyMac Financial Services, Inc. |
| Sector: Financials | |
| SubSector: Mortgage Investment | |
| MarketCap: 1588.09 Millions | |
| Recent Price: 87.40 Smart Investing & Trading Score: 7 | |
| Day Percent Change: 0.46% Day Change: 0.40 | |
| Week Change: 0.46% Year-to-date Change: -1.1% | |
| PFSI Links: Profile News Message Board | |
| Charts:- Daily , Weekly | |
| Add PFSI to Watchlist: View: Get Complete PFSI Trend Analysis ➞ | |
 | JXN Jackson Financial Inc. |
| Sector: Financials | |
| SubSector: Insurance - Life | |
| MarketCap: 2460 Millions | |
| Recent Price: 69.88 Smart Investing & Trading Score: 69 | |
| Day Percent Change: 0.46% Day Change: 0.32 | |
| Week Change: 0.46% Year-to-date Change: 36.0% | |
| JXN Links: Profile News Message Board | |
| Charts:- Daily , Weekly | |
| Add JXN to Watchlist: View: Get Complete JXN Trend Analysis ➞ | |
 | NSIT Insight Enterprises, Inc. |
| Sector: Technology | |
| SubSector: Information Technology Services | |
| MarketCap: 1498.48 Millions | |
| Recent Price: 183.57 Smart Investing & Trading Score: 62 | |
| Day Percent Change: 0.45% Day Change: 0.82 | |
| Week Change: 0.45% Year-to-date Change: 3.6% | |
| NSIT Links: Profile News Message Board | |
| Charts:- Daily , Weekly | |
| Add NSIT to Watchlist: View: Get Complete NSIT Trend Analysis ➞ | |
 | APOG Apogee Enterprises, Inc. |
| Sector: Industrials | |
| SubSector: General Building Materials | |
| MarketCap: 510.653 Millions | |
| Recent Price: 62.33 Smart Investing & Trading Score: 88 | |
| Day Percent Change: 0.45% Day Change: 0.28 | |
| Week Change: 0.45% Year-to-date Change: 16.7% | |
| APOG Links: Profile News Message Board | |
| Charts:- Daily , Weekly | |
| Add APOG to Watchlist: View: Get Complete APOG Trend Analysis ➞ | |
 | TCBI Texas Capital Bancshares, Inc. |
| Sector: Financials | |
| SubSector: Regional - Southwest Banks | |
| MarketCap: 1202.75 Millions | |
| Recent Price: 58.07 Smart Investing & Trading Score: 42 | |
| Day Percent Change: 0.45% Day Change: 0.26 | |
| Week Change: 0.45% Year-to-date Change: -10.2% | |
| TCBI Links: Profile News Message Board | |
| Charts:- Daily , Weekly | |
| Add TCBI to Watchlist: View: Get Complete TCBI Trend Analysis ➞ | |
 | AXGN AxoGen, Inc. |
| Sector: Health Care | |
| SubSector: Medical Appliances & Equipment | |
| MarketCap: 349.28 Millions | |
| Recent Price: 6.66 Smart Investing & Trading Score: 27 | |
| Day Percent Change: 0.45% Day Change: 0.03 | |
| Week Change: 0.45% Year-to-date Change: -2.5% | |
| AXGN Links: Profile News Message Board | |
| Charts:- Daily , Weekly | |
| Add AXGN to Watchlist: View: Get Complete AXGN Trend Analysis ➞ | |
 | CDZI Cadiz Inc. |
| Sector: Utilities | |
| SubSector: Water Utilities | |
| MarketCap: 265.502 Millions | |
| Recent Price: 2.26 Smart Investing & Trading Score: 17 | |
| Day Percent Change: 0.44% Day Change: 0.01 | |
| Week Change: 0.44% Year-to-date Change: -19.3% | |
| CDZI Links: Profile News Message Board | |
| Charts:- Daily , Weekly | |
| Add CDZI to Watchlist: View: Get Complete CDZI Trend Analysis ➞ | |
| Too many stocks? View smallcap stocks filtered by marketcap & sector |
| Marketcap: All SmallCap Stocks (default-no microcap), Large, Mid-Range, Small & MicroCap |
| Sector: Tech, Finance, Energy, Staples, Retail, Industrial, Materials, Utilities & Medical |
|
Best Stocks Today 12Stocks.com |
© 2024 12Stocks.com Terms & Conditions Privacy Contact Us
All Information Provided Only For Education And Not To Be Used For Investing or Trading. See Terms & Conditions


One More Thing ... Get Best Stocks Delivered Daily!
Never Ever Miss A Move With Our Top Ten Stocks Lists
Find Best Stocks In Any Market - Bull or Bear Market
Take A Peek At Our Top Ten Stocks Lists: Daily, Weekly, Year-to-Date & Top Trends
Find Best Stocks In Any Market - Bull or Bear Market
Take A Peek At Our Top Ten Stocks Lists: Daily, Weekly, Year-to-Date & Top Trends
Smallcap Stocks With Best Up Trends [0-bearish to 100-bullish]: Bakkt [100], Deciphera [100], Phibro Animal[100], Heartland Financial[100], PTC [100], Sight Sciences[100], Richardson Electronics[100], Fulton Financial[100], TPI Composites[100], Cullinan Oncology[100], Lands [100]
Best Smallcap Stocks Year-to-Date:
CareMax [580.41%], Janux [421.92%], Bakkt [346.64%], Viking [305.75%], Longboard [247.46%], Alpine Immune[239.81%], Super Micro[213.22%], Avidity Biosciences[173.23%], Arcutis Bio[171.83%], Vera [167.31%], Cullinan Oncology[166.01%] Best Smallcap Stocks This Week:
Deciphera [72.56%], Phibro Animal[31.81%], Vaxxinity [31.65%], Zevia PBC[20.94%], Velo3D [19.97%], Acrivon [18.2%], Janux [18.18%], MultiPlan [15.53%], Heartland Financial[15.15%], Codexis [14.66%], Eyenovia [13.37%] Best Smallcap Stocks Daily:
Bakkt [2391.87%], Deciphera [72.56%], Phibro Animal[31.81%], Vaxxinity [31.65%], Zevia PBC[20.94%], Velo3D [19.97%], Acrivon [18.20%], Janux [18.18%], MultiPlan [15.53%], Heartland Financial[15.15%], Codexis [14.66%]