
 Login Sign Up


| |||||
 |  | ||||

| 12Stocks.com Market Intelligence |
Best SmallCap Stocks
|
| In a hurry? Small Cap Stock Lists: Performance Trends Table, Stock Charts
Sort Small Cap stocks: Daily, Weekly, Year-to-Date, Market Cap & Trends. Filter Small Cap stocks list by sector: Show all, Tech, Finance, Energy, Staples, Retail, Industrial, Materials, Utilities and HealthCare Filter Small Cap stocks list by size: All Large Medium Small and MicroCap |
| 12Stocks.com Small Cap Stocks Performances & Trends Daily | |||||||||
|
|  The overall Smart Investing & Trading Score is 88 (0-bearish to 100-bullish) which puts Small Cap index in short term bullish trend. The Smart Investing & Trading Score from previous trading session is 56 and hence an improvement of trend.
| ||||||||
Here are the Smart Investing & Trading Scores of the most requested small cap stocks at 12Stocks.com (click stock name for detailed review):
|


| 12Stocks.com: Investing in Smallcap Index with Stocks | |
|
The following table helps investors and traders sort through current performance and trends (as measured by Smart Investing & Trading Score) of various
stocks in the Smallcap Index. Quick View: Move mouse or cursor over stock symbol (ticker) to view short-term technical chart and over stock name to view long term chart. Click on  to add stock symbol to your watchlist and to add stock symbol to your watchlist and  to view watchlist. Click on any ticker or stock name for detailed market intelligence report for that stock. to view watchlist. Click on any ticker or stock name for detailed market intelligence report for that stock. |
12Stocks.com Performance of Stocks in Smallcap Index
| Ticker | Stock Name | Watchlist | Category | Recent Price | Smart Investing & Trading Score | Change % | Weekly Change% |
| NTLA | Intellia |   | Health Care | 21.98 | 52 | 5.88% | 5.88% |
| CSTL | Castle Biosciences | | Health Care | 21.53 | 74 | 5.85% | 5.85% |
| TNGX | Tango | | Health Care | 7.87 | 39 | 5.78% | 5.78% |
| CMAX | CareMax | | Health Care | 3.30 | 43 | 5.77% | 5.77% |
| TRVI | Trevi | | Health Care | 2.94 | 75 | 5.76% | 5.76% |
| TMDX | TransMedics Group | | Health Care | 97.25 | 100 | 5.61% | 5.61% |
| ADPT | Adaptive Bio | | Health Care | 2.75 | 54 | 5.58% | 5.58% |
| CLPR | Clipper Realty | | Financials | 4.19 | 34 | 5.54% | 5.54% |
| PIII | P3 Health | | Health Care | 0.47 | 50 | 5.47% | 5.47% |
| XNCR | Xencor | | Health Care | 21.07 | 100 | 5.46% | 5.46% |
| EWTX | Edgewise | | Health Care | 17.05 | 69 | 5.41% | 5.41% |
| YMAB | Y-mAbs | | Health Care | 15.50 | 70 | 5.37% | 5.37% |
| SKYT | SkyWater | | Technology | 10.26 | 95 | 5.34% | 5.34% |
| MED | Medifast | | Services & Goods | 35.51 | 74 | 5.34% | 5.34% |
| TNYA | Tenaya | | Health Care | 4.54 | 85 | 5.34% | 5.34% |
| VCYT | Veracyte | | Health Care | 20.34 | 57 | 5.33% | 5.33% |
| EYPT | EyePoint | | Health Care | 17.63 | 42 | 5.25% | 5.25% |
| GLUE | Monte Rosa | | Health Care | 5.61 | 63 | 5.25% | 5.25% |
| ZURA | Zura Bio | | Health Care | 4.64 | 100 | 5.22% | 5.22% |
| CDLX | Cardlytics | | Technology | 12.95 | 68 | 5.20% | 5.20% |
| DM | Dominion Midstream | | Energy | 0.86 | 32 | 5.19% | 5.19% |
| HCAT | Health Catalyst | | Technology | 6.34 | 64 | 5.14% | 5.14% |
| EAF | GrafTech | | Industrials | 1.66 | 64 | 5.06% | 5.06% |
| NGVT | Ingevity | | Materials | 50.95 | 100 | 5.03% | 5.03% |
| BYND | Beyond Meat | | Consumer Staples | 6.72 | 95 | 5.00% | 5.00% |


| Too many stocks? View smallcap stocks filtered by marketcap & sector |
| Marketcap: All SmallCap Stocks (default-no microcap), Large, Mid-Range, Small |
| Smallcap Sector: Tech, Finance, Energy, Staples, Retail, Industrial, Materials, & Medical |
|
Get the most comprehensive stock market coverage daily at 12Stocks.com ➞ Best Stocks Today ➞ Best Stocks Weekly ➞ Best Stocks Year-to-Date ➞ Best Stocks Trends ➞  Best Stocks Today 12Stocks.com Best Nasdaq Stocks ➞ Best S&P 500 Stocks ➞ Best Tech Stocks ➞ Best Biotech Stocks ➞ |
| Detailed Overview of SmallCap Stocks |
| SmallCap Technical Overview, Leaders & Laggards, Top SmallCap ETF Funds & Detailed SmallCap Stocks List, Charts, Trends & More |
| Smallcap: Technical Analysis, Trends & YTD Performance | |
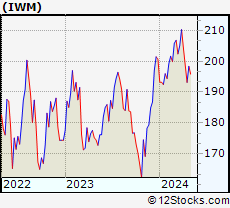
| SmallCap segment as represented by
IWM, an exchange-traded fund [ETF], holds basket of thousands of smallcap stocks from across all major sectors of the US stock market. The smallcap index (contains stocks like Riverbed & Sotheby's) is down by -0.37% and is currently underperforming the overall market by -6.93% year-to-date. Below is a quick view of technical charts and trends: | |
 IWM Weekly Chart |
|
| Long Term Trend: Very Good | |
| Medium Term Trend: Good | |
 IWM Daily Chart |
|
| Short Term Trend: Very Good | |
| Overall Trend Score: 88 | |
| YTD Performance: -0.37% | |
| **Trend Scores & Views Are Only For Educational Purposes And Not For Investing | |
| 12Stocks.com: Top Performing Small Cap Index Stocks | ||||||||||||||||||||||||||||||||||||||||||||||||
 The top performing Small Cap Index stocks year to date are
Now, more recently, over last week, the top performing Small Cap Index stocks on the move are


|
||||||||||||||||||||||||||||||||||||||||||||||||
| 12Stocks.com: Investing in Smallcap Index using Exchange Traded Funds | |
|
The following table shows list of key exchange traded funds (ETF) that
help investors track Smallcap index. The following list also includes leveraged ETF funds that track twice or thrice the daily returns of Smallcap indices. Short or inverse ETF funds move in the opposite direction to the index they track and are useful during market pullbacks or during bear markets. Quick View: Move mouse or cursor over ETF symbol (ticker) to view short-term technical chart and over ETF name to view long term chart. Click on ticker or stock name for detailed view. Click on to add stock symbol to your watchlist and to view watchlist. |
12Stocks.com List of ETFs that track Smallcap Index
| Ticker | ETF Name | Watchlist | Recent Price | Smart Investing & Trading Score | Change % | Week % | Year-to-date % |
| IWM | iShares Russell 2000 | | 199.96 | 88 | 0.79 | 0.79 | -0.37% |
| IJR | iShares Core S&P Small-Cap | | 106.41 | 93 | 0.72 | 0.72 | -1.7% |
| VTWO | Vanguard Russell 2000 ETF | | 80.78 | 88 | 0.70 | 0.7 | -0.39% |
| IWN | iShares Russell 2000 Value | | 152.05 | 93 | 0.60 | 0.6 | -2.11% |
| IWO | iShares Russell 2000 Growth | | 255.74 | 78 | 1.05 | 1.05 | 1.4% |
| IJS | iShares S&P Small-Cap 600 Value | | 97.95 | 70 | 0.78 | 0.78 | -4.97% |
| IJT | iShares S&P Small-Cap 600 Growth | | 126.96 | 88 | 0.69 | 0.69 | 1.45% |
| XSLV | PowerShares S&P SmallCap Low Volatil ETF | | 42.87 | 80 | 0.35 | 0.35 | -2.9% |
| SMLV | SPDR SSGA US Small Cap Low Volatil ETF | | 107.77 | 68 | 0.23 | 0.23 | -4.22% |
| SAA | ProShares Ultra SmallCap600 | | 23.27 | 88 | 1.00 | 1 | -6.73% |
| SBB | ProShares Short SmallCap600 | | 16.28 | 8 | -0.64 | -0.64 | 2.2% |
| SDD | ProShares UltraShort SmallCap600 | | 19.09 | 15 | -1.34 | -1.34 | 3.6% |
| 12Stocks.com: Charts, Trends, Fundamental Data and Performances of SmallCap Stocks | |
|
We now take in-depth look at all SmallCap stocks including charts, multi-period performances and overall trends (as measured by Smart Investing & Trading Score). One can sort SmallCap stocks (click link to choose) by Daily, Weekly and by Year-to-Date performances. Also, one can sort by size of the company or by market capitalization. |
| Select Your Default Chart Type: | |||||
| |||||
| Click on stock symbol or name for detailed view. Click on to add stock symbol to your watchlist and to view watchlist. Quick View: Move mouse or cursor over "Daily" to quickly view daily technical stock chart and over "Weekly" to view weekly technical stock chart. | |||||

 | NTLA Intellia Therapeutics, Inc. |
| Sector: Health Care | |
| SubSector: Biotechnology | |
| MarketCap: 707.185 Millions | |
| Recent Price: 21.98 Smart Investing & Trading Score: 52 | |
| Day Percent Change: 5.88% Day Change: 1.22 | |
| Week Change: 5.88% Year-to-date Change: -27.9% | |
| NTLA Links: Profile News Message Board | |
| Charts:- Daily , Weekly | |
| Add NTLA to Watchlist: View: Get Complete NTLA Trend Analysis ➞ | |
 | CSTL Castle Biosciences, Inc. |
| Sector: Health Care | |
| SubSector: Medical Laboratories & Research | |
| MarketCap: 545 Millions | |
| Recent Price: 21.53 Smart Investing & Trading Score: 74 | |
| Day Percent Change: 5.85% Day Change: 1.19 | |
| Week Change: 5.85% Year-to-date Change: -0.2% | |
| CSTL Links: Profile News Message Board | |
| Charts:- Daily , Weekly | |
| Add CSTL to Watchlist: View: Get Complete CSTL Trend Analysis ➞ | |
 | TNGX Tango Therapeutics, Inc. |
| Sector: Health Care | |
| SubSector: Biotechnology | |
| MarketCap: 302 Millions | |
| Recent Price: 7.87 Smart Investing & Trading Score: 39 | |
| Day Percent Change: 5.78% Day Change: 0.43 | |
| Week Change: 5.78% Year-to-date Change: -20.5% | |
| TNGX Links: Profile News Message Board | |
| Charts:- Daily , Weekly | |
| Add TNGX to Watchlist: View: Get Complete TNGX Trend Analysis ➞ | |
 | CMAX CareMax, Inc. |
| Sector: Health Care | |
| SubSector: Health Information Services | |
| MarketCap: 371 Millions | |
| Recent Price: 3.30 Smart Investing & Trading Score: 43 | |
| Day Percent Change: 5.77% Day Change: 0.18 | |
| Week Change: 5.77% Year-to-date Change: 580.4% | |
| CMAX Links: Profile News Message Board | |
| Charts:- Daily , Weekly | |
| Add CMAX to Watchlist: View: Get Complete CMAX Trend Analysis ➞ | |
 | TRVI Trevi Therapeutics, Inc. |
| Sector: Health Care | |
| SubSector: Biotechnology | |
| MarketCap: 50.6785 Millions | |
| Recent Price: 2.94 Smart Investing & Trading Score: 75 | |
| Day Percent Change: 5.76% Day Change: 0.16 | |
| Week Change: 5.76% Year-to-date Change: 119.4% | |
| TRVI Links: Profile News Message Board | |
| Charts:- Daily , Weekly | |
| Add TRVI to Watchlist: View: Get Complete TRVI Trend Analysis ➞ | |
 | TMDX TransMedics Group, Inc. |
| Sector: Health Care | |
| SubSector: Medical Appliances & Equipment | |
| MarketCap: 331.68 Millions | |
| Recent Price: 97.25 Smart Investing & Trading Score: 100 | |
| Day Percent Change: 5.61% Day Change: 5.17 | |
| Week Change: 5.61% Year-to-date Change: 23.2% | |
| TMDX Links: Profile News Message Board | |
| Charts:- Daily , Weekly | |
| Add TMDX to Watchlist: View: Get Complete TMDX Trend Analysis ➞ | |
 | ADPT Adaptive Biotechnologies Corporation |
| Sector: Health Care | |
| SubSector: Biotechnology | |
| MarketCap: 3525.75 Millions | |
| Recent Price: 2.75 Smart Investing & Trading Score: 54 | |
| Day Percent Change: 5.58% Day Change: 0.15 | |
| Week Change: 5.58% Year-to-date Change: -44.0% | |
| ADPT Links: Profile News Message Board | |
| Charts:- Daily , Weekly | |
| Add ADPT to Watchlist: View: Get Complete ADPT Trend Analysis ➞ | |
 | CLPR Clipper Realty Inc. |
| Sector: Financials | |
| SubSector: REIT - Diversified | |
| MarketCap: 113.253 Millions | |
| Recent Price: 4.19 Smart Investing & Trading Score: 34 | |
| Day Percent Change: 5.54% Day Change: 0.22 | |
| Week Change: 5.54% Year-to-date Change: -22.4% | |
| CLPR Links: Profile News Message Board | |
| Charts:- Daily , Weekly | |
| Add CLPR to Watchlist: View: Get Complete CLPR Trend Analysis ➞ | |
 | PIII P3 Health Partners Inc. |
| Sector: Health Care | |
| SubSector: Medical Care Facilities | |
| MarketCap: 944 Millions | |
| Recent Price: 0.47 Smart Investing & Trading Score: 50 | |
| Day Percent Change: 5.47% Day Change: 0.02 | |
| Week Change: 5.47% Year-to-date Change: -68.4% | |
| PIII Links: Profile News Message Board | |
| Charts:- Daily , Weekly | |
| Add PIII to Watchlist: View: Get Complete PIII Trend Analysis ➞ | |
 | XNCR Xencor, Inc. |
| Sector: Health Care | |
| SubSector: Biotechnology | |
| MarketCap: 1744.35 Millions | |
| Recent Price: 21.07 Smart Investing & Trading Score: 100 | |
| Day Percent Change: 5.46% Day Change: 1.09 | |
| Week Change: 5.46% Year-to-date Change: -0.8% | |
| XNCR Links: Profile News Message Board | |
| Charts:- Daily , Weekly | |
| Add XNCR to Watchlist: View: Get Complete XNCR Trend Analysis ➞ | |
 | EWTX Edgewise Therapeutics, Inc. |
| Sector: Health Care | |
| SubSector: Biotechnology | |
| MarketCap: 492 Millions | |
| Recent Price: 17.05 Smart Investing & Trading Score: 69 | |
| Day Percent Change: 5.41% Day Change: 0.88 | |
| Week Change: 5.41% Year-to-date Change: 50.2% | |
| EWTX Links: Profile News Message Board | |
| Charts:- Daily , Weekly | |
| Add EWTX to Watchlist: View: Get Complete EWTX Trend Analysis ➞ | |
 | YMAB Y-mAbs Therapeutics, Inc. |
| Sector: Health Care | |
| SubSector: Biotechnology | |
| MarketCap: 899.585 Millions | |
| Recent Price: 15.50 Smart Investing & Trading Score: 70 | |
| Day Percent Change: 5.37% Day Change: 0.79 | |
| Week Change: 5.37% Year-to-date Change: 127.3% | |
| YMAB Links: Profile News Message Board | |
| Charts:- Daily , Weekly | |
| Add YMAB to Watchlist: View: Get Complete YMAB Trend Analysis ➞ | |
 | SKYT SkyWater Technology, Inc. |
| Sector: Technology | |
| SubSector: Semiconductors | |
| MarketCap: 394 Millions | |
| Recent Price: 10.26 Smart Investing & Trading Score: 95 | |
| Day Percent Change: 5.34% Day Change: 0.52 | |
| Week Change: 5.34% Year-to-date Change: 6.4% | |
| SKYT Links: Profile News Message Board | |
| Charts:- Daily , Weekly | |
| Add SKYT to Watchlist: View: Get Complete SKYT Trend Analysis ➞ | |
 | MED Medifast, Inc. |
| Sector: Services & Goods | |
| SubSector: Specialty Retail, Other | |
| MarketCap: 681.044 Millions | |
| Recent Price: 35.51 Smart Investing & Trading Score: 74 | |
| Day Percent Change: 5.34% Day Change: 1.80 | |
| Week Change: 5.34% Year-to-date Change: -47.2% | |
| MED Links: Profile News Message Board | |
| Charts:- Daily , Weekly | |
| Add MED to Watchlist: View: Get Complete MED Trend Analysis ➞ | |
 | TNYA Tenaya Therapeutics, Inc. |
| Sector: Health Care | |
| SubSector: Biotechnology | |
| MarketCap: 395 Millions | |
| Recent Price: 4.54 Smart Investing & Trading Score: 85 | |
| Day Percent Change: 5.34% Day Change: 0.23 | |
| Week Change: 5.34% Year-to-date Change: 42.8% | |
| TNYA Links: Profile News Message Board | |
| Charts:- Daily , Weekly | |
| Add TNYA to Watchlist: View: Get Complete TNYA Trend Analysis ➞ | |
 | VCYT Veracyte, Inc. |
| Sector: Health Care | |
| SubSector: Biotechnology | |
| MarketCap: 1089.05 Millions | |
| Recent Price: 20.34 Smart Investing & Trading Score: 57 | |
| Day Percent Change: 5.33% Day Change: 1.03 | |
| Week Change: 5.33% Year-to-date Change: -26.1% | |
| VCYT Links: Profile News Message Board | |
| Charts:- Daily , Weekly | |
| Add VCYT to Watchlist: View: Get Complete VCYT Trend Analysis ➞ | |
 | EYPT EyePoint Pharmaceuticals, Inc. |
| Sector: Health Care | |
| SubSector: Biotechnology | |
| MarketCap: 125.085 Millions | |
| Recent Price: 17.63 Smart Investing & Trading Score: 42 | |
| Day Percent Change: 5.25% Day Change: 0.88 | |
| Week Change: 5.25% Year-to-date Change: -23.7% | |
| EYPT Links: Profile News Message Board | |
| Charts:- Daily , Weekly | |
| Add EYPT to Watchlist: View: Get Complete EYPT Trend Analysis ➞ | |
 | GLUE Monte Rosa Therapeutics, Inc. |
| Sector: Health Care | |
| SubSector: Biotechnology | |
| MarketCap: 346 Millions | |
| Recent Price: 5.61 Smart Investing & Trading Score: 63 | |
| Day Percent Change: 5.25% Day Change: 0.28 | |
| Week Change: 5.25% Year-to-date Change: -0.4% | |
| GLUE Links: Profile News Message Board | |
| Charts:- Daily , Weekly | |
| Add GLUE to Watchlist: View: Get Complete GLUE Trend Analysis ➞ | |
 | ZURA Zura Bio Limited |
| Sector: Health Care | |
| SubSector: Biotechnology | |
| MarketCap: 242 Millions | |
| Recent Price: 4.64 Smart Investing & Trading Score: 100 | |
| Day Percent Change: 5.22% Day Change: 0.23 | |
| Week Change: 5.22% Year-to-date Change: -1.0% | |
| ZURA Links: Profile News Message Board | |
| Charts:- Daily , Weekly | |
| Add ZURA to Watchlist: View: Get Complete ZURA Trend Analysis ➞ | |
 | CDLX Cardlytics, Inc. |
| Sector: Technology | |
| SubSector: Internet Information Providers | |
| MarketCap: 855.48 Millions | |
| Recent Price: 12.95 Smart Investing & Trading Score: 68 | |
| Day Percent Change: 5.20% Day Change: 0.64 | |
| Week Change: 5.2% Year-to-date Change: 40.6% | |
| CDLX Links: Profile News Message Board | |
| Charts:- Daily , Weekly | |
| Add CDLX to Watchlist: View: Get Complete CDLX Trend Analysis ➞ | |
 | DM Dominion Midstream Partners, LP |
| Sector: Energy | |
| SubSector: Oil & Gas Pipelines | |
| MarketCap: 3017.01 Millions | |
| Recent Price: 0.86 Smart Investing & Trading Score: 32 | |
| Day Percent Change: 5.19% Day Change: 0.04 | |
| Week Change: 5.19% Year-to-date Change: 15.1% | |
| DM Links: Profile News Message Board | |
| Charts:- Daily , Weekly | |
| Add DM to Watchlist: View: Get Complete DM Trend Analysis ➞ | |
 | HCAT Health Catalyst, Inc. |
| Sector: Technology | |
| SubSector: Healthcare Information Services | |
| MarketCap: 983.955 Millions | |
| Recent Price: 6.34 Smart Investing & Trading Score: 64 | |
| Day Percent Change: 5.14% Day Change: 0.31 | |
| Week Change: 5.14% Year-to-date Change: -31.5% | |
| HCAT Links: Profile News Message Board | |
| Charts:- Daily , Weekly | |
| Add HCAT to Watchlist: View: Get Complete HCAT Trend Analysis ➞ | |
 | EAF GrafTech International Ltd. |
| Sector: Industrials | |
| SubSector: Diversified Machinery | |
| MarketCap: 2084.36 Millions | |
| Recent Price: 1.66 Smart Investing & Trading Score: 64 | |
| Day Percent Change: 5.06% Day Change: 0.08 | |
| Week Change: 5.06% Year-to-date Change: -24.2% | |
| EAF Links: Profile News Message Board | |
| Charts:- Daily , Weekly | |
| Add EAF to Watchlist: View: Get Complete EAF Trend Analysis ➞ | |
 | NGVT Ingevity Corporation |
| Sector: Materials | |
| SubSector: Specialty Chemicals | |
| MarketCap: 1325.47 Millions | |
| Recent Price: 50.95 Smart Investing & Trading Score: 100 | |
| Day Percent Change: 5.03% Day Change: 2.44 | |
| Week Change: 5.03% Year-to-date Change: 7.9% | |
| NGVT Links: Profile News Message Board | |
| Charts:- Daily , Weekly | |
| Add NGVT to Watchlist: View: Get Complete NGVT Trend Analysis ➞ | |
 | BYND Beyond Meat, Inc. |
| Sector: Consumer Staples | |
| SubSector: Processed & Packaged Goods | |
| MarketCap: 3987.98 Millions | |
| Recent Price: 6.72 Smart Investing & Trading Score: 95 | |
| Day Percent Change: 5.00% Day Change: 0.32 | |
| Week Change: 5% Year-to-date Change: -24.5% | |
| BYND Links: Profile News Message Board | |
| Charts:- Daily , Weekly | |
| Add BYND to Watchlist: View: Get Complete BYND Trend Analysis ➞ | |
| Too many stocks? View smallcap stocks filtered by marketcap & sector |
| Marketcap: All SmallCap Stocks (default-no microcap), Large, Mid-Range, Small & MicroCap |
| Sector: Tech, Finance, Energy, Staples, Retail, Industrial, Materials, Utilities & Medical |
|
Best Stocks Today 12Stocks.com |
© 2024 12Stocks.com Terms & Conditions Privacy Contact Us
All Information Provided Only For Education And Not To Be Used For Investing or Trading. See Terms & Conditions


One More Thing ... Get Best Stocks Delivered Daily!
Never Ever Miss A Move With Our Top Ten Stocks Lists
Find Best Stocks In Any Market - Bull or Bear Market
Take A Peek At Our Top Ten Stocks Lists: Daily, Weekly, Year-to-Date & Top Trends
Find Best Stocks In Any Market - Bull or Bear Market
Take A Peek At Our Top Ten Stocks Lists: Daily, Weekly, Year-to-Date & Top Trends
Smallcap Stocks With Best Up Trends [0-bearish to 100-bullish]: Bakkt [100], Deciphera [100], Phibro Animal[100], Heartland Financial[100], PTC [100], Sight Sciences[100], Richardson Electronics[100], Fulton Financial[100], TPI Composites[100], Cullinan Oncology[100], Lands [100]
Best Smallcap Stocks Year-to-Date:
CareMax [580.41%], Janux [421.92%], Bakkt [346.64%], Viking [305.75%], Longboard [247.46%], Alpine Immune[239.81%], Super Micro[213.22%], Avidity Biosciences[173.23%], Arcutis Bio[171.83%], Vera [167.31%], Cullinan Oncology[166.01%] Best Smallcap Stocks This Week:
Deciphera [72.56%], Phibro Animal[31.81%], Vaxxinity [31.65%], Zevia PBC[20.94%], Velo3D [19.97%], Acrivon [18.2%], Janux [18.18%], MultiPlan [15.53%], Heartland Financial[15.15%], Codexis [14.66%], Eyenovia [13.37%] Best Smallcap Stocks Daily:
Bakkt [2391.87%], Deciphera [72.56%], Phibro Animal[31.81%], Vaxxinity [31.65%], Zevia PBC[20.94%], Velo3D [19.97%], Acrivon [18.20%], Janux [18.18%], MultiPlan [15.53%], Heartland Financial[15.15%], Codexis [14.66%]