
 Login Sign Up


| |||||
 |  | ||||

| 12Stocks.com Market Intelligence |
Best SmallCap Stocks
|
| In a hurry? Small Cap Stock Lists: Performance Trends Table, Stock Charts
Sort Small Cap stocks: Daily, Weekly, Year-to-Date, Market Cap & Trends. Filter Small Cap stocks list by sector: Show all, Tech, Finance, Energy, Staples, Retail, Industrial, Materials, Utilities and HealthCare Filter Small Cap stocks list by size: All Large Medium Small and MicroCap |
| 12Stocks.com Small Cap Stocks Performances & Trends Daily | |||||||||
|
|  The overall Smart Investing & Trading Score is 88 (0-bearish to 100-bullish) which puts Small Cap index in short term bullish trend. The Smart Investing & Trading Score from previous trading session is 56 and hence an improvement of trend.
| ||||||||
Here are the Smart Investing & Trading Scores of the most requested small cap stocks at 12Stocks.com (click stock name for detailed review):
|


| 12Stocks.com: Investing in Smallcap Index with Stocks | |
|
The following table helps investors and traders sort through current performance and trends (as measured by Smart Investing & Trading Score) of various
stocks in the Smallcap Index. Quick View: Move mouse or cursor over stock symbol (ticker) to view short-term technical chart and over stock name to view long term chart. Click on  to add stock symbol to your watchlist and to add stock symbol to your watchlist and  to view watchlist. Click on any ticker or stock name for detailed market intelligence report for that stock. to view watchlist. Click on any ticker or stock name for detailed market intelligence report for that stock. |
12Stocks.com Performance of Stocks in Smallcap Index
| Ticker | Stock Name | Watchlist | Category | Recent Price | Smart Investing & Trading Score | Change % | Weekly Change% |
| COCO | Vita Coco |   | Consumer Staples | 25.09 | 83 | 1.46% | 1.46% |
| LPG | Dorian LPG | | Transports | 42.39 | 100 | 1.46% | 1.46% |
| REVG | REV Group | | Consumer Staples | 21.55 | 46 | 1.46% | 1.46% |
| NOTE | FiscalNote | | Technology | 1.39 | 100 | 1.46% | 1.46% |
| SKY | Skyline Champion | | Industrials | 77.46 | 63 | 1.45% | 1.45% |
| BBSI | Barrett Business | | Services & Goods | 123.53 | 78 | 1.45% | 1.45% |
| NEWT | Newtek Business | | Services & Goods | 11.16 | 52 | 1.45% | 1.45% |
| LILA | Liberty Latin | | Technology | 7.72 | 100 | 1.45% | 1.45% |
| NRC | National Research | | Health Care | 34.30 | 42 | 1.45% | 1.45% |
| DSP | Viant | | Technology | 8.45 | 17 | 1.44% | 1.44% |
| AMTB | Amerant Bancorp | | Financials | 21.89 | 42 | 1.44% | 1.44% |
| HUBG | Hub Group | | Transports | 40.50 | 59 | 1.43% | 1.43% |
| TROX | Tronox | | Materials | 17.73 | 88 | 1.43% | 1.43% |
| ANAB | AnaptysBio | | Health Care | 21.30 | 49 | 1.43% | 1.43% |
| UNFI | United Natural | | Consumer Staples | 9.26 | 59 | 1.42% | 1.42% |
| MTW | Manitowoc | | Industrials | 12.82 | 27 | 1.42% | 1.42% |
| HSTM | HealthStream | | Technology | 25.97 | 57 | 1.41% | 1.41% |
| MCRI | Monarch Casino | | Services & Goods | 69.03 | 48 | 1.41% | 1.41% |
| COKE | Coca-Cola Consolidated | | Consumer Staples | 834.04 | 42 | 1.41% | 1.41% |
| RYTM | Rhythm | | Health Care | 38.82 | 34 | 1.41% | 1.41% |
| REZI | Resideo | | Services & Goods | 20.16 | 70 | 1.41% | 1.41% |
| KOP | Koppers | | Materials | 53.47 | 51 | 1.40% | 1.40% |
| RNA | Avidity Biosciences | | Health Care | 24.70 | 68 | 1.40% | 1.40% |
| IHRT | iHeartMedia | | Services & Goods | 2.17 | 59 | 1.40% | 1.40% |
| CALM | Cal-Maine Foods | | Consumer Staples | 57.66 | 41 | 1.39% | 1.39% |


| Too many stocks? View smallcap stocks filtered by marketcap & sector |
| Marketcap: All SmallCap Stocks (default-no microcap), Large, Mid-Range, Small |
| Smallcap Sector: Tech, Finance, Energy, Staples, Retail, Industrial, Materials, & Medical |
|
Get the most comprehensive stock market coverage daily at 12Stocks.com ➞ Best Stocks Today ➞ Best Stocks Weekly ➞ Best Stocks Year-to-Date ➞ Best Stocks Trends ➞  Best Stocks Today 12Stocks.com Best Nasdaq Stocks ➞ Best S&P 500 Stocks ➞ Best Tech Stocks ➞ Best Biotech Stocks ➞ |
| Detailed Overview of SmallCap Stocks |
| SmallCap Technical Overview, Leaders & Laggards, Top SmallCap ETF Funds & Detailed SmallCap Stocks List, Charts, Trends & More |
| Smallcap: Technical Analysis, Trends & YTD Performance | |
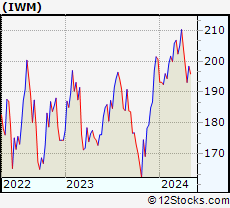
| SmallCap segment as represented by
IWM, an exchange-traded fund [ETF], holds basket of thousands of smallcap stocks from across all major sectors of the US stock market. The smallcap index (contains stocks like Riverbed & Sotheby's) is down by -0.37% and is currently underperforming the overall market by -6.93% year-to-date. Below is a quick view of technical charts and trends: | |
 IWM Weekly Chart |
|
| Long Term Trend: Very Good | |
| Medium Term Trend: Good | |
 IWM Daily Chart |
|
| Short Term Trend: Very Good | |
| Overall Trend Score: 88 | |
| YTD Performance: -0.37% | |
| **Trend Scores & Views Are Only For Educational Purposes And Not For Investing | |
| 12Stocks.com: Top Performing Small Cap Index Stocks | ||||||||||||||||||||||||||||||||||||||||||||||||
 The top performing Small Cap Index stocks year to date are
Now, more recently, over last week, the top performing Small Cap Index stocks on the move are


|
||||||||||||||||||||||||||||||||||||||||||||||||
| 12Stocks.com: Investing in Smallcap Index using Exchange Traded Funds | |
|
The following table shows list of key exchange traded funds (ETF) that
help investors track Smallcap index. The following list also includes leveraged ETF funds that track twice or thrice the daily returns of Smallcap indices. Short or inverse ETF funds move in the opposite direction to the index they track and are useful during market pullbacks or during bear markets. Quick View: Move mouse or cursor over ETF symbol (ticker) to view short-term technical chart and over ETF name to view long term chart. Click on ticker or stock name for detailed view. Click on to add stock symbol to your watchlist and to view watchlist. |
12Stocks.com List of ETFs that track Smallcap Index
| Ticker | ETF Name | Watchlist | Recent Price | Smart Investing & Trading Score | Change % | Week % | Year-to-date % |
| IWM | iShares Russell 2000 | | 199.96 | 88 | 0.79 | 0.79 | -0.37% |
| IJR | iShares Core S&P Small-Cap | | 106.41 | 93 | 0.72 | 0.72 | -1.7% |
| VTWO | Vanguard Russell 2000 ETF | | 80.78 | 88 | 0.70 | 0.7 | -0.39% |
| IWN | iShares Russell 2000 Value | | 152.05 | 93 | 0.60 | 0.6 | -2.11% |
| IWO | iShares Russell 2000 Growth | | 255.74 | 88 | 1.05 | 1.05 | 1.4% |
| IJS | iShares S&P Small-Cap 600 Value | | 97.95 | 75 | 0.78 | 0.78 | -4.97% |
| IJT | iShares S&P Small-Cap 600 Growth | | 126.96 | 95 | 0.69 | 0.69 | 1.45% |
| XSLV | PowerShares S&P SmallCap Low Volatil ETF | | 42.87 | 80 | 0.35 | 0.35 | -2.9% |
| SMLV | SPDR SSGA US Small Cap Low Volatil ETF | | 107.77 | 68 | 0.23 | 0.23 | -4.22% |
| SAA | ProShares Ultra SmallCap600 | | 23.27 | 95 | 1.00 | 1 | -6.73% |
| SBB | ProShares Short SmallCap600 | | 16.28 | 8 | -0.64 | -0.64 | 2.2% |
| SDD | ProShares UltraShort SmallCap600 | | 19.09 | 10 | -1.34 | -1.34 | 3.6% |
| 12Stocks.com: Charts, Trends, Fundamental Data and Performances of SmallCap Stocks | |
|
We now take in-depth look at all SmallCap stocks including charts, multi-period performances and overall trends (as measured by Smart Investing & Trading Score). One can sort SmallCap stocks (click link to choose) by Daily, Weekly and by Year-to-Date performances. Also, one can sort by size of the company or by market capitalization. |
| Select Your Default Chart Type: | |||||
| |||||
| Click on stock symbol or name for detailed view. Click on to add stock symbol to your watchlist and to view watchlist. Quick View: Move mouse or cursor over "Daily" to quickly view daily technical stock chart and over "Weekly" to view weekly technical stock chart. | |||||

 | COCO The Vita Coco Company, Inc. |
| Sector: Consumer Staples | |
| SubSector: Beverages - Non-Alcoholic | |
| MarketCap: 1510 Millions | |
| Recent Price: 25.09 Smart Investing & Trading Score: 83 | |
| Day Percent Change: 1.46% Day Change: 0.36 | |
| Week Change: 1.46% Year-to-date Change: -2.6% | |
| COCO Links: Profile News Message Board | |
| Charts:- Daily , Weekly | |
| Add COCO to Watchlist: View: Get Complete COCO Trend Analysis ➞ | |
 | LPG Dorian LPG Ltd. |
| Sector: Transports | |
| SubSector: Shipping | |
| MarketCap: 426.414 Millions | |
| Recent Price: 42.39 Smart Investing & Trading Score: 100 | |
| Day Percent Change: 1.46% Day Change: 0.61 | |
| Week Change: 1.46% Year-to-date Change: -3.4% | |
| LPG Links: Profile News Message Board | |
| Charts:- Daily , Weekly | |
| Add LPG to Watchlist: View: Get Complete LPG Trend Analysis ➞ | |
 | REVG REV Group, Inc. |
| Sector: Consumer Staples | |
| SubSector: Trucks & Other Vehicles | |
| MarketCap: 398.597 Millions | |
| Recent Price: 21.55 Smart Investing & Trading Score: 46 | |
| Day Percent Change: 1.46% Day Change: 0.31 | |
| Week Change: 1.46% Year-to-date Change: 18.6% | |
| REVG Links: Profile News Message Board | |
| Charts:- Daily , Weekly | |
| Add REVG to Watchlist: View: Get Complete REVG Trend Analysis ➞ | |
 | NOTE FiscalNote Holdings, Inc. |
| Sector: Technology | |
| SubSector: Information Technology Services | |
| MarketCap: 493 Millions | |
| Recent Price: 1.39 Smart Investing & Trading Score: 100 | |
| Day Percent Change: 1.46% Day Change: 0.02 | |
| Week Change: 1.46% Year-to-date Change: 18.8% | |
| NOTE Links: Profile News Message Board | |
| Charts:- Daily , Weekly | |
| Add NOTE to Watchlist: View: Get Complete NOTE Trend Analysis ➞ | |
 | SKY Skyline Champion Corporation |
| Sector: Industrials | |
| SubSector: Manufactured Housing | |
| MarketCap: 915.145 Millions | |
| Recent Price: 77.46 Smart Investing & Trading Score: 63 | |
| Day Percent Change: 1.45% Day Change: 1.11 | |
| Week Change: 1.45% Year-to-date Change: 4.3% | |
| SKY Links: Profile News Message Board | |
| Charts:- Daily , Weekly | |
| Add SKY to Watchlist: View: Get Complete SKY Trend Analysis ➞ | |
 | BBSI Barrett Business Services, Inc. |
| Sector: Services & Goods | |
| SubSector: Staffing & Outsourcing Services | |
| MarketCap: 262.028 Millions | |
| Recent Price: 123.53 Smart Investing & Trading Score: 78 | |
| Day Percent Change: 1.45% Day Change: 1.76 | |
| Week Change: 1.45% Year-to-date Change: 6.7% | |
| BBSI Links: Profile News Message Board | |
| Charts:- Daily , Weekly | |
| Add BBSI to Watchlist: View: Get Complete BBSI Trend Analysis ➞ | |
 | NEWT Newtek Business Services Corp. |
| Sector: Services & Goods | |
| SubSector: Business Services | |
| MarketCap: 243.982 Millions | |
| Recent Price: 11.16 Smart Investing & Trading Score: 52 | |
| Day Percent Change: 1.45% Day Change: 0.16 | |
| Week Change: 1.45% Year-to-date Change: -19.1% | |
| NEWT Links: Profile News Message Board | |
| Charts:- Daily , Weekly | |
| Add NEWT to Watchlist: View: Get Complete NEWT Trend Analysis ➞ | |
 | LILA Liberty Latin America Ltd. |
| Sector: Technology | |
| SubSector: CATV Systems | |
| MarketCap: 2092.62 Millions | |
| Recent Price: 7.72 Smart Investing & Trading Score: 100 | |
| Day Percent Change: 1.45% Day Change: 0.11 | |
| Week Change: 1.45% Year-to-date Change: 5.6% | |
| LILA Links: Profile News Message Board | |
| Charts:- Daily , Weekly | |
| Add LILA to Watchlist: View: Get Complete LILA Trend Analysis ➞ | |
 | NRC National Research Corporation |
| Sector: Health Care | |
| SubSector: Medical Laboratories & Research | |
| MarketCap: 1187.7 Millions | |
| Recent Price: 34.30 Smart Investing & Trading Score: 42 | |
| Day Percent Change: 1.45% Day Change: 0.49 | |
| Week Change: 1.45% Year-to-date Change: -13.3% | |
| NRC Links: Profile News Message Board | |
| Charts:- Daily , Weekly | |
| Add NRC to Watchlist: View: Get Complete NRC Trend Analysis ➞ | |
 | DSP Viant Technology Inc. |
| Sector: Technology | |
| SubSector: Software - Application | |
| MarketCap: 279 Millions | |
| Recent Price: 8.45 Smart Investing & Trading Score: 17 | |
| Day Percent Change: 1.44% Day Change: 0.12 | |
| Week Change: 1.44% Year-to-date Change: 21.8% | |
| DSP Links: Profile News Message Board | |
| Charts:- Daily , Weekly | |
| Add DSP to Watchlist: View: Get Complete DSP Trend Analysis ➞ | |
 | AMTB Amerant Bancorp Inc. |
| Sector: Financials | |
| SubSector: Regional - Midwest Banks | |
| MarketCap: 653.87 Millions | |
| Recent Price: 21.89 Smart Investing & Trading Score: 42 | |
| Day Percent Change: 1.44% Day Change: 0.31 | |
| Week Change: 1.44% Year-to-date Change: -10.9% | |
| AMTB Links: Profile News Message Board | |
| Charts:- Daily , Weekly | |
| Add AMTB to Watchlist: View: Get Complete AMTB Trend Analysis ➞ | |
 | HUBG Hub Group, Inc. |
| Sector: Transports | |
| SubSector: Air Delivery & Freight Services | |
| MarketCap: 1503.88 Millions | |
| Recent Price: 40.50 Smart Investing & Trading Score: 59 | |
| Day Percent Change: 1.43% Day Change: 0.57 | |
| Week Change: 1.43% Year-to-date Change: -56.0% | |
| HUBG Links: Profile News Message Board | |
| Charts:- Daily , Weekly | |
| Add HUBG to Watchlist: View: Get Complete HUBG Trend Analysis ➞ | |
 | TROX Tronox Holdings plc |
| Sector: Materials | |
| SubSector: Chemicals - Major Diversified | |
| MarketCap: 807 Millions | |
| Recent Price: 17.73 Smart Investing & Trading Score: 88 | |
| Day Percent Change: 1.43% Day Change: 0.25 | |
| Week Change: 1.43% Year-to-date Change: 25.2% | |
| TROX Links: Profile News Message Board | |
| Charts:- Daily , Weekly | |
| Add TROX to Watchlist: View: Get Complete TROX Trend Analysis ➞ | |
 | ANAB AnaptysBio, Inc. |
| Sector: Health Care | |
| SubSector: Biotechnology | |
| MarketCap: 405.985 Millions | |
| Recent Price: 21.30 Smart Investing & Trading Score: 49 | |
| Day Percent Change: 1.43% Day Change: 0.30 | |
| Week Change: 1.43% Year-to-date Change: -0.6% | |
| ANAB Links: Profile News Message Board | |
| Charts:- Daily , Weekly | |
| Add ANAB to Watchlist: View: Get Complete ANAB Trend Analysis ➞ | |
 | UNFI United Natural Foods, Inc. |
| Sector: Consumer Staples | |
| SubSector: Food Wholesale | |
| MarketCap: 746.329 Millions | |
| Recent Price: 9.26 Smart Investing & Trading Score: 59 | |
| Day Percent Change: 1.42% Day Change: 0.13 | |
| Week Change: 1.42% Year-to-date Change: -43.0% | |
| UNFI Links: Profile News Message Board | |
| Charts:- Daily , Weekly | |
| Add UNFI to Watchlist: View: Get Complete UNFI Trend Analysis ➞ | |
 | MTW The Manitowoc Company, Inc. |
| Sector: Industrials | |
| SubSector: Farm & Construction Machinery | |
| MarketCap: 373.707 Millions | |
| Recent Price: 12.82 Smart Investing & Trading Score: 27 | |
| Day Percent Change: 1.42% Day Change: 0.18 | |
| Week Change: 1.42% Year-to-date Change: -23.2% | |
| MTW Links: Profile News Message Board | |
| Charts:- Daily , Weekly | |
| Add MTW to Watchlist: View: Get Complete MTW Trend Analysis ➞ | |
 | HSTM HealthStream, Inc. |
| Sector: Technology | |
| SubSector: Healthcare Information Services | |
| MarketCap: 770.255 Millions | |
| Recent Price: 25.97 Smart Investing & Trading Score: 57 | |
| Day Percent Change: 1.41% Day Change: 0.36 | |
| Week Change: 1.41% Year-to-date Change: -3.9% | |
| HSTM Links: Profile News Message Board | |
| Charts:- Daily , Weekly | |
| Add HSTM to Watchlist: View: Get Complete HSTM Trend Analysis ➞ | |
 | MCRI Monarch Casino & Resort, Inc. |
| Sector: Services & Goods | |
| SubSector: Resorts & Casinos | |
| MarketCap: 352.894 Millions | |
| Recent Price: 69.03 Smart Investing & Trading Score: 48 | |
| Day Percent Change: 1.41% Day Change: 0.96 | |
| Week Change: 1.41% Year-to-date Change: -0.2% | |
| MCRI Links: Profile News Message Board | |
| Charts:- Daily , Weekly | |
| Add MCRI to Watchlist: View: Get Complete MCRI Trend Analysis ➞ | |
 | COKE Coca-Cola Consolidated, Inc. |
| Sector: Consumer Staples | |
| SubSector: Beverages - Soft Drinks | |
| MarketCap: 1392.2 Millions | |
| Recent Price: 834.04 Smart Investing & Trading Score: 42 | |
| Day Percent Change: 1.41% Day Change: 11.60 | |
| Week Change: 1.41% Year-to-date Change: -10.2% | |
| COKE Links: Profile News Message Board | |
| Charts:- Daily , Weekly | |
| Add COKE to Watchlist: View: Get Complete COKE Trend Analysis ➞ | |
 | RYTM Rhythm Pharmaceuticals, Inc. |
| Sector: Health Care | |
| SubSector: Biotechnology | |
| MarketCap: 643.685 Millions | |
| Recent Price: 38.82 Smart Investing & Trading Score: 34 | |
| Day Percent Change: 1.41% Day Change: 0.54 | |
| Week Change: 1.41% Year-to-date Change: -15.6% | |
| RYTM Links: Profile News Message Board | |
| Charts:- Daily , Weekly | |
| Add RYTM to Watchlist: View: Get Complete RYTM Trend Analysis ➞ | |
 | REZI Resideo Technologies, Inc. |
| Sector: Services & Goods | |
| SubSector: Security & Protection Services | |
| MarketCap: 712.603 Millions | |
| Recent Price: 20.16 Smart Investing & Trading Score: 70 | |
| Day Percent Change: 1.41% Day Change: 0.28 | |
| Week Change: 1.41% Year-to-date Change: 7.1% | |
| REZI Links: Profile News Message Board | |
| Charts:- Daily , Weekly | |
| Add REZI to Watchlist: View: Get Complete REZI Trend Analysis ➞ | |
 | KOP Koppers Holdings Inc. |
| Sector: Materials | |
| SubSector: Specialty Chemicals | |
| MarketCap: 232.657 Millions | |
| Recent Price: 53.47 Smart Investing & Trading Score: 51 | |
| Day Percent Change: 1.40% Day Change: 0.74 | |
| Week Change: 1.4% Year-to-date Change: 4.4% | |
| KOP Links: Profile News Message Board | |
| Charts:- Daily , Weekly | |
| Add KOP to Watchlist: View: Get Complete KOP Trend Analysis ➞ | |
 | RNA Avidity Biosciences, Inc. |
| Sector: Health Care | |
| SubSector: Biotechnology | |
| MarketCap: 12287 Millions | |
| Recent Price: 24.70 Smart Investing & Trading Score: 68 | |
| Day Percent Change: 1.40% Day Change: 0.34 | |
| Week Change: 1.4% Year-to-date Change: 173.2% | |
| RNA Links: Profile News Message Board | |
| Charts:- Daily , Weekly | |
| Add RNA to Watchlist: View: Get Complete RNA Trend Analysis ➞ | |
 | IHRT iHeartMedia, Inc. |
| Sector: Services & Goods | |
| SubSector: Broadcasting - Radio | |
| MarketCap: 694 Millions | |
| Recent Price: 2.17 Smart Investing & Trading Score: 59 | |
| Day Percent Change: 1.40% Day Change: 0.03 | |
| Week Change: 1.4% Year-to-date Change: -18.7% | |
| IHRT Links: Profile News Message Board | |
| Charts:- Daily , Weekly | |
| Add IHRT to Watchlist: View: Get Complete IHRT Trend Analysis ➞ | |
 | CALM Cal-Maine Foods, Inc. |
| Sector: Consumer Staples | |
| SubSector: Food - Major Diversified | |
| MarketCap: 2177.13 Millions | |
| Recent Price: 57.66 Smart Investing & Trading Score: 41 | |
| Day Percent Change: 1.39% Day Change: 0.79 | |
| Week Change: 1.39% Year-to-date Change: 0.5% | |
| CALM Links: Profile News Message Board | |
| Charts:- Daily , Weekly | |
| Add CALM to Watchlist: View: Get Complete CALM Trend Analysis ➞ | |
| Too many stocks? View smallcap stocks filtered by marketcap & sector |
| Marketcap: All SmallCap Stocks (default-no microcap), Large, Mid-Range, Small & MicroCap |
| Sector: Tech, Finance, Energy, Staples, Retail, Industrial, Materials, Utilities & Medical |
|
Best Stocks Today 12Stocks.com |
© 2024 12Stocks.com Terms & Conditions Privacy Contact Us
All Information Provided Only For Education And Not To Be Used For Investing or Trading. See Terms & Conditions


One More Thing ... Get Best Stocks Delivered Daily!
Never Ever Miss A Move With Our Top Ten Stocks Lists
Find Best Stocks In Any Market - Bull or Bear Market
Take A Peek At Our Top Ten Stocks Lists: Daily, Weekly, Year-to-Date & Top Trends
Find Best Stocks In Any Market - Bull or Bear Market
Take A Peek At Our Top Ten Stocks Lists: Daily, Weekly, Year-to-Date & Top Trends
Smallcap Stocks With Best Up Trends [0-bearish to 100-bullish]: Bakkt [100], Deciphera [100], Phibro Animal[100], Heartland Financial[100], PTC [100], Day One[100], Richardson Electronics[100], Fulton Financial[100], Cullinan Oncology[100], Lands [100], TransMedics Group[100]
Best Smallcap Stocks Year-to-Date:
CareMax [580.41%], Janux [421.92%], Bakkt [346.64%], Viking [305.75%], Longboard [247.46%], Alpine Immune[239.81%], Super Micro[213.22%], Avidity Biosciences[173.23%], Arcutis Bio[171.83%], Vera [167.31%], Cullinan Oncology[166.01%] Best Smallcap Stocks This Week:
Deciphera [72.56%], Phibro Animal[31.81%], Vaxxinity [31.65%], Zevia PBC[20.94%], Velo3D [19.97%], Acrivon [18.2%], Janux [18.18%], MultiPlan [15.53%], Heartland Financial[15.15%], Codexis [14.66%], Eyenovia [13.37%] Best Smallcap Stocks Daily:
Bakkt [2391.87%], Deciphera [72.56%], Phibro Animal[31.81%], Vaxxinity [31.65%], Zevia PBC[20.94%], Velo3D [19.97%], Acrivon [18.20%], Janux [18.18%], MultiPlan [15.53%], Heartland Financial[15.15%], Codexis [14.66%]