
 Login Sign Up


| |||||
 |  | ||||

| 12Stocks.com Market Intelligence |
Best SmallCap Stocks
|
| In a hurry? Small Cap Stock Lists: Performance Trends Table, Stock Charts
Sort Small Cap stocks: Daily, Weekly, Year-to-Date, Market Cap & Trends. Filter Small Cap stocks list by sector: Show all, Tech, Finance, Energy, Staples, Retail, Industrial, Materials, Utilities and HealthCare Filter Small Cap stocks list by size: All Large Medium Small and MicroCap |
| 12Stocks.com Small Cap Stocks Performances & Trends Daily | |||||||||
|
|  The overall Smart Investing & Trading Score is 88 (0-bearish to 100-bullish) which puts Small Cap index in short term bullish trend. The Smart Investing & Trading Score from previous trading session is 56 and hence an improvement of trend.
| ||||||||
Here are the Smart Investing & Trading Scores of the most requested small cap stocks at 12Stocks.com (click stock name for detailed review):
|


| 12Stocks.com: Investing in Smallcap Index with Stocks | |
|
The following table helps investors and traders sort through current performance and trends (as measured by Smart Investing & Trading Score) of various
stocks in the Smallcap Index. Quick View: Move mouse or cursor over stock symbol (ticker) to view short-term technical chart and over stock name to view long term chart. Click on  to add stock symbol to your watchlist and to add stock symbol to your watchlist and  to view watchlist. Click on any ticker or stock name for detailed market intelligence report for that stock. to view watchlist. Click on any ticker or stock name for detailed market intelligence report for that stock. |
12Stocks.com Performance of Stocks in Smallcap Index
| Ticker | Stock Name | Watchlist | Category | Recent Price | Smart Investing & Trading Score | Change % | Weekly Change% |
| SCPH | sc |   | Health Care | 4.58 | 52 | 2.00% | 2.00% |
| SXI | Standex | | Industrials | 176.25 | 70 | 1.99% | 1.99% |
| ORIC | ORIC | | Health Care | 8.23 | 32 | 1.98% | 1.98% |
| VYGR | Voyager | | Health Care | 7.77 | 65 | 1.97% | 1.97% |
| VECO | Veeco Instruments | | Technology | 35.85 | 80 | 1.96% | 1.96% |
| PLXS | Plexus | | Technology | 102.25 | 100 | 1.96% | 1.96% |
| SPSC | SPS Commerce | | Technology | 182.47 | 64 | 1.96% | 1.96% |
| SDGR | Schrodinger | | Health Care | 24.44 | 42 | 1.96% | 1.96% |
| PKOH | Park-Ohio | | Services & Goods | 24.56 | 49 | 1.95% | 1.95% |
| NVEC | NVE | | Technology | 81.96 | 70 | 1.95% | 1.95% |
| CWK | Cushman & Wakefield | | Financials | 9.91 | 67 | 1.95% | 1.95% |
| VERV | Verve | | Health Care | 6.26 | 22 | 1.95% | 1.95% |
| VSH | Vishay Inter | | Technology | 23.07 | 100 | 1.94% | 1.94% |
| CBAN | Colony Bankcorp | | Financials | 11.01 | 74 | 1.94% | 1.94% |
| AMPS | Altus Power | | Utilities | 3.69 | 17 | 1.93% | 1.93% |
| PGRE | Paramount Group | | Financials | 4.76 | 80 | 1.93% | 1.93% |
| HMST | HomeStreet | | Financials | 12.28 | 17 | 1.91% | 1.91% |
| UFPI | Universal Forest | | Industrials | 115.79 | 83 | 1.89% | 1.89% |
| THR | Thermon Group | | Industrials | 32.43 | 69 | 1.89% | 1.89% |
| CRBU | Caribou Biosciences | | Health Care | 3.78 | 20 | 1.89% | 1.89% |
| SLG | SL Green | | Financials | 51.56 | 68 | 1.88% | 1.88% |
| NWE | NorthWestern | | Utilities | 50.48 | 93 | 1.88% | 1.88% |
| MBUU | Malibu Boats | | Consumer Staples | 34.79 | 35 | 1.87% | 1.87% |
| CCSI | Consensus Cloud | | Technology | 12.50 | 27 | 1.87% | 1.87% |
| CNO | CNO Financial | | Financials | 26.89 | 57 | 1.86% | 1.86% |


| Too many stocks? View smallcap stocks filtered by marketcap & sector |
| Marketcap: All SmallCap Stocks (default-no microcap), Large, Mid-Range, Small |
| Smallcap Sector: Tech, Finance, Energy, Staples, Retail, Industrial, Materials, & Medical |
|
Get the most comprehensive stock market coverage daily at 12Stocks.com ➞ Best Stocks Today ➞ Best Stocks Weekly ➞ Best Stocks Year-to-Date ➞ Best Stocks Trends ➞  Best Stocks Today 12Stocks.com Best Nasdaq Stocks ➞ Best S&P 500 Stocks ➞ Best Tech Stocks ➞ Best Biotech Stocks ➞ |
| Detailed Overview of SmallCap Stocks |
| SmallCap Technical Overview, Leaders & Laggards, Top SmallCap ETF Funds & Detailed SmallCap Stocks List, Charts, Trends & More |
| Smallcap: Technical Analysis, Trends & YTD Performance | |
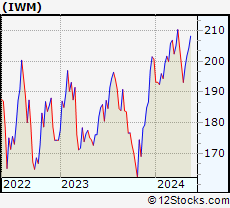
| SmallCap segment as represented by
IWM, an exchange-traded fund [ETF], holds basket of thousands of smallcap stocks from across all major sectors of the US stock market. The smallcap index (contains stocks like Riverbed & Sotheby's) is down by -0.37% and is currently underperforming the overall market by -6.93% year-to-date. Below is a quick view of technical charts and trends: | |
 IWM Weekly Chart |
|
| Long Term Trend: Very Good | |
| Medium Term Trend: Good | |
 IWM Daily Chart |
|
| Short Term Trend: Very Good | |
| Overall Trend Score: 88 | |
| YTD Performance: -0.37% | |
| **Trend Scores & Views Are Only For Educational Purposes And Not For Investing | |
| 12Stocks.com: Top Performing Small Cap Index Stocks | ||||||||||||||||||||||||||||||||||||||||||||||||
 The top performing Small Cap Index stocks year to date are
Now, more recently, over last week, the top performing Small Cap Index stocks on the move are


|
||||||||||||||||||||||||||||||||||||||||||||||||
| 12Stocks.com: Investing in Smallcap Index using Exchange Traded Funds | |
|
The following table shows list of key exchange traded funds (ETF) that
help investors track Smallcap index. The following list also includes leveraged ETF funds that track twice or thrice the daily returns of Smallcap indices. Short or inverse ETF funds move in the opposite direction to the index they track and are useful during market pullbacks or during bear markets. Quick View: Move mouse or cursor over ETF symbol (ticker) to view short-term technical chart and over ETF name to view long term chart. Click on ticker or stock name for detailed view. Click on to add stock symbol to your watchlist and to view watchlist. |
12Stocks.com List of ETFs that track Smallcap Index
| Ticker | ETF Name | Watchlist | Recent Price | Smart Investing & Trading Score | Change % | Week % | Year-to-date % |
| IWM | iShares Russell 2000 | | 199.96 | 88 | 0.79 | 0.79 | -0.37% |
| IJR | iShares Core S&P Small-Cap | | 106.41 | 93 | 0.72 | 0.72 | -1.7% |
| VTWO | Vanguard Russell 2000 ETF | | 80.78 | 88 | 0.70 | 0.7 | -0.39% |
| IWN | iShares Russell 2000 Value | | 152.05 | 93 | 0.60 | 0.6 | -2.11% |
| IWO | iShares Russell 2000 Growth | | 255.74 | 78 | 1.05 | 1.05 | 1.4% |
| IJS | iShares S&P Small-Cap 600 Value | | 97.95 | 70 | 0.78 | 0.78 | -4.97% |
| IJT | iShares S&P Small-Cap 600 Growth | | 126.96 | 88 | 0.69 | 0.69 | 1.45% |
| XSLV | PowerShares S&P SmallCap Low Volatil ETF | | 42.87 | 80 | 0.35 | 0.35 | -2.9% |
| SMLV | SPDR SSGA US Small Cap Low Volatil ETF | | 107.77 | 68 | 0.23 | 0.23 | -4.22% |
| SAA | ProShares Ultra SmallCap600 | | 23.27 | 88 | 1.00 | 1 | -6.73% |
| SBB | ProShares Short SmallCap600 | | 16.28 | 8 | -0.64 | -0.64 | 2.2% |
| SDD | ProShares UltraShort SmallCap600 | | 19.09 | 15 | -1.34 | -1.34 | 3.6% |
| 12Stocks.com: Charts, Trends, Fundamental Data and Performances of SmallCap Stocks | |
|
We now take in-depth look at all SmallCap stocks including charts, multi-period performances and overall trends (as measured by Smart Investing & Trading Score). One can sort SmallCap stocks (click link to choose) by Daily, Weekly and by Year-to-Date performances. Also, one can sort by size of the company or by market capitalization. |
| Select Your Default Chart Type: | |||||
| |||||
| Click on stock symbol or name for detailed view. Click on to add stock symbol to your watchlist and to view watchlist. Quick View: Move mouse or cursor over "Daily" to quickly view daily technical stock chart and over "Weekly" to view weekly technical stock chart. | |||||

 | SCPH scPharmaceuticals Inc. |
| Sector: Health Care | |
| SubSector: Biotechnology | |
| MarketCap: 136.185 Millions | |
| Recent Price: 4.58 Smart Investing & Trading Score: 52 | |
| Day Percent Change: 2.00% Day Change: 0.09 | |
| Week Change: 2% Year-to-date Change: -27.0% | |
| SCPH Links: Profile News Message Board | |
| Charts:- Daily , Weekly | |
| Add SCPH to Watchlist: View: Get Complete SCPH Trend Analysis ➞ | |
 | SXI Standex International Corporation |
| Sector: Industrials | |
| SubSector: Industrial Equipment & Components | |
| MarketCap: 644.109 Millions | |
| Recent Price: 176.25 Smart Investing & Trading Score: 70 | |
| Day Percent Change: 1.99% Day Change: 3.44 | |
| Week Change: 1.99% Year-to-date Change: 11.3% | |
| SXI Links: Profile News Message Board | |
| Charts:- Daily , Weekly | |
| Add SXI to Watchlist: View: Get Complete SXI Trend Analysis ➞ | |
 | ORIC ORIC Pharmaceuticals, Inc. |
| Sector: Health Care | |
| SubSector: Biotechnology | |
| MarketCap: 12787 Millions | |
| Recent Price: 8.23 Smart Investing & Trading Score: 32 | |
| Day Percent Change: 1.98% Day Change: 0.16 | |
| Week Change: 1.98% Year-to-date Change: -10.7% | |
| ORIC Links: Profile News Message Board | |
| Charts:- Daily , Weekly | |
| Add ORIC to Watchlist: View: Get Complete ORIC Trend Analysis ➞ | |
 | VYGR Voyager Therapeutics, Inc. |
| Sector: Health Care | |
| SubSector: Biotechnology | |
| MarketCap: 321.085 Millions | |
| Recent Price: 7.77 Smart Investing & Trading Score: 65 | |
| Day Percent Change: 1.97% Day Change: 0.15 | |
| Week Change: 1.97% Year-to-date Change: -7.9% | |
| VYGR Links: Profile News Message Board | |
| Charts:- Daily , Weekly | |
| Add VYGR to Watchlist: View: Get Complete VYGR Trend Analysis ➞ | |
 | VECO Veeco Instruments Inc. |
| Sector: Technology | |
| SubSector: Semiconductor Equipment & Materials | |
| MarketCap: 450.718 Millions | |
| Recent Price: 35.85 Smart Investing & Trading Score: 80 | |
| Day Percent Change: 1.96% Day Change: 0.69 | |
| Week Change: 1.96% Year-to-date Change: 15.5% | |
| VECO Links: Profile News Message Board | |
| Charts:- Daily , Weekly | |
| Add VECO to Watchlist: View: Get Complete VECO Trend Analysis ➞ | |
 | PLXS Plexus Corp. |
| Sector: Technology | |
| SubSector: Printed Circuit Boards | |
| MarketCap: 1457.15 Millions | |
| Recent Price: 102.25 Smart Investing & Trading Score: 100 | |
| Day Percent Change: 1.96% Day Change: 1.97 | |
| Week Change: 1.96% Year-to-date Change: -5.4% | |
| PLXS Links: Profile News Message Board | |
| Charts:- Daily , Weekly | |
| Add PLXS to Watchlist: View: Get Complete PLXS Trend Analysis ➞ | |
 | SPSC SPS Commerce, Inc. |
| Sector: Technology | |
| SubSector: Application Software | |
| MarketCap: 1398.02 Millions | |
| Recent Price: 182.47 Smart Investing & Trading Score: 64 | |
| Day Percent Change: 1.96% Day Change: 3.51 | |
| Week Change: 1.96% Year-to-date Change: -5.9% | |
| SPSC Links: Profile News Message Board | |
| Charts:- Daily , Weekly | |
| Add SPSC to Watchlist: View: Get Complete SPSC Trend Analysis ➞ | |
 | SDGR Schrodinger, Inc. |
| Sector: Health Care | |
| SubSector: Health Information Services | |
| MarketCap: 47287 Millions | |
| Recent Price: 24.44 Smart Investing & Trading Score: 42 | |
| Day Percent Change: 1.96% Day Change: 0.47 | |
| Week Change: 1.96% Year-to-date Change: -31.7% | |
| SDGR Links: Profile News Message Board | |
| Charts:- Daily , Weekly | |
| Add SDGR to Watchlist: View: Get Complete SDGR Trend Analysis ➞ | |
 | PKOH Park-Ohio Holdings Corp. |
| Sector: Services & Goods | |
| SubSector: Industrial Equipment Wholesale | |
| MarketCap: 214.358 Millions | |
| Recent Price: 24.56 Smart Investing & Trading Score: 49 | |
| Day Percent Change: 1.95% Day Change: 0.47 | |
| Week Change: 1.95% Year-to-date Change: -8.9% | |
| PKOH Links: Profile News Message Board | |
| Charts:- Daily , Weekly | |
| Add PKOH to Watchlist: View: Get Complete PKOH Trend Analysis ➞ | |
 | NVEC NVE Corporation |
| Sector: Technology | |
| SubSector: Semiconductor - Specialized | |
| MarketCap: 231.26 Millions | |
| Recent Price: 81.96 Smart Investing & Trading Score: 70 | |
| Day Percent Change: 1.95% Day Change: 1.57 | |
| Week Change: 1.95% Year-to-date Change: 4.5% | |
| NVEC Links: Profile News Message Board | |
| Charts:- Daily , Weekly | |
| Add NVEC to Watchlist: View: Get Complete NVEC Trend Analysis ➞ | |
 | CWK Cushman & Wakefield plc |
| Sector: Financials | |
| SubSector: Property Management | |
| MarketCap: 2651.62 Millions | |
| Recent Price: 9.91 Smart Investing & Trading Score: 67 | |
| Day Percent Change: 1.95% Day Change: 0.19 | |
| Week Change: 1.95% Year-to-date Change: -8.2% | |
| CWK Links: Profile News Message Board | |
| Charts:- Daily , Weekly | |
| Add CWK to Watchlist: View: Get Complete CWK Trend Analysis ➞ | |
 | VERV Verve Therapeutics, Inc. |
| Sector: Health Care | |
| SubSector: Biotechnology | |
| MarketCap: 1200 Millions | |
| Recent Price: 6.26 Smart Investing & Trading Score: 22 | |
| Day Percent Change: 1.95% Day Change: 0.12 | |
| Week Change: 1.95% Year-to-date Change: -55.1% | |
| VERV Links: Profile News Message Board | |
| Charts:- Daily , Weekly | |
| Add VERV to Watchlist: View: Get Complete VERV Trend Analysis ➞ | |
 | VSH Vishay Intertechnology, Inc. |
| Sector: Technology | |
| SubSector: Semiconductor - Broad Line | |
| MarketCap: 2132.52 Millions | |
| Recent Price: 23.07 Smart Investing & Trading Score: 100 | |
| Day Percent Change: 1.94% Day Change: 0.44 | |
| Week Change: 1.94% Year-to-date Change: -3.8% | |
| VSH Links: Profile News Message Board | |
| Charts:- Daily , Weekly | |
| Add VSH to Watchlist: View: Get Complete VSH Trend Analysis ➞ | |
 | CBAN Colony Bankcorp, Inc. |
| Sector: Financials | |
| SubSector: Regional - Mid-Atlantic Banks | |
| MarketCap: 115.559 Millions | |
| Recent Price: 11.01 Smart Investing & Trading Score: 74 | |
| Day Percent Change: 1.94% Day Change: 0.21 | |
| Week Change: 1.94% Year-to-date Change: -17.2% | |
| CBAN Links: Profile News Message Board | |
| Charts:- Daily , Weekly | |
| Add CBAN to Watchlist: View: Get Complete CBAN Trend Analysis ➞ | |
 | AMPS Altus Power, Inc. |
| Sector: Utilities | |
| SubSector: Utilities - Renewable | |
| MarketCap: 866 Millions | |
| Recent Price: 3.69 Smart Investing & Trading Score: 17 | |
| Day Percent Change: 1.93% Day Change: 0.07 | |
| Week Change: 1.93% Year-to-date Change: -46.4% | |
| AMPS Links: Profile News Message Board | |
| Charts:- Daily , Weekly | |
| Add AMPS to Watchlist: View: Get Complete AMPS Trend Analysis ➞ | |
 | PGRE Paramount Group, Inc. |
| Sector: Financials | |
| SubSector: Property Management | |
| MarketCap: 1722.72 Millions | |
| Recent Price: 4.76 Smart Investing & Trading Score: 80 | |
| Day Percent Change: 1.93% Day Change: 0.09 | |
| Week Change: 1.93% Year-to-date Change: -7.9% | |
| PGRE Links: Profile News Message Board | |
| Charts:- Daily , Weekly | |
| Add PGRE to Watchlist: View: Get Complete PGRE Trend Analysis ➞ | |
 | HMST HomeStreet, Inc. |
| Sector: Financials | |
| SubSector: Savings & Loans | |
| MarketCap: 535.33 Millions | |
| Recent Price: 12.28 Smart Investing & Trading Score: 17 | |
| Day Percent Change: 1.91% Day Change: 0.23 | |
| Week Change: 1.91% Year-to-date Change: 19.2% | |
| HMST Links: Profile News Message Board | |
| Charts:- Daily , Weekly | |
| Add HMST to Watchlist: View: Get Complete HMST Trend Analysis ➞ | |
 | UFPI Universal Forest Products, Inc. |
| Sector: Industrials | |
| SubSector: Lumber, Wood Production | |
| MarketCap: 2263.38 Millions | |
| Recent Price: 115.79 Smart Investing & Trading Score: 83 | |
| Day Percent Change: 1.89% Day Change: 2.15 | |
| Week Change: 1.89% Year-to-date Change: -7.8% | |
| UFPI Links: Profile News Message Board | |
| Charts:- Daily , Weekly | |
| Add UFPI to Watchlist: View: Get Complete UFPI Trend Analysis ➞ | |
 | THR Thermon Group Holdings, Inc. |
| Sector: Industrials | |
| SubSector: Diversified Machinery | |
| MarketCap: 492.816 Millions | |
| Recent Price: 32.43 Smart Investing & Trading Score: 69 | |
| Day Percent Change: 1.89% Day Change: 0.60 | |
| Week Change: 1.89% Year-to-date Change: -0.4% | |
| THR Links: Profile News Message Board | |
| Charts:- Daily , Weekly | |
| Add THR to Watchlist: View: Get Complete THR Trend Analysis ➞ | |
 | CRBU Caribou Biosciences, Inc. |
| Sector: Health Care | |
| SubSector: Biotechnology | |
| MarketCap: 258 Millions | |
| Recent Price: 3.78 Smart Investing & Trading Score: 20 | |
| Day Percent Change: 1.89% Day Change: 0.07 | |
| Week Change: 1.89% Year-to-date Change: -33.8% | |
| CRBU Links: Profile News Message Board | |
| Charts:- Daily , Weekly | |
| Add CRBU to Watchlist: View: Get Complete CRBU Trend Analysis ➞ | |
 | SLG SL Green Realty Corp. |
| Sector: Financials | |
| SubSector: REIT - Retail | |
| MarketCap: 4048.14 Millions | |
| Recent Price: 51.56 Smart Investing & Trading Score: 68 | |
| Day Percent Change: 1.88% Day Change: 0.95 | |
| Week Change: 1.88% Year-to-date Change: 14.2% | |
| SLG Links: Profile News Message Board | |
| Charts:- Daily , Weekly | |
| Add SLG to Watchlist: View: Get Complete SLG Trend Analysis ➞ | |
 | NWE NorthWestern Corporation |
| Sector: Utilities | |
| SubSector: Diversified Utilities | |
| MarketCap: 2801.8 Millions | |
| Recent Price: 50.48 Smart Investing & Trading Score: 93 | |
| Day Percent Change: 1.88% Day Change: 0.93 | |
| Week Change: 1.88% Year-to-date Change: -0.8% | |
| NWE Links: Profile News Message Board | |
| Charts:- Daily , Weekly | |
| Add NWE to Watchlist: View: Get Complete NWE Trend Analysis ➞ | |
 | MBUU Malibu Boats, Inc. |
| Sector: Consumer Staples | |
| SubSector: Recreational Goods, Other | |
| MarketCap: 561.059 Millions | |
| Recent Price: 34.79 Smart Investing & Trading Score: 35 | |
| Day Percent Change: 1.87% Day Change: 0.64 | |
| Week Change: 1.87% Year-to-date Change: -36.5% | |
| MBUU Links: Profile News Message Board | |
| Charts:- Daily , Weekly | |
| Add MBUU to Watchlist: View: Get Complete MBUU Trend Analysis ➞ | |
 | CCSI Consensus Cloud Solutions, Inc. |
| Sector: Technology | |
| SubSector: Software - Infrastructure | |
| MarketCap: 609 Millions | |
| Recent Price: 12.50 Smart Investing & Trading Score: 27 | |
| Day Percent Change: 1.87% Day Change: 0.23 | |
| Week Change: 1.87% Year-to-date Change: -53.1% | |
| CCSI Links: Profile News Message Board | |
| Charts:- Daily , Weekly | |
| Add CCSI to Watchlist: View: Get Complete CCSI Trend Analysis ➞ | |
 | CNO CNO Financial Group, Inc. |
| Sector: Financials | |
| SubSector: Accident & Health Insurance | |
| MarketCap: 1746.9 Millions | |
| Recent Price: 26.89 Smart Investing & Trading Score: 57 | |
| Day Percent Change: 1.86% Day Change: 0.49 | |
| Week Change: 1.86% Year-to-date Change: -3.6% | |
| CNO Links: Profile News Message Board | |
| Charts:- Daily , Weekly | |
| Add CNO to Watchlist: View: Get Complete CNO Trend Analysis ➞ | |
| Too many stocks? View smallcap stocks filtered by marketcap & sector |
| Marketcap: All SmallCap Stocks (default-no microcap), Large, Mid-Range, Small & MicroCap |
| Sector: Tech, Finance, Energy, Staples, Retail, Industrial, Materials, Utilities & Medical |
|
Best Stocks Today 12Stocks.com |
© 2024 12Stocks.com Terms & Conditions Privacy Contact Us
All Information Provided Only For Education And Not To Be Used For Investing or Trading. See Terms & Conditions


One More Thing ... Get Best Stocks Delivered Daily!
Never Ever Miss A Move With Our Top Ten Stocks Lists
Find Best Stocks In Any Market - Bull or Bear Market
Take A Peek At Our Top Ten Stocks Lists: Daily, Weekly, Year-to-Date & Top Trends
Find Best Stocks In Any Market - Bull or Bear Market
Take A Peek At Our Top Ten Stocks Lists: Daily, Weekly, Year-to-Date & Top Trends
Smallcap Stocks With Best Up Trends [0-bearish to 100-bullish]: Bakkt [100], Deciphera [100], Phibro Animal[100], Heartland Financial[100], PTC [100], Sight Sciences[100], Richardson Electronics[100], Fulton Financial[100], TPI Composites[100], Cullinan Oncology[100], Lands [100]
Best Smallcap Stocks Year-to-Date:
CareMax [580.41%], Janux [421.92%], Bakkt [346.64%], Viking [305.75%], Longboard [247.46%], Alpine Immune[239.81%], Super Micro[213.22%], Avidity Biosciences[173.23%], Arcutis Bio[171.83%], Vera [167.31%], Cullinan Oncology[166.01%] Best Smallcap Stocks This Week:
Deciphera [72.56%], Phibro Animal[31.81%], Vaxxinity [31.65%], Zevia PBC[20.94%], Velo3D [19.97%], Acrivon [18.2%], Janux [18.18%], MultiPlan [15.53%], Heartland Financial[15.15%], Codexis [14.66%], Eyenovia [13.37%] Best Smallcap Stocks Daily:
Bakkt [2391.87%], Deciphera [72.56%], Phibro Animal[31.81%], Vaxxinity [31.65%], Zevia PBC[20.94%], Velo3D [19.97%], Acrivon [18.20%], Janux [18.18%], MultiPlan [15.53%], Heartland Financial[15.15%], Codexis [14.66%]