
 Login Sign Up


| |||||
 |  | ||||

| 12Stocks.com Market Intelligence |
Best SmallCap Stocks
|
| In a hurry? Small Cap Stock Lists: Performance Trends Table, Stock Charts
Sort Small Cap stocks: Daily, Weekly, Year-to-Date, Market Cap & Trends. Filter Small Cap stocks list by sector: Show all, Tech, Finance, Energy, Staples, Retail, Industrial, Materials, Utilities and HealthCare Filter Small Cap stocks list by size: All Large Medium Small and MicroCap |
| 12Stocks.com Small Cap Stocks Performances & Trends Daily | |||||||||
|
|  The overall Smart Investing & Trading Score is 88 (0-bearish to 100-bullish) which puts Small Cap index in short term bullish trend. The Smart Investing & Trading Score from previous trading session is 56 and hence an improvement of trend.
| ||||||||
Here are the Smart Investing & Trading Scores of the most requested small cap stocks at 12Stocks.com (click stock name for detailed review):
|


| 12Stocks.com: Investing in Smallcap Index with Stocks | |
|
The following table helps investors and traders sort through current performance and trends (as measured by Smart Investing & Trading Score) of various
stocks in the Smallcap Index. Quick View: Move mouse or cursor over stock symbol (ticker) to view short-term technical chart and over stock name to view long term chart. Click on  to add stock symbol to your watchlist and to add stock symbol to your watchlist and  to view watchlist. Click on any ticker or stock name for detailed market intelligence report for that stock. to view watchlist. Click on any ticker or stock name for detailed market intelligence report for that stock. |
12Stocks.com Performance of Stocks in Smallcap Index
| Ticker | Stock Name | Watchlist | Category | Recent Price | Smart Investing & Trading Score | Change % | Weekly Change% |
| VIGL | Vigil Neuroscience |   | Health Care | 2.60 | 27 | -4.06% | -4.06% |
| CZNC | Citizens & Northern | | Financials | 17.16 | 48 | -4.08% | -4.08% |
| IVAC | Intevac | | Technology | 4.21 | 100 | -4.10% | -4.10% |
| SOI | Solaris Oilfield | | Energy | 9.24 | 95 | -4.15% | -4.15% |
| TRUE | TrueCar | | Technology | 2.76 | 10 | -4.17% | -4.17% |
| CYTK | Cytokinetics | | Health Care | 62.53 | 10 | -4.30% | -4.30% |
| MAXN | Maxeon Solar | | Technology | 2.00 | 74 | -4.31% | -4.31% |
| ELF | e.l.f. Beauty | | Consumer Staples | 171.86 | 71 | -4.33% | -4.33% |
| KRNY | Kearny Financial | | Financials | 5.47 | 10 | -4.37% | -4.37% |
| STOK | Stoke | | Health Care | 11.86 | 75 | -4.43% | -4.43% |
| CABA | Cabaletta Bio | | Health Care | 10.48 | 0 | -4.81% | -4.81% |
| ACET | Aceto | | Materials | 1.59 | 50 | -5.36% | -5.36% |
| SEAT | Vivid Seats | | Services & Goods | 5.60 | 66 | -5.49% | -5.49% |
| AVTE | Aerovate | | Health Care | 20.55 | 54 | -5.52% | -5.52% |
| ACNB | ACNB | | Financials | 32.25 | 43 | -5.59% | -5.59% |
| PRLD | Prelude | | Health Care | 3.84 | 56 | -5.65% | -5.65% |
| MBI | MBIA | | Financials | 6.41 | 75 | -6.01% | -6.01% |
| OIS | Oil States | | Energy | 4.05 | 0 | -6.03% | -6.03% |
| INFU | InfuSystem | | Health Care | 7.62 | 35 | -6.16% | -6.16% |
| GCI | Gannett Co | | Services & Goods | 2.42 | 25 | -6.20% | -6.20% |
| XFOR | X4 | | Health Care | 1.09 | 33 | -6.44% | -6.44% |
| BMRC | Bank of Marin Bancorp | | Financials | 14.44 | 28 | -6.48% | -6.48% |
| UMBF | UMB Financial | | Financials | 77.75 | 18 | -6.52% | -6.52% |
| GNLX | Genelux | | Health Care | 3.17 | 15 | -7.31% | -7.31% |
| DZSI | DASAN Zhone | | Technology | 1.09 | 35 | -7.63% | -7.63% |


| Too many stocks? View smallcap stocks filtered by marketcap & sector |
| Marketcap: All SmallCap Stocks (default-no microcap), Large, Mid-Range, Small |
| Smallcap Sector: Tech, Finance, Energy, Staples, Retail, Industrial, Materials, & Medical |
|
Get the most comprehensive stock market coverage daily at 12Stocks.com ➞ Best Stocks Today ➞ Best Stocks Weekly ➞ Best Stocks Year-to-Date ➞ Best Stocks Trends ➞  Best Stocks Today 12Stocks.com Best Nasdaq Stocks ➞ Best S&P 500 Stocks ➞ Best Tech Stocks ➞ Best Biotech Stocks ➞ |
| Detailed Overview of SmallCap Stocks |
| SmallCap Technical Overview, Leaders & Laggards, Top SmallCap ETF Funds & Detailed SmallCap Stocks List, Charts, Trends & More |
| Smallcap: Technical Analysis, Trends & YTD Performance | |
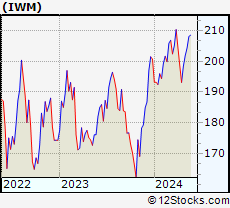
| SmallCap segment as represented by
IWM, an exchange-traded fund [ETF], holds basket of thousands of smallcap stocks from across all major sectors of the US stock market. The smallcap index (contains stocks like Riverbed & Sotheby's) is down by -0.37% and is currently underperforming the overall market by -6.93% year-to-date. Below is a quick view of technical charts and trends: | |
 IWM Weekly Chart |
|
| Long Term Trend: Very Good | |
| Medium Term Trend: Good | |
 IWM Daily Chart |
|
| Short Term Trend: Very Good | |
| Overall Trend Score: 88 | |
| YTD Performance: -0.37% | |
| **Trend Scores & Views Are Only For Educational Purposes And Not For Investing | |
| 12Stocks.com: Top Performing Small Cap Index Stocks | ||||||||||||||||||||||||||||||||||||||||||||||||
 The top performing Small Cap Index stocks year to date are
Now, more recently, over last week, the top performing Small Cap Index stocks on the move are


|
||||||||||||||||||||||||||||||||||||||||||||||||
| 12Stocks.com: Investing in Smallcap Index using Exchange Traded Funds | |
|
The following table shows list of key exchange traded funds (ETF) that
help investors track Smallcap index. The following list also includes leveraged ETF funds that track twice or thrice the daily returns of Smallcap indices. Short or inverse ETF funds move in the opposite direction to the index they track and are useful during market pullbacks or during bear markets. Quick View: Move mouse or cursor over ETF symbol (ticker) to view short-term technical chart and over ETF name to view long term chart. Click on ticker or stock name for detailed view. Click on to add stock symbol to your watchlist and to view watchlist. |
12Stocks.com List of ETFs that track Smallcap Index
| Ticker | ETF Name | Watchlist | Recent Price | Smart Investing & Trading Score | Change % | Week % | Year-to-date % |
| IWM | iShares Russell 2000 | | 199.96 | 88 | 0.79 | 0.79 | -0.37% |
| IJR | iShares Core S&P Small-Cap | | 106.41 | 93 | 0.72 | 0.72 | -1.7% |
| VTWO | Vanguard Russell 2000 ETF | | 80.78 | 88 | 0.70 | 0.7 | -0.39% |
| IWN | iShares Russell 2000 Value | | 152.05 | 93 | 0.60 | 0.6 | -2.11% |
| IWO | iShares Russell 2000 Growth | | 255.74 | 78 | 1.05 | 1.05 | 1.4% |
| IJS | iShares S&P Small-Cap 600 Value | | 97.95 | 70 | 0.78 | 0.78 | -4.97% |
| IJT | iShares S&P Small-Cap 600 Growth | | 126.96 | 88 | 0.69 | 0.69 | 1.45% |
| XSLV | PowerShares S&P SmallCap Low Volatil ETF | | 42.87 | 80 | 0.35 | 0.35 | -2.9% |
| SMLV | SPDR SSGA US Small Cap Low Volatil ETF | | 107.77 | 68 | 0.23 | 0.23 | -4.22% |
| SAA | ProShares Ultra SmallCap600 | | 23.27 | 88 | 1.00 | 1 | -6.73% |
| SBB | ProShares Short SmallCap600 | | 16.28 | 8 | -0.64 | -0.64 | 2.2% |
| SDD | ProShares UltraShort SmallCap600 | | 19.09 | 15 | -1.34 | -1.34 | 3.6% |
| 12Stocks.com: Charts, Trends, Fundamental Data and Performances of SmallCap Stocks | |
|
We now take in-depth look at all SmallCap stocks including charts, multi-period performances and overall trends (as measured by Smart Investing & Trading Score). One can sort SmallCap stocks (click link to choose) by Daily, Weekly and by Year-to-Date performances. Also, one can sort by size of the company or by market capitalization. |
| Select Your Default Chart Type: | |||||
| |||||
| Click on stock symbol or name for detailed view. Click on to add stock symbol to your watchlist and to view watchlist. Quick View: Move mouse or cursor over "Daily" to quickly view daily technical stock chart and over "Weekly" to view weekly technical stock chart. | |||||

 | VIGL Vigil Neuroscience, Inc. |
| Sector: Health Care | |
| SubSector: Biotechnology | |
| MarketCap: 339 Millions | |
| Recent Price: 2.60 Smart Investing & Trading Score: 27 | |
| Day Percent Change: -4.06% Day Change: -0.11 | |
| Week Change: -4.06% Year-to-date Change: -24.2% | |
| VIGL Links: Profile News Message Board | |
| Charts:- Daily , Weekly | |
| Add VIGL to Watchlist: View: Get Complete VIGL Trend Analysis ➞ | |
 | CZNC Citizens & Northern Corporation |
| Sector: Financials | |
| SubSector: Regional - Mid-Atlantic Banks | |
| MarketCap: 274.459 Millions | |
| Recent Price: 17.16 Smart Investing & Trading Score: 48 | |
| Day Percent Change: -4.08% Day Change: -0.73 | |
| Week Change: -4.08% Year-to-date Change: -23.5% | |
| CZNC Links: Profile News Message Board | |
| Charts:- Daily , Weekly | |
| Add CZNC to Watchlist: View: Get Complete CZNC Trend Analysis ➞ | |
 | IVAC Intevac, Inc. |
| Sector: Technology | |
| SubSector: Diversified Electronics | |
| MarketCap: 89.2396 Millions | |
| Recent Price: 4.21 Smart Investing & Trading Score: 100 | |
| Day Percent Change: -4.10% Day Change: -0.18 | |
| Week Change: -4.1% Year-to-date Change: -2.6% | |
| IVAC Links: Profile News Message Board | |
| Charts:- Daily , Weekly | |
| Add IVAC to Watchlist: View: Get Complete IVAC Trend Analysis ➞ | |
 | SOI Solaris Oilfield Infrastructure, Inc. |
| Sector: Energy | |
| SubSector: Oil & Gas Equipment & Services | |
| MarketCap: 267.361 Millions | |
| Recent Price: 9.24 Smart Investing & Trading Score: 95 | |
| Day Percent Change: -4.15% Day Change: -0.40 | |
| Week Change: -4.15% Year-to-date Change: 16.1% | |
| SOI Links: Profile News Message Board | |
| Charts:- Daily , Weekly | |
| Add SOI to Watchlist: View: Get Complete SOI Trend Analysis ➞ | |
 | TRUE TrueCar, Inc. |
| Sector: Technology | |
| SubSector: Internet Service Providers | |
| MarketCap: 244.18 Millions | |
| Recent Price: 2.76 Smart Investing & Trading Score: 10 | |
| Day Percent Change: -4.17% Day Change: -0.12 | |
| Week Change: -4.17% Year-to-date Change: -20.2% | |
| TRUE Links: Profile News Message Board | |
| Charts:- Daily , Weekly | |
| Add TRUE to Watchlist: View: Get Complete TRUE Trend Analysis ➞ | |
 | CYTK Cytokinetics, Incorporated |
| Sector: Health Care | |
| SubSector: Biotechnology | |
| MarketCap: 654.285 Millions | |
| Recent Price: 62.53 Smart Investing & Trading Score: 10 | |
| Day Percent Change: -4.30% Day Change: -2.81 | |
| Week Change: -4.3% Year-to-date Change: -25.1% | |
| CYTK Links: Profile News Message Board | |
| Charts:- Daily , Weekly | |
| Add CYTK to Watchlist: View: Get Complete CYTK Trend Analysis ➞ | |
 | MAXN Maxeon Solar Technologies, Ltd. |
| Sector: Technology | |
| SubSector: Solar | |
| MarketCap: 88787 Millions | |
| Recent Price: 2.00 Smart Investing & Trading Score: 74 | |
| Day Percent Change: -4.31% Day Change: -0.09 | |
| Week Change: -4.31% Year-to-date Change: -72.1% | |
| MAXN Links: Profile News Message Board | |
| Charts:- Daily , Weekly | |
| Add MAXN to Watchlist: View: Get Complete MAXN Trend Analysis ➞ | |
 | ELF e.l.f. Beauty, Inc. |
| Sector: Consumer Staples | |
| SubSector: Personal Products | |
| MarketCap: 497.985 Millions | |
| Recent Price: 171.86 Smart Investing & Trading Score: 71 | |
| Day Percent Change: -4.33% Day Change: -7.77 | |
| Week Change: -4.33% Year-to-date Change: 19.1% | |
| ELF Links: Profile News Message Board | |
| Charts:- Daily , Weekly | |
| Add ELF to Watchlist: View: Get Complete ELF Trend Analysis ➞ | |
 | KRNY Kearny Financial Corp. |
| Sector: Financials | |
| SubSector: Savings & Loans | |
| MarketCap: 781.73 Millions | |
| Recent Price: 5.47 Smart Investing & Trading Score: 10 | |
| Day Percent Change: -4.37% Day Change: -0.25 | |
| Week Change: -4.37% Year-to-date Change: -39.0% | |
| KRNY Links: Profile News Message Board | |
| Charts:- Daily , Weekly | |
| Add KRNY to Watchlist: View: Get Complete KRNY Trend Analysis ➞ | |
 | STOK Stoke Therapeutics, Inc. |
| Sector: Health Care | |
| SubSector: Biotechnology | |
| MarketCap: 772.485 Millions | |
| Recent Price: 11.86 Smart Investing & Trading Score: 75 | |
| Day Percent Change: -4.43% Day Change: -0.55 | |
| Week Change: -4.43% Year-to-date Change: 125.5% | |
| STOK Links: Profile News Message Board | |
| Charts:- Daily , Weekly | |
| Add STOK to Watchlist: View: Get Complete STOK Trend Analysis ➞ | |
 | CABA Cabaletta Bio, Inc. |
| Sector: Health Care | |
| SubSector: Biotechnology | |
| MarketCap: 222.085 Millions | |
| Recent Price: 10.48 Smart Investing & Trading Score: 0 | |
| Day Percent Change: -4.81% Day Change: -0.53 | |
| Week Change: -4.81% Year-to-date Change: -53.8% | |
| CABA Links: Profile News Message Board | |
| Charts:- Daily , Weekly | |
| Add CABA to Watchlist: View: Get Complete CABA Trend Analysis ➞ | |
 | ACET Aceto Corporation |
| Sector: Materials | |
| SubSector: Chemicals - Major Diversified | |
| MarketCap: 453.16 Millions | |
| Recent Price: 1.59 Smart Investing & Trading Score: 50 | |
| Day Percent Change: -5.36% Day Change: -0.09 | |
| Week Change: -5.36% Year-to-date Change: -15.9% | |
| ACET Links: Profile News Message Board | |
| Charts:- Daily , Weekly | |
| Add ACET to Watchlist: View: Get Complete ACET Trend Analysis ➞ | |
 | SEAT Vivid Seats Inc. |
| Sector: Services & Goods | |
| SubSector: Internet Content & Information | |
| MarketCap: 1560 Millions | |
| Recent Price: 5.60 Smart Investing & Trading Score: 66 | |
| Day Percent Change: -5.49% Day Change: -0.33 | |
| Week Change: -5.49% Year-to-date Change: -10.3% | |
| SEAT Links: Profile News Message Board | |
| Charts:- Daily , Weekly | |
| Add SEAT to Watchlist: View: Get Complete SEAT Trend Analysis ➞ | |
 | AVTE Aerovate Therapeutics, Inc. |
| Sector: Health Care | |
| SubSector: Biotechnology | |
| MarketCap: 478 Millions | |
| Recent Price: 20.55 Smart Investing & Trading Score: 54 | |
| Day Percent Change: -5.52% Day Change: -1.20 | |
| Week Change: -5.52% Year-to-date Change: -9.0% | |
| AVTE Links: Profile News Message Board | |
| Charts:- Daily , Weekly | |
| Add AVTE to Watchlist: View: Get Complete AVTE Trend Analysis ➞ | |
 | ACNB ACNB Corporation |
| Sector: Financials | |
| SubSector: Regional - Southwest Banks | |
| MarketCap: 231.065 Millions | |
| Recent Price: 32.25 Smart Investing & Trading Score: 43 | |
| Day Percent Change: -5.59% Day Change: -1.91 | |
| Week Change: -5.59% Year-to-date Change: -28.0% | |
| ACNB Links: Profile News Message Board | |
| Charts:- Daily , Weekly | |
| Add ACNB to Watchlist: View: Get Complete ACNB Trend Analysis ➞ | |
 | PRLD Prelude Therapeutics Incorporated |
| Sector: Health Care | |
| SubSector: Biotechnology | |
| MarketCap: 26087 Millions | |
| Recent Price: 3.84 Smart Investing & Trading Score: 56 | |
| Day Percent Change: -5.65% Day Change: -0.23 | |
| Week Change: -5.65% Year-to-date Change: -11.7% | |
| PRLD Links: Profile News Message Board | |
| Charts:- Daily , Weekly | |
| Add PRLD to Watchlist: View: Get Complete PRLD Trend Analysis ➞ | |
 | MBI MBIA Inc. |
| Sector: Financials | |
| SubSector: Property & Casualty Insurance | |
| MarketCap: 539.012 Millions | |
| Recent Price: 6.41 Smart Investing & Trading Score: 75 | |
| Day Percent Change: -6.01% Day Change: -0.41 | |
| Week Change: -6.01% Year-to-date Change: 4.7% | |
| MBI Links: Profile News Message Board | |
| Charts:- Daily , Weekly | |
| Add MBI to Watchlist: View: Get Complete MBI Trend Analysis ➞ | |
 | OIS Oil States International, Inc. |
| Sector: Energy | |
| SubSector: Oil & Gas Equipment & Services | |
| MarketCap: 131.061 Millions | |
| Recent Price: 4.05 Smart Investing & Trading Score: 0 | |
| Day Percent Change: -6.03% Day Change: -0.26 | |
| Week Change: -6.03% Year-to-date Change: -40.4% | |
| OIS Links: Profile News Message Board | |
| Charts:- Daily , Weekly | |
| Add OIS to Watchlist: View: Get Complete OIS Trend Analysis ➞ | |
 | INFU InfuSystem Holdings Inc. |
| Sector: Health Care | |
| SubSector: Medical Instruments & Supplies | |
| MarketCap: 136.76 Millions | |
| Recent Price: 7.62 Smart Investing & Trading Score: 35 | |
| Day Percent Change: -6.16% Day Change: -0.50 | |
| Week Change: -6.16% Year-to-date Change: -27.7% | |
| INFU Links: Profile News Message Board | |
| Charts:- Daily , Weekly | |
| Add INFU to Watchlist: View: Get Complete INFU Trend Analysis ➞ | |
 | GCI Gannett Co., Inc. |
| Sector: Services & Goods | |
| SubSector: Publishing - Newspapers | |
| MarketCap: 222.322 Millions | |
| Recent Price: 2.42 Smart Investing & Trading Score: 25 | |
| Day Percent Change: -6.20% Day Change: -0.16 | |
| Week Change: -6.2% Year-to-date Change: 5.2% | |
| GCI Links: Profile News Message Board | |
| Charts:- Daily , Weekly | |
| Add GCI to Watchlist: View: Get Complete GCI Trend Analysis ➞ | |
 | XFOR X4 Pharmaceuticals, Inc. |
| Sector: Health Care | |
| SubSector: Biotechnology | |
| MarketCap: 143.385 Millions | |
| Recent Price: 1.09 Smart Investing & Trading Score: 33 | |
| Day Percent Change: -6.44% Day Change: -0.07 | |
| Week Change: -6.44% Year-to-date Change: 30.0% | |
| XFOR Links: Profile News Message Board | |
| Charts:- Daily , Weekly | |
| Add XFOR to Watchlist: View: Get Complete XFOR Trend Analysis ➞ | |
 | BMRC Bank of Marin Bancorp |
| Sector: Financials | |
| SubSector: Regional - Pacific Banks | |
| MarketCap: 367.929 Millions | |
| Recent Price: 14.44 Smart Investing & Trading Score: 28 | |
| Day Percent Change: -6.48% Day Change: -1.00 | |
| Week Change: -6.48% Year-to-date Change: -34.4% | |
| BMRC Links: Profile News Message Board | |
| Charts:- Daily , Weekly | |
| Add BMRC to Watchlist: View: Get Complete BMRC Trend Analysis ➞ | |
 | UMBF UMB Financial Corporation |
| Sector: Financials | |
| SubSector: Regional - Southwest Banks | |
| MarketCap: 2207.35 Millions | |
| Recent Price: 77.75 Smart Investing & Trading Score: 18 | |
| Day Percent Change: -6.52% Day Change: -5.42 | |
| Week Change: -6.52% Year-to-date Change: -6.9% | |
| UMBF Links: Profile News Message Board | |
| Charts:- Daily , Weekly | |
| Add UMBF to Watchlist: View: Get Complete UMBF Trend Analysis ➞ | |
 | GNLX Genelux Corporation |
| Sector: Health Care | |
| SubSector: Biotechnology | |
| MarketCap: 820 Millions | |
| Recent Price: 3.17 Smart Investing & Trading Score: 15 | |
| Day Percent Change: -7.31% Day Change: -0.25 | |
| Week Change: -7.31% Year-to-date Change: -79.2% | |
| GNLX Links: Profile News Message Board | |
| Charts:- Daily , Weekly | |
| Add GNLX to Watchlist: View: Get Complete GNLX Trend Analysis ➞ | |
 | DZSI DASAN Zhone Solutions, Inc. |
| Sector: Technology | |
| SubSector: Communication Equipment | |
| MarketCap: 90.0539 Millions | |
| Recent Price: 1.09 Smart Investing & Trading Score: 35 | |
| Day Percent Change: -7.63% Day Change: -0.09 | |
| Week Change: -7.63% Year-to-date Change: -44.7% | |
| DZSI Links: Profile News Message Board | |
| Charts:- Daily , Weekly | |
| Add DZSI to Watchlist: View: Get Complete DZSI Trend Analysis ➞ | |
| Too many stocks? View smallcap stocks filtered by marketcap & sector |
| Marketcap: All SmallCap Stocks (default-no microcap), Large, Mid-Range, Small & MicroCap |
| Sector: Tech, Finance, Energy, Staples, Retail, Industrial, Materials, Utilities & Medical |
|
Best Stocks Today 12Stocks.com |
© 2024 12Stocks.com Terms & Conditions Privacy Contact Us
All Information Provided Only For Education And Not To Be Used For Investing or Trading. See Terms & Conditions


One More Thing ... Get Best Stocks Delivered Daily!
Never Ever Miss A Move With Our Top Ten Stocks Lists
Find Best Stocks In Any Market - Bull or Bear Market
Take A Peek At Our Top Ten Stocks Lists: Daily, Weekly, Year-to-Date & Top Trends
Find Best Stocks In Any Market - Bull or Bear Market
Take A Peek At Our Top Ten Stocks Lists: Daily, Weekly, Year-to-Date & Top Trends
Smallcap Stocks With Best Up Trends [0-bearish to 100-bullish]: Bakkt [100], Deciphera [100], Phibro Animal[100], Heartland Financial[100], PTC [100], Sight Sciences[100], Richardson Electronics[100], Fulton Financial[100], TPI Composites[100], Cullinan Oncology[100], Lands [100]
Best Smallcap Stocks Year-to-Date:
CareMax [580.41%], Janux [421.92%], Bakkt [346.64%], Viking [305.75%], Longboard [247.46%], Alpine Immune[239.81%], Super Micro[213.22%], Avidity Biosciences[173.23%], Arcutis Bio[171.83%], Vera [167.31%], Cullinan Oncology[166.01%] Best Smallcap Stocks This Week:
Deciphera [72.56%], Phibro Animal[31.81%], Vaxxinity [31.65%], Zevia PBC[20.94%], Velo3D [19.97%], Acrivon [18.2%], Janux [18.18%], MultiPlan [15.53%], Heartland Financial[15.15%], Codexis [14.66%], Eyenovia [13.37%] Best Smallcap Stocks Daily:
Bakkt [2391.87%], Deciphera [72.56%], Phibro Animal[31.81%], Vaxxinity [31.65%], Zevia PBC[20.94%], Velo3D [19.97%], Acrivon [18.20%], Janux [18.18%], MultiPlan [15.53%], Heartland Financial[15.15%], Codexis [14.66%]