
 Login Sign Up


| |||||
 |  | ||||

| 12Stocks.com Market Intelligence |
Best SmallCap Stocks
|
| In a hurry? Small Cap Stock Lists: Performance Trends Table, Stock Charts
Sort Small Cap stocks: Daily, Weekly, Year-to-Date, Market Cap & Trends. Filter Small Cap stocks list by sector: Show all, Tech, Finance, Energy, Staples, Retail, Industrial, Materials, Utilities and HealthCare Filter Small Cap stocks list by size: All Large Medium Small and MicroCap |
| 12Stocks.com Small Cap Stocks Performances & Trends Daily | |||||||||
|
|  The overall Smart Investing & Trading Score is 88 (0-bearish to 100-bullish) which puts Small Cap index in short term bullish trend. The Smart Investing & Trading Score from previous trading session is 56 and hence an improvement of trend.
| ||||||||
Here are the Smart Investing & Trading Scores of the most requested small cap stocks at 12Stocks.com (click stock name for detailed review):
|


| 12Stocks.com: Investing in Smallcap Index with Stocks | |
|
The following table helps investors and traders sort through current performance and trends (as measured by Smart Investing & Trading Score) of various
stocks in the Smallcap Index. Quick View: Move mouse or cursor over stock symbol (ticker) to view short-term technical chart and over stock name to view long term chart. Click on  to add stock symbol to your watchlist and to add stock symbol to your watchlist and  to view watchlist. Click on any ticker or stock name for detailed market intelligence report for that stock. to view watchlist. Click on any ticker or stock name for detailed market intelligence report for that stock. |
12Stocks.com Performance of Stocks in Smallcap Index
| Ticker | Stock Name | Watchlist | Category | Recent Price | Smart Investing & Trading Score | Change % | Weekly Change% |
| DJCO | Daily Journal |   | Services & Goods | 338.30 | 39 | -2.45% | -2.45% |
| WSBF | Waterstone Financial | | Financials | 11.50 | 42 | -2.46% | -2.46% |
| OCFC | OceanFirst Financial | | Financials | 14.99 | 32 | -2.47% | -2.47% |
| LOCO | El Pollo | | Services & Goods | 8.69 | 49 | -2.47% | -2.47% |
| NRIM | Northrim BanCorp | | Financials | 47.80 | 52 | -2.49% | -2.49% |
| DMRC | Digimarc | | Technology | 21.82 | 22 | -2.50% | -2.50% |
| LZ | LegalZoom.com | | Industrials | 12.17 | 56 | -2.52% | -2.52% |
| TOWN | TowneBank | | Financials | 26.24 | 8 | -2.53% | -2.53% |
| ACDC | ProFrac Holding | | Energy | 8.01 | 43 | -2.55% | -2.55% |
| TSBK | Timberland Bancorp | | Financials | 24.60 | 10 | -2.57% | -2.57% |
| EGRX | Eagle | | Health Care | 4.05 | 10 | -2.64% | -2.64% |
| SASR | Sandy Spring | | Financials | 20.92 | 42 | -2.65% | -2.65% |
| FEAM | 5E Advanced | | Materials | 1.10 | 17 | -2.65% | -2.65% |
| VTYX | Ventyx Biosciences | | Health Care | 3.84 | 36 | -2.66% | -2.66% |
| IBTX | Independent Bank | | Financials | 38.29 | 0 | -2.67% | -2.67% |
| STRA | Strategic Education | | Services & Goods | 117.82 | 100 | -2.68% | -2.68% |
| FRBA | First Bank | | Financials | 11.81 | 0 | -2.72% | -2.72% |
| RAPT | RAPT | | Health Care | 7.88 | 32 | -2.72% | -2.72% |
| VLY | Valley National | | Financials | 7.12 | 10 | -2.73% | -2.73% |
| RIGL | Rigel | | Health Care | 1.07 | 10 | -2.73% | -2.73% |
| AX | Axos Financial | | Financials | 51.59 | 37 | -2.75% | -2.75% |
| KRUS | Kura Sushi | | Services & Goods | 110.80 | 83 | -2.77% | -2.77% |
| BBAI | BigBear.ai | | Technology | 1.75 | 83 | -2.78% | -2.78% |
| ALHC | Alignment Healthcare | | Health Care | 5.08 | 32 | -2.78% | -2.78% |
| MKTW | MarketWise | | Technology | 1.56 | 10 | -2.80% | -2.80% |


| Too many stocks? View smallcap stocks filtered by marketcap & sector |
| Marketcap: All SmallCap Stocks (default-no microcap), Large, Mid-Range, Small |
| Smallcap Sector: Tech, Finance, Energy, Staples, Retail, Industrial, Materials, & Medical |
|
Get the most comprehensive stock market coverage daily at 12Stocks.com ➞ Best Stocks Today ➞ Best Stocks Weekly ➞ Best Stocks Year-to-Date ➞ Best Stocks Trends ➞  Best Stocks Today 12Stocks.com Best Nasdaq Stocks ➞ Best S&P 500 Stocks ➞ Best Tech Stocks ➞ Best Biotech Stocks ➞ |
| Detailed Overview of SmallCap Stocks |
| SmallCap Technical Overview, Leaders & Laggards, Top SmallCap ETF Funds & Detailed SmallCap Stocks List, Charts, Trends & More |
| Smallcap: Technical Analysis, Trends & YTD Performance | |
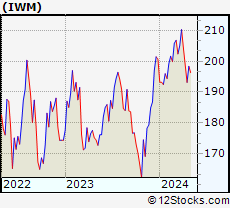
| SmallCap segment as represented by
IWM, an exchange-traded fund [ETF], holds basket of thousands of smallcap stocks from across all major sectors of the US stock market. The smallcap index (contains stocks like Riverbed & Sotheby's) is down by -0.37% and is currently underperforming the overall market by -6.93% year-to-date. Below is a quick view of technical charts and trends: | |
 IWM Weekly Chart |
|
| Long Term Trend: Very Good | |
| Medium Term Trend: Good | |
 IWM Daily Chart |
|
| Short Term Trend: Very Good | |
| Overall Trend Score: 88 | |
| YTD Performance: -0.37% | |
| **Trend Scores & Views Are Only For Educational Purposes And Not For Investing | |
| 12Stocks.com: Top Performing Small Cap Index Stocks | ||||||||||||||||||||||||||||||||||||||||||||||||
 The top performing Small Cap Index stocks year to date are
Now, more recently, over last week, the top performing Small Cap Index stocks on the move are


|
||||||||||||||||||||||||||||||||||||||||||||||||
| 12Stocks.com: Investing in Smallcap Index using Exchange Traded Funds | |
|
The following table shows list of key exchange traded funds (ETF) that
help investors track Smallcap index. The following list also includes leveraged ETF funds that track twice or thrice the daily returns of Smallcap indices. Short or inverse ETF funds move in the opposite direction to the index they track and are useful during market pullbacks or during bear markets. Quick View: Move mouse or cursor over ETF symbol (ticker) to view short-term technical chart and over ETF name to view long term chart. Click on ticker or stock name for detailed view. Click on to add stock symbol to your watchlist and to view watchlist. |
12Stocks.com List of ETFs that track Smallcap Index
| Ticker | ETF Name | Watchlist | Recent Price | Smart Investing & Trading Score | Change % | Week % | Year-to-date % |
| IWM | iShares Russell 2000 | | 199.96 | 88 | 0.79 | 0.79 | -0.37% |
| IJR | iShares Core S&P Small-Cap | | 106.41 | 93 | 0.72 | 0.72 | -1.7% |
| VTWO | Vanguard Russell 2000 ETF | | 80.78 | 88 | 0.70 | 0.7 | -0.39% |
| IWN | iShares Russell 2000 Value | | 152.05 | 93 | 0.60 | 0.6 | -2.11% |
| IWO | iShares Russell 2000 Growth | | 255.74 | 88 | 1.05 | 1.05 | 1.4% |
| IJS | iShares S&P Small-Cap 600 Value | | 97.95 | 75 | 0.78 | 0.78 | -4.97% |
| IJT | iShares S&P Small-Cap 600 Growth | | 126.96 | 95 | 0.69 | 0.69 | 1.45% |
| XSLV | PowerShares S&P SmallCap Low Volatil ETF | | 42.87 | 80 | 0.35 | 0.35 | -2.9% |
| SMLV | SPDR SSGA US Small Cap Low Volatil ETF | | 107.77 | 68 | 0.23 | 0.23 | -4.22% |
| SAA | ProShares Ultra SmallCap600 | | 23.27 | 95 | 1.00 | 1 | -6.73% |
| SBB | ProShares Short SmallCap600 | | 16.28 | 8 | -0.64 | -0.64 | 2.2% |
| SDD | ProShares UltraShort SmallCap600 | | 19.09 | 10 | -1.34 | -1.34 | 3.6% |
| 12Stocks.com: Charts, Trends, Fundamental Data and Performances of SmallCap Stocks | |
|
We now take in-depth look at all SmallCap stocks including charts, multi-period performances and overall trends (as measured by Smart Investing & Trading Score). One can sort SmallCap stocks (click link to choose) by Daily, Weekly and by Year-to-Date performances. Also, one can sort by size of the company or by market capitalization. |
| Select Your Default Chart Type: | |||||
| |||||
| Click on stock symbol or name for detailed view. Click on to add stock symbol to your watchlist and to view watchlist. Quick View: Move mouse or cursor over "Daily" to quickly view daily technical stock chart and over "Weekly" to view weekly technical stock chart. | |||||

 | DJCO Daily Journal Corporation |
| Sector: Services & Goods | |
| SubSector: Publishing - Newspapers | |
| MarketCap: 306.822 Millions | |
| Recent Price: 338.30 Smart Investing & Trading Score: 39 | |
| Day Percent Change: -2.45% Day Change: -8.50 | |
| Week Change: -2.45% Year-to-date Change: -0.7% | |
| DJCO Links: Profile News Message Board | |
| Charts:- Daily , Weekly | |
| Add DJCO to Watchlist: View: Get Complete DJCO Trend Analysis ➞ | |
 | WSBF Waterstone Financial, Inc. |
| Sector: Financials | |
| SubSector: Savings & Loans | |
| MarketCap: 371.93 Millions | |
| Recent Price: 11.50 Smart Investing & Trading Score: 42 | |
| Day Percent Change: -2.46% Day Change: -0.29 | |
| Week Change: -2.46% Year-to-date Change: -19.0% | |
| WSBF Links: Profile News Message Board | |
| Charts:- Daily , Weekly | |
| Add WSBF to Watchlist: View: Get Complete WSBF Trend Analysis ➞ | |
 | OCFC OceanFirst Financial Corp. |
| Sector: Financials | |
| SubSector: Savings & Loans | |
| MarketCap: 867.43 Millions | |
| Recent Price: 14.99 Smart Investing & Trading Score: 32 | |
| Day Percent Change: -2.47% Day Change: -0.38 | |
| Week Change: -2.47% Year-to-date Change: -13.7% | |
| OCFC Links: Profile News Message Board | |
| Charts:- Daily , Weekly | |
| Add OCFC to Watchlist: View: Get Complete OCFC Trend Analysis ➞ | |
 | LOCO El Pollo Loco Holdings, Inc. |
| Sector: Services & Goods | |
| SubSector: Restaurants | |
| MarketCap: 296.97 Millions | |
| Recent Price: 8.69 Smart Investing & Trading Score: 49 | |
| Day Percent Change: -2.47% Day Change: -0.22 | |
| Week Change: -2.47% Year-to-date Change: -1.5% | |
| LOCO Links: Profile News Message Board | |
| Charts:- Daily , Weekly | |
| Add LOCO to Watchlist: View: Get Complete LOCO Trend Analysis ➞ | |
 | NRIM Northrim BanCorp, Inc. |
| Sector: Financials | |
| SubSector: Regional - Pacific Banks | |
| MarketCap: 147.629 Millions | |
| Recent Price: 47.80 Smart Investing & Trading Score: 52 | |
| Day Percent Change: -2.49% Day Change: -1.22 | |
| Week Change: -2.49% Year-to-date Change: -16.5% | |
| NRIM Links: Profile News Message Board | |
| Charts:- Daily , Weekly | |
| Add NRIM to Watchlist: View: Get Complete NRIM Trend Analysis ➞ | |
 | DMRC Digimarc Corporation |
| Sector: Technology | |
| SubSector: Information Technology Services | |
| MarketCap: 222.268 Millions | |
| Recent Price: 21.82 Smart Investing & Trading Score: 22 | |
| Day Percent Change: -2.50% Day Change: -0.56 | |
| Week Change: -2.5% Year-to-date Change: -39.6% | |
| DMRC Links: Profile News Message Board | |
| Charts:- Daily , Weekly | |
| Add DMRC to Watchlist: View: Get Complete DMRC Trend Analysis ➞ | |
 | LZ LegalZoom.com, Inc. |
| Sector: Industrials | |
| SubSector: Specialty Business Services | |
| MarketCap: 2330 Millions | |
| Recent Price: 12.17 Smart Investing & Trading Score: 56 | |
| Day Percent Change: -2.52% Day Change: -0.31 | |
| Week Change: -2.52% Year-to-date Change: 7.2% | |
| LZ Links: Profile News Message Board | |
| Charts:- Daily , Weekly | |
| Add LZ to Watchlist: View: Get Complete LZ Trend Analysis ➞ | |
 | TOWN TowneBank |
| Sector: Financials | |
| SubSector: Regional - Mid-Atlantic Banks | |
| MarketCap: 1344.09 Millions | |
| Recent Price: 26.24 Smart Investing & Trading Score: 8 | |
| Day Percent Change: -2.53% Day Change: -0.68 | |
| Week Change: -2.53% Year-to-date Change: -11.8% | |
| TOWN Links: Profile News Message Board | |
| Charts:- Daily , Weekly | |
| Add TOWN to Watchlist: View: Get Complete TOWN Trend Analysis ➞ | |
 | ACDC ProFrac Holding Corp. |
| Sector: Energy | |
| SubSector: Oil & Gas Equipment & Services | |
| MarketCap: 1830 Millions | |
| Recent Price: 8.01 Smart Investing & Trading Score: 43 | |
| Day Percent Change: -2.55% Day Change: -0.21 | |
| Week Change: -2.55% Year-to-date Change: -5.9% | |
| ACDC Links: Profile News Message Board | |
| Charts:- Daily , Weekly | |
| Add ACDC to Watchlist: View: Get Complete ACDC Trend Analysis ➞ | |
 | TSBK Timberland Bancorp, Inc. |
| Sector: Financials | |
| SubSector: Savings & Loans | |
| MarketCap: 155.03 Millions | |
| Recent Price: 24.60 Smart Investing & Trading Score: 10 | |
| Day Percent Change: -2.57% Day Change: -0.65 | |
| Week Change: -2.57% Year-to-date Change: -21.8% | |
| TSBK Links: Profile News Message Board | |
| Charts:- Daily , Weekly | |
| Add TSBK to Watchlist: View: Get Complete TSBK Trend Analysis ➞ | |
 | EGRX Eagle Pharmaceuticals, Inc. |
| Sector: Health Care | |
| SubSector: Drugs - Generic | |
| MarketCap: 573.385 Millions | |
| Recent Price: 4.05 Smart Investing & Trading Score: 10 | |
| Day Percent Change: -2.64% Day Change: -0.11 | |
| Week Change: -2.64% Year-to-date Change: -22.6% | |
| EGRX Links: Profile News Message Board | |
| Charts:- Daily , Weekly | |
| Add EGRX to Watchlist: View: Get Complete EGRX Trend Analysis ➞ | |
 | SASR Sandy Spring Bancorp, Inc. |
| Sector: Financials | |
| SubSector: Regional - Mid-Atlantic Banks | |
| MarketCap: 764.659 Millions | |
| Recent Price: 20.92 Smart Investing & Trading Score: 42 | |
| Day Percent Change: -2.65% Day Change: -0.57 | |
| Week Change: -2.65% Year-to-date Change: -23.2% | |
| SASR Links: Profile News Message Board | |
| Charts:- Daily , Weekly | |
| Add SASR to Watchlist: View: Get Complete SASR Trend Analysis ➞ | |
 | FEAM 5E Advanced Materials Inc. |
| Sector: Materials | |
| SubSector: Specialty Chemicals | |
| MarketCap: 247 Millions | |
| Recent Price: 1.10 Smart Investing & Trading Score: 17 | |
| Day Percent Change: -2.65% Day Change: -0.03 | |
| Week Change: -2.65% Year-to-date Change: -22.0% | |
| FEAM Links: Profile News Message Board | |
| Charts:- Daily , Weekly | |
| Add FEAM to Watchlist: View: Get Complete FEAM Trend Analysis ➞ | |
 | VTYX Ventyx Biosciences, Inc. |
| Sector: Health Care | |
| SubSector: Biotechnology | |
| MarketCap: 1950 Millions | |
| Recent Price: 3.84 Smart Investing & Trading Score: 36 | |
| Day Percent Change: -2.66% Day Change: -0.10 | |
| Week Change: -2.66% Year-to-date Change: 55.0% | |
| VTYX Links: Profile News Message Board | |
| Charts:- Daily , Weekly | |
| Add VTYX to Watchlist: View: Get Complete VTYX Trend Analysis ➞ | |
 | IBTX Independent Bank Group, Inc. |
| Sector: Financials | |
| SubSector: Regional - Southeast Banks | |
| MarketCap: 1133.35 Millions | |
| Recent Price: 38.29 Smart Investing & Trading Score: 0 | |
| Day Percent Change: -2.67% Day Change: -1.05 | |
| Week Change: -2.67% Year-to-date Change: -24.7% | |
| IBTX Links: Profile News Message Board | |
| Charts:- Daily , Weekly | |
| Add IBTX to Watchlist: View: Get Complete IBTX Trend Analysis ➞ | |
 | STRA Strategic Education, Inc. |
| Sector: Services & Goods | |
| SubSector: Education & Training Services | |
| MarketCap: 2621.56 Millions | |
| Recent Price: 117.82 Smart Investing & Trading Score: 100 | |
| Day Percent Change: -2.68% Day Change: -3.24 | |
| Week Change: -2.68% Year-to-date Change: 27.6% | |
| STRA Links: Profile News Message Board | |
| Charts:- Daily , Weekly | |
| Add STRA to Watchlist: View: Get Complete STRA Trend Analysis ➞ | |
 | FRBA First Bank |
| Sector: Financials | |
| SubSector: Regional - Mid-Atlantic Banks | |
| MarketCap: 124.859 Millions | |
| Recent Price: 11.81 Smart Investing & Trading Score: 0 | |
| Day Percent Change: -2.72% Day Change: -0.33 | |
| Week Change: -2.72% Year-to-date Change: -19.7% | |
| FRBA Links: Profile News Message Board | |
| Charts:- Daily , Weekly | |
| Add FRBA to Watchlist: View: Get Complete FRBA Trend Analysis ➞ | |
 | RAPT RAPT Therapeutics, Inc. |
| Sector: Health Care | |
| SubSector: Biotechnology | |
| MarketCap: 368.785 Millions | |
| Recent Price: 7.88 Smart Investing & Trading Score: 32 | |
| Day Percent Change: -2.72% Day Change: -0.22 | |
| Week Change: -2.72% Year-to-date Change: -68.3% | |
| RAPT Links: Profile News Message Board | |
| Charts:- Daily , Weekly | |
| Add RAPT to Watchlist: View: Get Complete RAPT Trend Analysis ➞ | |
 | VLY Valley National Bancorp |
| Sector: Financials | |
| SubSector: Regional - Northeast Banks | |
| MarketCap: 2843.09 Millions | |
| Recent Price: 7.12 Smart Investing & Trading Score: 10 | |
| Day Percent Change: -2.73% Day Change: -0.20 | |
| Week Change: -2.73% Year-to-date Change: -34.4% | |
| VLY Links: Profile News Message Board | |
| Charts:- Daily , Weekly | |
| Add VLY to Watchlist: View: Get Complete VLY Trend Analysis ➞ | |
 | RIGL Rigel Pharmaceuticals, Inc. |
| Sector: Health Care | |
| SubSector: Biotechnology | |
| MarketCap: 256.585 Millions | |
| Recent Price: 1.07 Smart Investing & Trading Score: 10 | |
| Day Percent Change: -2.73% Day Change: -0.03 | |
| Week Change: -2.73% Year-to-date Change: -26.2% | |
| RIGL Links: Profile News Message Board | |
| Charts:- Daily , Weekly | |
| Add RIGL to Watchlist: View: Get Complete RIGL Trend Analysis ➞ | |
 | AX Axos Financial, Inc. |
| Sector: Financials | |
| SubSector: Savings & Loans | |
| MarketCap: 1037.3 Millions | |
| Recent Price: 51.59 Smart Investing & Trading Score: 37 | |
| Day Percent Change: -2.75% Day Change: -1.46 | |
| Week Change: -2.75% Year-to-date Change: -5.5% | |
| AX Links: Profile News Message Board | |
| Charts:- Daily , Weekly | |
| Add AX to Watchlist: View: Get Complete AX Trend Analysis ➞ | |
 | KRUS Kura Sushi USA, Inc. |
| Sector: Services & Goods | |
| SubSector: Restaurants | |
| MarketCap: 74.057 Millions | |
| Recent Price: 110.80 Smart Investing & Trading Score: 83 | |
| Day Percent Change: -2.77% Day Change: -3.16 | |
| Week Change: -2.77% Year-to-date Change: 45.6% | |
| KRUS Links: Profile News Message Board | |
| Charts:- Daily , Weekly | |
| Add KRUS to Watchlist: View: Get Complete KRUS Trend Analysis ➞ | |
 | BBAI BigBear.ai Holdings, Inc. |
| Sector: Technology | |
| SubSector: Information Technology Services | |
| MarketCap: 339 Millions | |
| Recent Price: 1.75 Smart Investing & Trading Score: 83 | |
| Day Percent Change: -2.78% Day Change: -0.05 | |
| Week Change: -2.78% Year-to-date Change: -17.8% | |
| BBAI Links: Profile News Message Board | |
| Charts:- Daily , Weekly | |
| Add BBAI to Watchlist: View: Get Complete BBAI Trend Analysis ➞ | |
 | ALHC Alignment Healthcare, Inc. |
| Sector: Health Care | |
| SubSector: Healthcare Plans | |
| MarketCap: 1100 Millions | |
| Recent Price: 5.08 Smart Investing & Trading Score: 32 | |
| Day Percent Change: -2.78% Day Change: -0.14 | |
| Week Change: -2.78% Year-to-date Change: -42.6% | |
| ALHC Links: Profile News Message Board | |
| Charts:- Daily , Weekly | |
| Add ALHC to Watchlist: View: Get Complete ALHC Trend Analysis ➞ | |
 | MKTW MarketWise, Inc. |
| Sector: Technology | |
| SubSector: Software - Application | |
| MarketCap: 646 Millions | |
| Recent Price: 1.56 Smart Investing & Trading Score: 10 | |
| Day Percent Change: -2.80% Day Change: -0.04 | |
| Week Change: -2.8% Year-to-date Change: -42.2% | |
| MKTW Links: Profile News Message Board | |
| Charts:- Daily , Weekly | |
| Add MKTW to Watchlist: View: Get Complete MKTW Trend Analysis ➞ | |
| Too many stocks? View smallcap stocks filtered by marketcap & sector |
| Marketcap: All SmallCap Stocks (default-no microcap), Large, Mid-Range, Small & MicroCap |
| Sector: Tech, Finance, Energy, Staples, Retail, Industrial, Materials, Utilities & Medical |
|
Best Stocks Today 12Stocks.com |
© 2024 12Stocks.com Terms & Conditions Privacy Contact Us
All Information Provided Only For Education And Not To Be Used For Investing or Trading. See Terms & Conditions


One More Thing ... Get Best Stocks Delivered Daily!
Never Ever Miss A Move With Our Top Ten Stocks Lists
Find Best Stocks In Any Market - Bull or Bear Market
Take A Peek At Our Top Ten Stocks Lists: Daily, Weekly, Year-to-Date & Top Trends
Find Best Stocks In Any Market - Bull or Bear Market
Take A Peek At Our Top Ten Stocks Lists: Daily, Weekly, Year-to-Date & Top Trends
Smallcap Stocks With Best Up Trends [0-bearish to 100-bullish]: Bakkt [100], Deciphera [100], Phibro Animal[100], Heartland Financial[100], PTC [100], Day One[100], Richardson Electronics[100], Fulton Financial[100], Cullinan Oncology[100], Lands [100], TransMedics Group[100]
Best Smallcap Stocks Year-to-Date:
CareMax [580.41%], Janux [421.92%], Bakkt [346.64%], Viking [305.75%], Longboard [247.46%], Alpine Immune[239.81%], Super Micro[213.22%], Avidity Biosciences[173.23%], Arcutis Bio[171.83%], Vera [167.31%], Cullinan Oncology[166.01%] Best Smallcap Stocks This Week:
Deciphera [72.56%], Phibro Animal[31.81%], Vaxxinity [31.65%], Zevia PBC[20.94%], Velo3D [19.97%], Acrivon [18.2%], Janux [18.18%], MultiPlan [15.53%], Heartland Financial[15.15%], Codexis [14.66%], Eyenovia [13.37%] Best Smallcap Stocks Daily:
Bakkt [2391.87%], Deciphera [72.56%], Phibro Animal[31.81%], Vaxxinity [31.65%], Zevia PBC[20.94%], Velo3D [19.97%], Acrivon [18.20%], Janux [18.18%], MultiPlan [15.53%], Heartland Financial[15.15%], Codexis [14.66%]