
 Login Sign Up


| |||||
 |  | ||||

| 12Stocks.com Market Intelligence |
Best SmallCap Stocks
|
| In a hurry? Small Cap Stock Lists: Performance Trends Table, Stock Charts
Sort Small Cap stocks: Daily, Weekly, Year-to-Date, Market Cap & Trends. Filter Small Cap stocks list by sector: Show all, Tech, Finance, Energy, Staples, Retail, Industrial, Materials, Utilities and HealthCare Filter Small Cap stocks list by size: All Large Medium Small and MicroCap |
| 12Stocks.com Small Cap Stocks Performances & Trends Daily | |||||||||
|
|  The overall Smart Investing & Trading Score is 88 (0-bearish to 100-bullish) which puts Small Cap index in short term bullish trend. The Smart Investing & Trading Score from previous trading session is 56 and hence an improvement of trend.
| ||||||||
Here are the Smart Investing & Trading Scores of the most requested small cap stocks at 12Stocks.com (click stock name for detailed review):
|


| 12Stocks.com: Investing in Smallcap Index with Stocks | |
|
The following table helps investors and traders sort through current performance and trends (as measured by Smart Investing & Trading Score) of various
stocks in the Smallcap Index. Quick View: Move mouse or cursor over stock symbol (ticker) to view short-term technical chart and over stock name to view long term chart. Click on  to add stock symbol to your watchlist and to add stock symbol to your watchlist and  to view watchlist. Click on any ticker or stock name for detailed market intelligence report for that stock. to view watchlist. Click on any ticker or stock name for detailed market intelligence report for that stock. |
12Stocks.com Performance of Stocks in Smallcap Index
| Ticker | Stock Name | Watchlist | Category | Recent Price | Smart Investing & Trading Score | Change % | Weekly Change% |
| INST | Instructure |   | Technology | 19.49 | 34 | -0.81% | -0.81% |
| VMEO | Vimeo | | Technology | 3.66 | 32 | -0.81% | -0.81% |
| SLVM | Sylvamo | | Materials | 62.55 | 60 | -0.81% | -0.81% |
| LADR | Ladder Capital | | Financials | 10.91 | 100 | -0.82% | -0.82% |
| NHC | National HealthCare | | Health Care | 90.52 | 50 | -0.83% | -0.83% |
| BCC | Boise Cascade | | Industrials | 138.26 | 65 | -0.83% | -0.83% |
| LTH | Life Time | | Services & Goods | 14.03 | 36 | -0.85% | -0.85% |
| CHMG | Chemung Financial | | Financials | 42.69 | 32 | -0.86% | -0.86% |
| RGNX | REGENXBIO | | Health Care | 16.05 | 65 | -0.86% | -0.86% |
| PEBO | Peoples Bancorp | | Financials | 29.50 | 68 | -0.87% | -0.87% |
| GRC | Gorman-Rupp | | Industrials | 33.09 | 17 | -0.87% | -0.87% |
| TRDA | Entrada | | Health Care | 12.34 | 10 | -0.88% | -0.88% |
| RELY | Remitly Global | | Technology | 17.90 | 71 | -0.89% | -0.89% |
| EVBG | Everbridge | | Technology | 34.57 | 61 | -0.89% | -0.89% |
| BL | BlackLine | | Technology | 60.28 | 75 | -0.90% | -0.90% |
| GRTS | Gritstone Oncology | | Health Care | 0.81 | 42 | -0.90% | -0.90% |
| FRME | First Merchants | | Financials | 33.82 | 73 | -0.91% | -0.91% |
| COMP | Compass | | Technology | 3.27 | 22 | -0.91% | -0.91% |
| OSCR | Oscar Health | | Health Care | 17.40 | 69 | -0.91% | -0.91% |
| NYMT | New York | | Financials | 6.97 | 32 | -0.92% | -0.92% |
| SKT | Tanger Factory | | Financials | 28.61 | 71 | -0.93% | -0.93% |
| RUSHA | Rush Enterprises | | Services & Goods | 46.32 | 61 | -0.94% | -0.94% |
| SHBI | Shore Bancshares | | Financials | 10.43 | 47 | -0.95% | -0.95% |
| ZIMV | ZimVie | | Health Care | 15.67 | 54 | -0.95% | -0.95% |
| CRAI | CRA | | Services & Goods | 148.28 | 90 | -0.96% | -0.96% |


| Too many stocks? View smallcap stocks filtered by marketcap & sector |
| Marketcap: All SmallCap Stocks (default-no microcap), Large, Mid-Range, Small |
| Smallcap Sector: Tech, Finance, Energy, Staples, Retail, Industrial, Materials, & Medical |
|
Get the most comprehensive stock market coverage daily at 12Stocks.com ➞ Best Stocks Today ➞ Best Stocks Weekly ➞ Best Stocks Year-to-Date ➞ Best Stocks Trends ➞  Best Stocks Today 12Stocks.com Best Nasdaq Stocks ➞ Best S&P 500 Stocks ➞ Best Tech Stocks ➞ Best Biotech Stocks ➞ |
| Detailed Overview of SmallCap Stocks |
| SmallCap Technical Overview, Leaders & Laggards, Top SmallCap ETF Funds & Detailed SmallCap Stocks List, Charts, Trends & More |
| Smallcap: Technical Analysis, Trends & YTD Performance | |
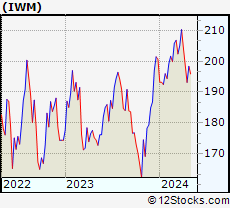
| SmallCap segment as represented by
IWM, an exchange-traded fund [ETF], holds basket of thousands of smallcap stocks from across all major sectors of the US stock market. The smallcap index (contains stocks like Riverbed & Sotheby's) is down by -0.37% and is currently underperforming the overall market by -6.93% year-to-date. Below is a quick view of technical charts and trends: | |
 IWM Weekly Chart |
|
| Long Term Trend: Very Good | |
| Medium Term Trend: Good | |
 IWM Daily Chart |
|
| Short Term Trend: Very Good | |
| Overall Trend Score: 88 | |
| YTD Performance: -0.37% | |
| **Trend Scores & Views Are Only For Educational Purposes And Not For Investing | |
| 12Stocks.com: Top Performing Small Cap Index Stocks | ||||||||||||||||||||||||||||||||||||||||||||||||
 The top performing Small Cap Index stocks year to date are
Now, more recently, over last week, the top performing Small Cap Index stocks on the move are


|
||||||||||||||||||||||||||||||||||||||||||||||||
| 12Stocks.com: Investing in Smallcap Index using Exchange Traded Funds | |
|
The following table shows list of key exchange traded funds (ETF) that
help investors track Smallcap index. The following list also includes leveraged ETF funds that track twice or thrice the daily returns of Smallcap indices. Short or inverse ETF funds move in the opposite direction to the index they track and are useful during market pullbacks or during bear markets. Quick View: Move mouse or cursor over ETF symbol (ticker) to view short-term technical chart and over ETF name to view long term chart. Click on ticker or stock name for detailed view. Click on to add stock symbol to your watchlist and to view watchlist. |
12Stocks.com List of ETFs that track Smallcap Index
| Ticker | ETF Name | Watchlist | Recent Price | Smart Investing & Trading Score | Change % | Week % | Year-to-date % |
| IWM | iShares Russell 2000 | | 199.96 | 88 | 0.79 | 0.79 | -0.37% |
| IJR | iShares Core S&P Small-Cap | | 106.41 | 93 | 0.72 | 0.72 | -1.7% |
| VTWO | Vanguard Russell 2000 ETF | | 80.78 | 88 | 0.70 | 0.7 | -0.39% |
| IWN | iShares Russell 2000 Value | | 152.05 | 93 | 0.60 | 0.6 | -2.11% |
| IWO | iShares Russell 2000 Growth | | 255.74 | 78 | 1.05 | 1.05 | 1.4% |
| IJS | iShares S&P Small-Cap 600 Value | | 97.95 | 70 | 0.78 | 0.78 | -4.97% |
| IJT | iShares S&P Small-Cap 600 Growth | | 126.96 | 88 | 0.69 | 0.69 | 1.45% |
| XSLV | PowerShares S&P SmallCap Low Volatil ETF | | 42.87 | 80 | 0.35 | 0.35 | -2.9% |
| SMLV | SPDR SSGA US Small Cap Low Volatil ETF | | 107.77 | 68 | 0.23 | 0.23 | -4.22% |
| SAA | ProShares Ultra SmallCap600 | | 23.27 | 88 | 1.00 | 1 | -6.73% |
| SBB | ProShares Short SmallCap600 | | 16.28 | 8 | -0.64 | -0.64 | 2.2% |
| SDD | ProShares UltraShort SmallCap600 | | 19.09 | 15 | -1.34 | -1.34 | 3.6% |
| 12Stocks.com: Charts, Trends, Fundamental Data and Performances of SmallCap Stocks | |
|
We now take in-depth look at all SmallCap stocks including charts, multi-period performances and overall trends (as measured by Smart Investing & Trading Score). One can sort SmallCap stocks (click link to choose) by Daily, Weekly and by Year-to-Date performances. Also, one can sort by size of the company or by market capitalization. |
| Select Your Default Chart Type: | |||||
| |||||
| Click on stock symbol or name for detailed view. Click on to add stock symbol to your watchlist and to view watchlist. Quick View: Move mouse or cursor over "Daily" to quickly view daily technical stock chart and over "Weekly" to view weekly technical stock chart. | |||||

 | INST Instructure Holdings, Inc. |
| Sector: Technology | |
| SubSector: Software - Application | |
| MarketCap: 3580 Millions | |
| Recent Price: 19.49 Smart Investing & Trading Score: 34 | |
| Day Percent Change: -0.81% Day Change: -0.16 | |
| Week Change: -0.81% Year-to-date Change: -27.8% | |
| INST Links: Profile News Message Board | |
| Charts:- Daily , Weekly | |
| Add INST to Watchlist: View: Get Complete INST Trend Analysis ➞ | |
 | VMEO Vimeo, Inc. |
| Sector: Technology | |
| SubSector: Software - Application | |
| MarketCap: 678 Millions | |
| Recent Price: 3.66 Smart Investing & Trading Score: 32 | |
| Day Percent Change: -0.81% Day Change: -0.03 | |
| Week Change: -0.81% Year-to-date Change: -6.8% | |
| VMEO Links: Profile News Message Board | |
| Charts:- Daily , Weekly | |
| Add VMEO to Watchlist: View: Get Complete VMEO Trend Analysis ➞ | |
 | SLVM Sylvamo Corporation |
| Sector: Materials | |
| SubSector: Paper & Paper Products | |
| MarketCap: 1710 Millions | |
| Recent Price: 62.55 Smart Investing & Trading Score: 60 | |
| Day Percent Change: -0.81% Day Change: -0.51 | |
| Week Change: -0.81% Year-to-date Change: 27.4% | |
| SLVM Links: Profile News Message Board | |
| Charts:- Daily , Weekly | |
| Add SLVM to Watchlist: View: Get Complete SLVM Trend Analysis ➞ | |
 | LADR Ladder Capital Corp |
| Sector: Financials | |
| SubSector: Mortgage Investment | |
| MarketCap: 660.039 Millions | |
| Recent Price: 10.91 Smart Investing & Trading Score: 100 | |
| Day Percent Change: -0.82% Day Change: -0.09 | |
| Week Change: -0.82% Year-to-date Change: -5.2% | |
| LADR Links: Profile News Message Board | |
| Charts:- Daily , Weekly | |
| Add LADR to Watchlist: View: Get Complete LADR Trend Analysis ➞ | |
 | NHC National HealthCare Corporation |
| Sector: Health Care | |
| SubSector: Long-Term Care Facilities | |
| MarketCap: 1164.86 Millions | |
| Recent Price: 90.52 Smart Investing & Trading Score: 50 | |
| Day Percent Change: -0.83% Day Change: -0.76 | |
| Week Change: -0.83% Year-to-date Change: -2.1% | |
| NHC Links: Profile News Message Board | |
| Charts:- Daily , Weekly | |
| Add NHC to Watchlist: View: Get Complete NHC Trend Analysis ➞ | |
 | BCC Boise Cascade Company |
| Sector: Industrials | |
| SubSector: Lumber, Wood Production | |
| MarketCap: 963.938 Millions | |
| Recent Price: 138.26 Smart Investing & Trading Score: 65 | |
| Day Percent Change: -0.83% Day Change: -1.16 | |
| Week Change: -0.83% Year-to-date Change: 6.9% | |
| BCC Links: Profile News Message Board | |
| Charts:- Daily , Weekly | |
| Add BCC to Watchlist: View: Get Complete BCC Trend Analysis ➞ | |
 | LTH Life Time Group Holdings, Inc. |
| Sector: Services & Goods | |
| SubSector: Leisure | |
| MarketCap: 3740 Millions | |
| Recent Price: 14.03 Smart Investing & Trading Score: 36 | |
| Day Percent Change: -0.85% Day Change: -0.12 | |
| Week Change: -0.85% Year-to-date Change: -7.4% | |
| LTH Links: Profile News Message Board | |
| Charts:- Daily , Weekly | |
| Add LTH to Watchlist: View: Get Complete LTH Trend Analysis ➞ | |
 | CHMG Chemung Financial Corporation |
| Sector: Financials | |
| SubSector: Regional - Pacific Banks | |
| MarketCap: 142.229 Millions | |
| Recent Price: 42.69 Smart Investing & Trading Score: 32 | |
| Day Percent Change: -0.86% Day Change: -0.37 | |
| Week Change: -0.86% Year-to-date Change: -14.3% | |
| CHMG Links: Profile News Message Board | |
| Charts:- Daily , Weekly | |
| Add CHMG to Watchlist: View: Get Complete CHMG Trend Analysis ➞ | |
 | RGNX REGENXBIO Inc. |
| Sector: Health Care | |
| SubSector: Biotechnology | |
| MarketCap: 1232.85 Millions | |
| Recent Price: 16.05 Smart Investing & Trading Score: 65 | |
| Day Percent Change: -0.86% Day Change: -0.14 | |
| Week Change: -0.86% Year-to-date Change: -10.6% | |
| RGNX Links: Profile News Message Board | |
| Charts:- Daily , Weekly | |
| Add RGNX to Watchlist: View: Get Complete RGNX Trend Analysis ➞ | |
 | PEBO Peoples Bancorp Inc. |
| Sector: Financials | |
| SubSector: Regional - Midwest Banks | |
| MarketCap: 449.77 Millions | |
| Recent Price: 29.50 Smart Investing & Trading Score: 68 | |
| Day Percent Change: -0.87% Day Change: -0.26 | |
| Week Change: -0.87% Year-to-date Change: -12.6% | |
| PEBO Links: Profile News Message Board | |
| Charts:- Daily , Weekly | |
| Add PEBO to Watchlist: View: Get Complete PEBO Trend Analysis ➞ | |
 | GRC The Gorman-Rupp Company |
| Sector: Industrials | |
| SubSector: Diversified Machinery | |
| MarketCap: 729.616 Millions | |
| Recent Price: 33.09 Smart Investing & Trading Score: 17 | |
| Day Percent Change: -0.87% Day Change: -0.29 | |
| Week Change: -0.87% Year-to-date Change: -6.9% | |
| GRC Links: Profile News Message Board | |
| Charts:- Daily , Weekly | |
| Add GRC to Watchlist: View: Get Complete GRC Trend Analysis ➞ | |
 | TRDA Entrada Therapeutics, Inc. |
| Sector: Health Care | |
| SubSector: Biotechnology | |
| MarketCap: 481 Millions | |
| Recent Price: 12.34 Smart Investing & Trading Score: 10 | |
| Day Percent Change: -0.88% Day Change: -0.11 | |
| Week Change: -0.88% Year-to-date Change: -24.8% | |
| TRDA Links: Profile News Message Board | |
| Charts:- Daily , Weekly | |
| Add TRDA to Watchlist: View: Get Complete TRDA Trend Analysis ➞ | |
 | RELY Remitly Global, Inc. |
| Sector: Technology | |
| SubSector: Software - Infrastructure | |
| MarketCap: 3320 Millions | |
| Recent Price: 17.90 Smart Investing & Trading Score: 71 | |
| Day Percent Change: -0.89% Day Change: -0.16 | |
| Week Change: -0.89% Year-to-date Change: -7.8% | |
| RELY Links: Profile News Message Board | |
| Charts:- Daily , Weekly | |
| Add RELY to Watchlist: View: Get Complete RELY Trend Analysis ➞ | |
 | EVBG Everbridge, Inc. |
| Sector: Technology | |
| SubSector: Application Software | |
| MarketCap: 3697.92 Millions | |
| Recent Price: 34.57 Smart Investing & Trading Score: 61 | |
| Day Percent Change: -0.89% Day Change: -0.31 | |
| Week Change: -0.89% Year-to-date Change: 42.2% | |
| EVBG Links: Profile News Message Board | |
| Charts:- Daily , Weekly | |
| Add EVBG to Watchlist: View: Get Complete EVBG Trend Analysis ➞ | |
 | BL BlackLine, Inc. |
| Sector: Technology | |
| SubSector: Application Software | |
| MarketCap: 2972.62 Millions | |
| Recent Price: 60.28 Smart Investing & Trading Score: 75 | |
| Day Percent Change: -0.90% Day Change: -0.55 | |
| Week Change: -0.9% Year-to-date Change: -3.5% | |
| BL Links: Profile News Message Board | |
| Charts:- Daily , Weekly | |
| Add BL to Watchlist: View: Get Complete BL Trend Analysis ➞ | |
 | GRTS Gritstone Oncology, Inc. |
| Sector: Health Care | |
| SubSector: Biotechnology | |
| MarketCap: 240.085 Millions | |
| Recent Price: 0.81 Smart Investing & Trading Score: 42 | |
| Day Percent Change: -0.90% Day Change: -0.01 | |
| Week Change: -0.9% Year-to-date Change: -60.5% | |
| GRTS Links: Profile News Message Board | |
| Charts:- Daily , Weekly | |
| Add GRTS to Watchlist: View: Get Complete GRTS Trend Analysis ➞ | |
 | FRME First Merchants Corporation |
| Sector: Financials | |
| SubSector: Regional - Midwest Banks | |
| MarketCap: 1490.4 Millions | |
| Recent Price: 33.82 Smart Investing & Trading Score: 73 | |
| Day Percent Change: -0.91% Day Change: -0.31 | |
| Week Change: -0.91% Year-to-date Change: -8.8% | |
| FRME Links: Profile News Message Board | |
| Charts:- Daily , Weekly | |
| Add FRME to Watchlist: View: Get Complete FRME Trend Analysis ➞ | |
 | COMP Compass, Inc. |
| Sector: Technology | |
| SubSector: Software - Application | |
| MarketCap: 1580 Millions | |
| Recent Price: 3.27 Smart Investing & Trading Score: 22 | |
| Day Percent Change: -0.91% Day Change: -0.03 | |
| Week Change: -0.91% Year-to-date Change: -12.2% | |
| COMP Links: Profile News Message Board | |
| Charts:- Daily , Weekly | |
| Add COMP to Watchlist: View: Get Complete COMP Trend Analysis ➞ | |
 | OSCR Oscar Health, Inc. |
| Sector: Health Care | |
| SubSector: Healthcare Plans | |
| MarketCap: 1790 Millions | |
| Recent Price: 17.40 Smart Investing & Trading Score: 69 | |
| Day Percent Change: -0.91% Day Change: -0.16 | |
| Week Change: -0.91% Year-to-date Change: 91.1% | |
| OSCR Links: Profile News Message Board | |
| Charts:- Daily , Weekly | |
| Add OSCR to Watchlist: View: Get Complete OSCR Trend Analysis ➞ | |
 | NYMT New York Mortgage Trust, Inc. |
| Sector: Financials | |
| SubSector: Mortgage Investment | |
| MarketCap: 1038.39 Millions | |
| Recent Price: 6.97 Smart Investing & Trading Score: 32 | |
| Day Percent Change: -0.92% Day Change: -0.07 | |
| Week Change: -0.92% Year-to-date Change: -18.2% | |
| NYMT Links: Profile News Message Board | |
| Charts:- Daily , Weekly | |
| Add NYMT to Watchlist: View: Get Complete NYMT Trend Analysis ➞ | |
 | SKT Tanger Factory Outlet Centers, Inc. |
| Sector: Financials | |
| SubSector: REIT - Retail | |
| MarketCap: 720.214 Millions | |
| Recent Price: 28.61 Smart Investing & Trading Score: 71 | |
| Day Percent Change: -0.93% Day Change: -0.27 | |
| Week Change: -0.93% Year-to-date Change: 3.2% | |
| SKT Links: Profile News Message Board | |
| Charts:- Daily , Weekly | |
| Add SKT to Watchlist: View: Get Complete SKT Trend Analysis ➞ | |
 | RUSHA Rush Enterprises, Inc. |
| Sector: Services & Goods | |
| SubSector: Auto Dealerships | |
| MarketCap: 1183.21 Millions | |
| Recent Price: 46.32 Smart Investing & Trading Score: 61 | |
| Day Percent Change: -0.94% Day Change: -0.44 | |
| Week Change: -0.94% Year-to-date Change: -7.9% | |
| RUSHA Links: Profile News Message Board | |
| Charts:- Daily , Weekly | |
| Add RUSHA to Watchlist: View: Get Complete RUSHA Trend Analysis ➞ | |
 | SHBI Shore Bancshares, Inc. |
| Sector: Financials | |
| SubSector: Regional - Mid-Atlantic Banks | |
| MarketCap: 131.359 Millions | |
| Recent Price: 10.43 Smart Investing & Trading Score: 47 | |
| Day Percent Change: -0.95% Day Change: -0.10 | |
| Week Change: -0.95% Year-to-date Change: -26.8% | |
| SHBI Links: Profile News Message Board | |
| Charts:- Daily , Weekly | |
| Add SHBI to Watchlist: View: Get Complete SHBI Trend Analysis ➞ | |
 | ZIMV ZimVie Inc. |
| Sector: Health Care | |
| SubSector: Medical Devices | |
| MarketCap: 303 Millions | |
| Recent Price: 15.67 Smart Investing & Trading Score: 54 | |
| Day Percent Change: -0.95% Day Change: -0.15 | |
| Week Change: -0.95% Year-to-date Change: -11.6% | |
| ZIMV Links: Profile News Message Board | |
| Charts:- Daily , Weekly | |
| Add ZIMV to Watchlist: View: Get Complete ZIMV Trend Analysis ➞ | |
 | CRAI CRA International, Inc. |
| Sector: Services & Goods | |
| SubSector: Management Services | |
| MarketCap: 209.645 Millions | |
| Recent Price: 148.28 Smart Investing & Trading Score: 90 | |
| Day Percent Change: -0.96% Day Change: -1.43 | |
| Week Change: -0.96% Year-to-date Change: 50.0% | |
| CRAI Links: Profile News Message Board | |
| Charts:- Daily , Weekly | |
| Add CRAI to Watchlist: View: Get Complete CRAI Trend Analysis ➞ | |
| Too many stocks? View smallcap stocks filtered by marketcap & sector |
| Marketcap: All SmallCap Stocks (default-no microcap), Large, Mid-Range, Small & MicroCap |
| Sector: Tech, Finance, Energy, Staples, Retail, Industrial, Materials, Utilities & Medical |
|
Best Stocks Today 12Stocks.com |
© 2024 12Stocks.com Terms & Conditions Privacy Contact Us
All Information Provided Only For Education And Not To Be Used For Investing or Trading. See Terms & Conditions


One More Thing ... Get Best Stocks Delivered Daily!
Never Ever Miss A Move With Our Top Ten Stocks Lists
Find Best Stocks In Any Market - Bull or Bear Market
Take A Peek At Our Top Ten Stocks Lists: Daily, Weekly, Year-to-Date & Top Trends
Find Best Stocks In Any Market - Bull or Bear Market
Take A Peek At Our Top Ten Stocks Lists: Daily, Weekly, Year-to-Date & Top Trends
Smallcap Stocks With Best Up Trends [0-bearish to 100-bullish]: Bakkt [100], Deciphera [100], Phibro Animal[100], Heartland Financial[100], PTC [100], Sight Sciences[100], Richardson Electronics[100], Fulton Financial[100], TPI Composites[100], Cullinan Oncology[100], Lands [100]
Best Smallcap Stocks Year-to-Date:
CareMax [580.41%], Janux [421.92%], Bakkt [346.64%], Viking [305.75%], Longboard [247.46%], Alpine Immune[239.81%], Super Micro[213.22%], Avidity Biosciences[173.23%], Arcutis Bio[171.83%], Vera [167.31%], Cullinan Oncology[166.01%] Best Smallcap Stocks This Week:
Deciphera [72.56%], Phibro Animal[31.81%], Vaxxinity [31.65%], Zevia PBC[20.94%], Velo3D [19.97%], Acrivon [18.2%], Janux [18.18%], MultiPlan [15.53%], Heartland Financial[15.15%], Codexis [14.66%], Eyenovia [13.37%] Best Smallcap Stocks Daily:
Bakkt [2391.87%], Deciphera [72.56%], Phibro Animal[31.81%], Vaxxinity [31.65%], Zevia PBC[20.94%], Velo3D [19.97%], Acrivon [18.20%], Janux [18.18%], MultiPlan [15.53%], Heartland Financial[15.15%], Codexis [14.66%]