
 Login Sign Up


| |||||
 |  | ||||

| 12Stocks.com Market Intelligence |
Best SmallCap Stocks
|
| In a hurry? Small Cap Stock Lists: Performance Trends Table, Stock Charts
Sort Small Cap stocks: Daily, Weekly, Year-to-Date, Market Cap & Trends. Filter Small Cap stocks list by sector: Show all, Tech, Finance, Energy, Staples, Retail, Industrial, Materials, Utilities and HealthCare Filter Small Cap stocks list by size: All Large Medium Small and MicroCap |
| 12Stocks.com Small Cap Stocks Performances & Trends Daily | |||||||||
|
|  The overall Smart Investing & Trading Score is 88 (0-bearish to 100-bullish) which puts Small Cap index in short term bullish trend. The Smart Investing & Trading Score from previous trading session is 56 and hence an improvement of trend.
| ||||||||
Here are the Smart Investing & Trading Scores of the most requested small cap stocks at 12Stocks.com (click stock name for detailed review):
|


| 12Stocks.com: Investing in Smallcap Index with Stocks | |
|
The following table helps investors and traders sort through current performance and trends (as measured by Smart Investing & Trading Score) of various
stocks in the Smallcap Index. Quick View: Move mouse or cursor over stock symbol (ticker) to view short-term technical chart and over stock name to view long term chart. Click on  to add stock symbol to your watchlist and to add stock symbol to your watchlist and  to view watchlist. Click on any ticker or stock name for detailed market intelligence report for that stock. to view watchlist. Click on any ticker or stock name for detailed market intelligence report for that stock. |
12Stocks.com Performance of Stocks in Smallcap Index
| Ticker | Stock Name | Watchlist | Category | Recent Price | Smart Investing & Trading Score | Change % | Weekly Change% |
| SCHL | Scholastic |   | Services & Goods | 36.15 | 44 | -0.74% | -0.74% |
| FISI | Financial Institutions | | Financials | 17.47 | 67 | -0.74% | -0.74% |
| PLPC | Preformed Line | | Industrials | 123.79 | 68 | -0.74% | -0.74% |
| DGICA | Donegal Group | | Financials | 13.35 | 25 | -0.74% | -0.74% |
| SNFCA | Security National | | Financials | 6.67 | 20 | -0.74% | -0.74% |
| NWBI | Northwest Bancshares | | Financials | 10.74 | 25 | -0.74% | -0.74% |
| SES | SES AI | | Services & Goods | 1.35 | 48 | -0.74% | -0.74% |
| ONTF | ON24 | | Technology | 6.69 | 54 | -0.74% | -0.74% |
| AGM | Federal Agricultural | | Financials | 189.60 | 95 | -0.75% | -0.75% |
| BJRI | BJ s | | Services & Goods | 33.19 | 69 | -0.75% | -0.75% |
| FMNB | Farmers National | | Financials | 11.98 | 25 | -0.75% | -0.75% |
| NREF | NexPoint Real | | Financials | 13.16 | 74 | -0.75% | -0.75% |
| ALCO | Alico | | Consumer Staples | 28.55 | 74 | -0.76% | -0.76% |
| FENC | Fennec | | Health Care | 9.14 | 32 | -0.76% | -0.76% |
| PRK | Park National | | Financials | 133.29 | 68 | -0.77% | -0.77% |
| GDOT | Green Dot | | Financials | 8.97 | 50 | -0.77% | -0.77% |
| RSVR | Reservoir Media | | Services & Goods | 9.03 | 86 | -0.77% | -0.77% |
| WLFC | Willis Lease | | Transports | 48.66 | 42 | -0.78% | -0.78% |
| FSBC | Five Star | | Financials | 21.58 | 38 | -0.78% | -0.78% |
| URGN | UroGen Pharma | | Health Care | 14.04 | 30 | -0.78% | -0.78% |
| UNF | UniFirst | | Consumer Staples | 162.94 | 37 | -0.79% | -0.79% |
| KGS | Kodiak Gas | | Energy | 27.67 | 65 | -0.79% | -0.79% |
| CATY | Cathay General | | Financials | 34.76 | 42 | -0.80% | -0.80% |
| KLTR | Kaltura | | Technology | 1.24 | 20 | -0.80% | -0.80% |
| GFF | Griffon | | Industrials | 67.72 | 73 | -0.81% | -0.81% |


| Too many stocks? View smallcap stocks filtered by marketcap & sector |
| Marketcap: All SmallCap Stocks (default-no microcap), Large, Mid-Range, Small |
| Smallcap Sector: Tech, Finance, Energy, Staples, Retail, Industrial, Materials, & Medical |
|
Get the most comprehensive stock market coverage daily at 12Stocks.com ➞ Best Stocks Today ➞ Best Stocks Weekly ➞ Best Stocks Year-to-Date ➞ Best Stocks Trends ➞  Best Stocks Today 12Stocks.com Best Nasdaq Stocks ➞ Best S&P 500 Stocks ➞ Best Tech Stocks ➞ Best Biotech Stocks ➞ |
| Detailed Overview of SmallCap Stocks |
| SmallCap Technical Overview, Leaders & Laggards, Top SmallCap ETF Funds & Detailed SmallCap Stocks List, Charts, Trends & More |
| Smallcap: Technical Analysis, Trends & YTD Performance | |
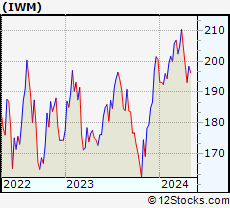
| SmallCap segment as represented by
IWM, an exchange-traded fund [ETF], holds basket of thousands of smallcap stocks from across all major sectors of the US stock market. The smallcap index (contains stocks like Riverbed & Sotheby's) is down by -0.37% and is currently underperforming the overall market by -6.93% year-to-date. Below is a quick view of technical charts and trends: | |
 IWM Weekly Chart |
|
| Long Term Trend: Very Good | |
| Medium Term Trend: Good | |
 IWM Daily Chart |
|
| Short Term Trend: Very Good | |
| Overall Trend Score: 88 | |
| YTD Performance: -0.37% | |
| **Trend Scores & Views Are Only For Educational Purposes And Not For Investing | |
| 12Stocks.com: Top Performing Small Cap Index Stocks | ||||||||||||||||||||||||||||||||||||||||||||||||
 The top performing Small Cap Index stocks year to date are
Now, more recently, over last week, the top performing Small Cap Index stocks on the move are


|
||||||||||||||||||||||||||||||||||||||||||||||||
| 12Stocks.com: Investing in Smallcap Index using Exchange Traded Funds | |
|
The following table shows list of key exchange traded funds (ETF) that
help investors track Smallcap index. The following list also includes leveraged ETF funds that track twice or thrice the daily returns of Smallcap indices. Short or inverse ETF funds move in the opposite direction to the index they track and are useful during market pullbacks or during bear markets. Quick View: Move mouse or cursor over ETF symbol (ticker) to view short-term technical chart and over ETF name to view long term chart. Click on ticker or stock name for detailed view. Click on to add stock symbol to your watchlist and to view watchlist. |
12Stocks.com List of ETFs that track Smallcap Index
| Ticker | ETF Name | Watchlist | Recent Price | Smart Investing & Trading Score | Change % | Week % | Year-to-date % |
| IWM | iShares Russell 2000 | | 199.96 | 88 | 0.79 | 0.79 | -0.37% |
| IJR | iShares Core S&P Small-Cap | | 106.41 | 93 | 0.72 | 0.72 | -1.7% |
| VTWO | Vanguard Russell 2000 ETF | | 80.78 | 88 | 0.70 | 0.7 | -0.39% |
| IWN | iShares Russell 2000 Value | | 152.05 | 93 | 0.60 | 0.6 | -2.11% |
| IWO | iShares Russell 2000 Growth | | 255.74 | 78 | 1.05 | 1.05 | 1.4% |
| IJS | iShares S&P Small-Cap 600 Value | | 97.95 | 70 | 0.78 | 0.78 | -4.97% |
| IJT | iShares S&P Small-Cap 600 Growth | | 126.96 | 88 | 0.69 | 0.69 | 1.45% |
| XSLV | PowerShares S&P SmallCap Low Volatil ETF | | 42.87 | 80 | 0.35 | 0.35 | -2.9% |
| SMLV | SPDR SSGA US Small Cap Low Volatil ETF | | 107.77 | 68 | 0.23 | 0.23 | -4.22% |
| SAA | ProShares Ultra SmallCap600 | | 23.27 | 88 | 1.00 | 1 | -6.73% |
| SBB | ProShares Short SmallCap600 | | 16.28 | 8 | -0.64 | -0.64 | 2.2% |
| SDD | ProShares UltraShort SmallCap600 | | 19.09 | 15 | -1.34 | -1.34 | 3.6% |
| 12Stocks.com: Charts, Trends, Fundamental Data and Performances of SmallCap Stocks | |
|
We now take in-depth look at all SmallCap stocks including charts, multi-period performances and overall trends (as measured by Smart Investing & Trading Score). One can sort SmallCap stocks (click link to choose) by Daily, Weekly and by Year-to-Date performances. Also, one can sort by size of the company or by market capitalization. |
| Select Your Default Chart Type: | |||||
| |||||
| Click on stock symbol or name for detailed view. Click on to add stock symbol to your watchlist and to view watchlist. Quick View: Move mouse or cursor over "Daily" to quickly view daily technical stock chart and over "Weekly" to view weekly technical stock chart. | |||||

 | SCHL Scholastic Corporation |
| Sector: Services & Goods | |
| SubSector: Publishing - Books | |
| MarketCap: 791 Millions | |
| Recent Price: 36.15 Smart Investing & Trading Score: 44 | |
| Day Percent Change: -0.74% Day Change: -0.27 | |
| Week Change: -0.74% Year-to-date Change: -4.1% | |
| SCHL Links: Profile News Message Board | |
| Charts:- Daily , Weekly | |
| Add SCHL to Watchlist: View: Get Complete SCHL Trend Analysis ➞ | |
 | FISI Financial Institutions, Inc. |
| Sector: Financials | |
| SubSector: Regional - Mid-Atlantic Banks | |
| MarketCap: 253.459 Millions | |
| Recent Price: 17.47 Smart Investing & Trading Score: 67 | |
| Day Percent Change: -0.74% Day Change: -0.13 | |
| Week Change: -0.74% Year-to-date Change: -18.0% | |
| FISI Links: Profile News Message Board | |
| Charts:- Daily , Weekly | |
| Add FISI to Watchlist: View: Get Complete FISI Trend Analysis ➞ | |
 | PLPC Preformed Line Products Company |
| Sector: Industrials | |
| SubSector: Industrial Electrical Equipment | |
| MarketCap: 221.779 Millions | |
| Recent Price: 123.79 Smart Investing & Trading Score: 68 | |
| Day Percent Change: -0.74% Day Change: -0.92 | |
| Week Change: -0.74% Year-to-date Change: -7.5% | |
| PLPC Links: Profile News Message Board | |
| Charts:- Daily , Weekly | |
| Add PLPC to Watchlist: View: Get Complete PLPC Trend Analysis ➞ | |
 | DGICA Donegal Group Inc. |
| Sector: Financials | |
| SubSector: Property & Casualty Insurance | |
| MarketCap: 350.512 Millions | |
| Recent Price: 13.35 Smart Investing & Trading Score: 25 | |
| Day Percent Change: -0.74% Day Change: -0.10 | |
| Week Change: -0.74% Year-to-date Change: -4.6% | |
| DGICA Links: Profile News Message Board | |
| Charts:- Daily , Weekly | |
| Add DGICA to Watchlist: View: Get Complete DGICA Trend Analysis ➞ | |
 | SNFCA Security National Financial Corporation |
| Sector: Financials | |
| SubSector: Credit Services | |
| MarketCap: 81.0208 Millions | |
| Recent Price: 6.67 Smart Investing & Trading Score: 20 | |
| Day Percent Change: -0.74% Day Change: -0.05 | |
| Week Change: -0.74% Year-to-date Change: -25.9% | |
| SNFCA Links: Profile News Message Board | |
| Charts:- Daily , Weekly | |
| Add SNFCA to Watchlist: View: Get Complete SNFCA Trend Analysis ➞ | |
 | NWBI Northwest Bancshares, Inc. |
| Sector: Financials | |
| SubSector: Savings & Loans | |
| MarketCap: 1266.3 Millions | |
| Recent Price: 10.74 Smart Investing & Trading Score: 25 | |
| Day Percent Change: -0.74% Day Change: -0.08 | |
| Week Change: -0.74% Year-to-date Change: -13.9% | |
| NWBI Links: Profile News Message Board | |
| Charts:- Daily , Weekly | |
| Add NWBI to Watchlist: View: Get Complete NWBI Trend Analysis ➞ | |
 | SES SES AI Corporation |
| Sector: Services & Goods | |
| SubSector: Auto Parts | |
| MarketCap: 893 Millions | |
| Recent Price: 1.35 Smart Investing & Trading Score: 48 | |
| Day Percent Change: -0.74% Day Change: -0.01 | |
| Week Change: -0.74% Year-to-date Change: -24.6% | |
| SES Links: Profile News Message Board | |
| Charts:- Daily , Weekly | |
| Add SES to Watchlist: View: Get Complete SES Trend Analysis ➞ | |
 | ONTF ON24, Inc. |
| Sector: Technology | |
| SubSector: Software - Application | |
| MarketCap: 386 Millions | |
| Recent Price: 6.69 Smart Investing & Trading Score: 54 | |
| Day Percent Change: -0.74% Day Change: -0.05 | |
| Week Change: -0.74% Year-to-date Change: -15.2% | |
| ONTF Links: Profile News Message Board | |
| Charts:- Daily , Weekly | |
| Add ONTF to Watchlist: View: Get Complete ONTF Trend Analysis ➞ | |
 | AGM Federal Agricultural Mortgage Corporation |
| Sector: Financials | |
| SubSector: Credit Services | |
| MarketCap: 542.008 Millions | |
| Recent Price: 189.60 Smart Investing & Trading Score: 95 | |
| Day Percent Change: -0.75% Day Change: -1.43 | |
| Week Change: -0.75% Year-to-date Change: -0.9% | |
| AGM Links: Profile News Message Board | |
| Charts:- Daily , Weekly | |
| Add AGM to Watchlist: View: Get Complete AGM Trend Analysis ➞ | |
 | BJRI BJ s Restaurants, Inc. |
| Sector: Services & Goods | |
| SubSector: Restaurants | |
| MarketCap: 183.67 Millions | |
| Recent Price: 33.19 Smart Investing & Trading Score: 69 | |
| Day Percent Change: -0.75% Day Change: -0.25 | |
| Week Change: -0.75% Year-to-date Change: -7.8% | |
| BJRI Links: Profile News Message Board | |
| Charts:- Daily , Weekly | |
| Add BJRI to Watchlist: View: Get Complete BJRI Trend Analysis ➞ | |
 | FMNB Farmers National Banc Corp. |
| Sector: Financials | |
| SubSector: Regional - Midwest Banks | |
| MarketCap: 366.57 Millions | |
| Recent Price: 11.98 Smart Investing & Trading Score: 25 | |
| Day Percent Change: -0.75% Day Change: -0.09 | |
| Week Change: -0.75% Year-to-date Change: -17.1% | |
| FMNB Links: Profile News Message Board | |
| Charts:- Daily , Weekly | |
| Add FMNB to Watchlist: View: Get Complete FMNB Trend Analysis ➞ | |
 | NREF NexPoint Real Estate Finance, Inc. |
| Sector: Financials | |
| SubSector: REIT Diversified | |
| MarketCap: 97267 Millions | |
| Recent Price: 13.16 Smart Investing & Trading Score: 74 | |
| Day Percent Change: -0.75% Day Change: -0.10 | |
| Week Change: -0.75% Year-to-date Change: -16.4% | |
| NREF Links: Profile News Message Board | |
| Charts:- Daily , Weekly | |
| Add NREF to Watchlist: View: Get Complete NREF Trend Analysis ➞ | |
 | ALCO Alico, Inc. |
| Sector: Consumer Staples | |
| SubSector: Farm Products | |
| MarketCap: 221.187 Millions | |
| Recent Price: 28.55 Smart Investing & Trading Score: 74 | |
| Day Percent Change: -0.76% Day Change: -0.22 | |
| Week Change: -0.76% Year-to-date Change: -1.8% | |
| ALCO Links: Profile News Message Board | |
| Charts:- Daily , Weekly | |
| Add ALCO to Watchlist: View: Get Complete ALCO Trend Analysis ➞ | |
 | FENC Fennec Pharmaceuticals Inc. |
| Sector: Health Care | |
| SubSector: Biotechnology | |
| MarketCap: 126.785 Millions | |
| Recent Price: 9.14 Smart Investing & Trading Score: 32 | |
| Day Percent Change: -0.76% Day Change: -0.07 | |
| Week Change: -0.76% Year-to-date Change: -18.5% | |
| FENC Links: Profile News Message Board | |
| Charts:- Daily , Weekly | |
| Add FENC to Watchlist: View: Get Complete FENC Trend Analysis ➞ | |
 | PRK Park National Corporation |
| Sector: Financials | |
| SubSector: Regional - Midwest Banks | |
| MarketCap: 1416.6 Millions | |
| Recent Price: 133.29 Smart Investing & Trading Score: 68 | |
| Day Percent Change: -0.77% Day Change: -1.04 | |
| Week Change: -0.77% Year-to-date Change: 0.3% | |
| PRK Links: Profile News Message Board | |
| Charts:- Daily , Weekly | |
| Add PRK to Watchlist: View: Get Complete PRK Trend Analysis ➞ | |
 | GDOT Green Dot Corporation |
| Sector: Financials | |
| SubSector: Credit Services | |
| MarketCap: 1320.08 Millions | |
| Recent Price: 8.97 Smart Investing & Trading Score: 50 | |
| Day Percent Change: -0.77% Day Change: -0.07 | |
| Week Change: -0.77% Year-to-date Change: -9.4% | |
| GDOT Links: Profile News Message Board | |
| Charts:- Daily , Weekly | |
| Add GDOT to Watchlist: View: Get Complete GDOT Trend Analysis ➞ | |
 | RSVR Reservoir Media, Inc. |
| Sector: Services & Goods | |
| SubSector: Entertainment | |
| MarketCap: 389 Millions | |
| Recent Price: 9.03 Smart Investing & Trading Score: 86 | |
| Day Percent Change: -0.77% Day Change: -0.07 | |
| Week Change: -0.77% Year-to-date Change: 26.8% | |
| RSVR Links: Profile News Message Board | |
| Charts:- Daily , Weekly | |
| Add RSVR to Watchlist: View: Get Complete RSVR Trend Analysis ➞ | |
 | WLFC Willis Lease Finance Corporation |
| Sector: Transports | |
| SubSector: Rental & Leasing Services | |
| MarketCap: 122.044 Millions | |
| Recent Price: 48.66 Smart Investing & Trading Score: 42 | |
| Day Percent Change: -0.78% Day Change: -0.38 | |
| Week Change: -0.78% Year-to-date Change: -0.4% | |
| WLFC Links: Profile News Message Board | |
| Charts:- Daily , Weekly | |
| Add WLFC to Watchlist: View: Get Complete WLFC Trend Analysis ➞ | |
 | FSBC Five Star Bancorp |
| Sector: Financials | |
| SubSector: Banks - Regional | |
| MarketCap: 377 Millions | |
| Recent Price: 21.58 Smart Investing & Trading Score: 38 | |
| Day Percent Change: -0.78% Day Change: -0.17 | |
| Week Change: -0.78% Year-to-date Change: -17.6% | |
| FSBC Links: Profile News Message Board | |
| Charts:- Daily , Weekly | |
| Add FSBC to Watchlist: View: Get Complete FSBC Trend Analysis ➞ | |
 | URGN UroGen Pharma Ltd. |
| Sector: Health Care | |
| SubSector: Biotechnology | |
| MarketCap: 373.485 Millions | |
| Recent Price: 14.04 Smart Investing & Trading Score: 30 | |
| Day Percent Change: -0.78% Day Change: -0.11 | |
| Week Change: -0.78% Year-to-date Change: -6.4% | |
| URGN Links: Profile News Message Board | |
| Charts:- Daily , Weekly | |
| Add URGN to Watchlist: View: Get Complete URGN Trend Analysis ➞ | |
 | UNF UniFirst Corporation |
| Sector: Consumer Staples | |
| SubSector: Textile - Apparel Clothing | |
| MarketCap: 2605.65 Millions | |
| Recent Price: 162.94 Smart Investing & Trading Score: 37 | |
| Day Percent Change: -0.79% Day Change: -1.30 | |
| Week Change: -0.79% Year-to-date Change: -10.9% | |
| UNF Links: Profile News Message Board | |
| Charts:- Daily , Weekly | |
| Add UNF to Watchlist: View: Get Complete UNF Trend Analysis ➞ | |
 | KGS Kodiak Gas Services, LLC |
| Sector: Energy | |
| SubSector: Oil & Gas Equipment & Services | |
| MarketCap: 1220 Millions | |
| Recent Price: 27.67 Smart Investing & Trading Score: 65 | |
| Day Percent Change: -0.79% Day Change: -0.22 | |
| Week Change: -0.79% Year-to-date Change: 38.5% | |
| KGS Links: Profile News Message Board | |
| Charts:- Daily , Weekly | |
| Add KGS to Watchlist: View: Get Complete KGS Trend Analysis ➞ | |
 | CATY Cathay General Bancorp |
| Sector: Financials | |
| SubSector: Regional - Pacific Banks | |
| MarketCap: 1781.99 Millions | |
| Recent Price: 34.76 Smart Investing & Trading Score: 42 | |
| Day Percent Change: -0.80% Day Change: -0.28 | |
| Week Change: -0.8% Year-to-date Change: -22.0% | |
| CATY Links: Profile News Message Board | |
| Charts:- Daily , Weekly | |
| Add CATY to Watchlist: View: Get Complete CATY Trend Analysis ➞ | |
 | KLTR Kaltura, Inc. |
| Sector: Technology | |
| SubSector: Software - Application | |
| MarketCap: 293 Millions | |
| Recent Price: 1.24 Smart Investing & Trading Score: 20 | |
| Day Percent Change: -0.80% Day Change: -0.01 | |
| Week Change: -0.8% Year-to-date Change: -36.7% | |
| KLTR Links: Profile News Message Board | |
| Charts:- Daily , Weekly | |
| Add KLTR to Watchlist: View: Get Complete KLTR Trend Analysis ➞ | |
 | GFF Griffon Corporation |
| Sector: Industrials | |
| SubSector: General Building Materials | |
| MarketCap: 616 Millions | |
| Recent Price: 67.72 Smart Investing & Trading Score: 73 | |
| Day Percent Change: -0.81% Day Change: -0.55 | |
| Week Change: -0.81% Year-to-date Change: 11.1% | |
| GFF Links: Profile News Message Board | |
| Charts:- Daily , Weekly | |
| Add GFF to Watchlist: View: Get Complete GFF Trend Analysis ➞ | |
| Too many stocks? View smallcap stocks filtered by marketcap & sector |
| Marketcap: All SmallCap Stocks (default-no microcap), Large, Mid-Range, Small & MicroCap |
| Sector: Tech, Finance, Energy, Staples, Retail, Industrial, Materials, Utilities & Medical |
|
Best Stocks Today 12Stocks.com |
© 2024 12Stocks.com Terms & Conditions Privacy Contact Us
All Information Provided Only For Education And Not To Be Used For Investing or Trading. See Terms & Conditions


One More Thing ... Get Best Stocks Delivered Daily!
Never Ever Miss A Move With Our Top Ten Stocks Lists
Find Best Stocks In Any Market - Bull or Bear Market
Take A Peek At Our Top Ten Stocks Lists: Daily, Weekly, Year-to-Date & Top Trends
Find Best Stocks In Any Market - Bull or Bear Market
Take A Peek At Our Top Ten Stocks Lists: Daily, Weekly, Year-to-Date & Top Trends
Smallcap Stocks With Best Up Trends [0-bearish to 100-bullish]: Bakkt [100], Deciphera [100], Phibro Animal[100], Heartland Financial[100], PTC [100], Sight Sciences[100], Richardson Electronics[100], Fulton Financial[100], TPI Composites[100], Cullinan Oncology[100], Lands [100]
Best Smallcap Stocks Year-to-Date:
CareMax [580.41%], Janux [421.92%], Bakkt [346.64%], Viking [305.75%], Longboard [247.46%], Alpine Immune[239.81%], Super Micro[213.22%], Avidity Biosciences[173.23%], Arcutis Bio[171.83%], Vera [167.31%], Cullinan Oncology[166.01%] Best Smallcap Stocks This Week:
Deciphera [72.56%], Phibro Animal[31.81%], Vaxxinity [31.65%], Zevia PBC[20.94%], Velo3D [19.97%], Acrivon [18.2%], Janux [18.18%], MultiPlan [15.53%], Heartland Financial[15.15%], Codexis [14.66%], Eyenovia [13.37%] Best Smallcap Stocks Daily:
Bakkt [2391.87%], Deciphera [72.56%], Phibro Animal[31.81%], Vaxxinity [31.65%], Zevia PBC[20.94%], Velo3D [19.97%], Acrivon [18.20%], Janux [18.18%], MultiPlan [15.53%], Heartland Financial[15.15%], Codexis [14.66%]