
 Login Sign Up


| |||||
 |  | ||||

| 12Stocks.com Market Intelligence |
Best SmallCap Stocks
|
| In a hurry? Small Cap Stock Lists: Performance Trends Table, Stock Charts
Sort Small Cap stocks: Daily, Weekly, Year-to-Date, Market Cap & Trends. Filter Small Cap stocks list by sector: Show all, Tech, Finance, Energy, Staples, Retail, Industrial, Materials, Utilities and HealthCare Filter Small Cap stocks list by size: All Large Medium Small and MicroCap |
| 12Stocks.com Small Cap Stocks Performances & Trends Daily | |||||||||
|
|  The overall Smart Investing & Trading Score is 88 (0-bearish to 100-bullish) which puts Small Cap index in short term bullish trend. The Smart Investing & Trading Score from previous trading session is 56 and hence an improvement of trend.
| ||||||||
Here are the Smart Investing & Trading Scores of the most requested small cap stocks at 12Stocks.com (click stock name for detailed review):
|


| 12Stocks.com: Investing in Smallcap Index with Stocks | |
|
The following table helps investors and traders sort through current performance and trends (as measured by Smart Investing & Trading Score) of various
stocks in the Smallcap Index. Quick View: Move mouse or cursor over stock symbol (ticker) to view short-term technical chart and over stock name to view long term chart. Click on  to add stock symbol to your watchlist and to add stock symbol to your watchlist and  to view watchlist. Click on any ticker or stock name for detailed market intelligence report for that stock. to view watchlist. Click on any ticker or stock name for detailed market intelligence report for that stock. |
12Stocks.com Performance of Stocks in Smallcap Index
| Ticker | Stock Name | Watchlist | Category | Recent Price | Smart Investing & Trading Score | Change % | Weekly Change% |
| EBTC | Enterprise Bancorp |   | Financials | 24.80 | 57 | -0.40% | -0.40% |
| LQDA | Liquidia | | Health Care | 12.48 | 17 | -0.40% | -0.40% |
| PCT | PureCycle | | Industrials | 4.96 | 54 | -0.40% | -0.40% |
| NR | Newpark Resources | | Energy | 7.24 | 51 | -0.41% | -0.41% |
| ACMR | ACM Research | | Technology | 26.93 | 41 | -0.41% | -0.41% |
| IMAX | IMAX | | Services & Goods | 17.08 | 63 | -0.41% | -0.41% |
| GENC | Gencor Industries | | Industrials | 16.90 | 68 | -0.41% | -0.41% |
| TSQ | Townsquare Media | | Services & Goods | 12.19 | 75 | -0.41% | -0.41% |
| FMBH | First Mid | | Financials | 31.38 | 60 | -0.41% | -0.41% |
| TGAN | Transphorm | | Technology | 4.84 | 28 | -0.41% | -0.41% |
| GLDD | Great Lakes | | Industrials | 7.11 | 10 | -0.42% | -0.42% |
| NBHC | National Bank | | Financials | 33.36 | 32 | -0.42% | -0.42% |
| NN | NextNav | | Technology | 9.38 | 66 | -0.42% | -0.42% |
| THFF | First Financial | | Financials | 36.70 | 55 | -0.43% | -0.43% |
| HCI | HCI Group | | Financials | 114.51 | 85 | -0.43% | -0.43% |
| JBT | John Bean | | Industrials | 90.40 | 25 | -0.44% | -0.44% |
| RDVT | Red Violet | | Technology | 16.91 | 18 | -0.44% | -0.44% |
| RGR | Sturm Ruger | | Industrials | 46.26 | 83 | -0.45% | -0.45% |
| BIPC | Brookfield Infrastructure | | Utilities | 31.16 | 45 | -0.45% | -0.45% |
| NNI | Nelnet | | Financials | 94.38 | 75 | -0.46% | -0.46% |
| PRAA | PRA Group | | Services & Goods | 24.00 | 60 | -0.46% | -0.46% |
| FPI | Farmland Partners | | Financials | 10.79 | 62 | -0.46% | -0.46% |
| ADUS | Addus HomeCare | | Health Care | 94.10 | 53 | -0.47% | -0.47% |
| COOK | Traeger | | Services & Goods | 2.11 | 10 | -0.47% | -0.47% |
| AESI | Atlas Energy | | Energy | 23.32 | 51 | -0.47% | -0.47% |


| Too many stocks? View smallcap stocks filtered by marketcap & sector |
| Marketcap: All SmallCap Stocks (default-no microcap), Large, Mid-Range, Small |
| Smallcap Sector: Tech, Finance, Energy, Staples, Retail, Industrial, Materials, & Medical |
|
Get the most comprehensive stock market coverage daily at 12Stocks.com ➞ Best Stocks Today ➞ Best Stocks Weekly ➞ Best Stocks Year-to-Date ➞ Best Stocks Trends ➞  Best Stocks Today 12Stocks.com Best Nasdaq Stocks ➞ Best S&P 500 Stocks ➞ Best Tech Stocks ➞ Best Biotech Stocks ➞ |
| Detailed Overview of SmallCap Stocks |
| SmallCap Technical Overview, Leaders & Laggards, Top SmallCap ETF Funds & Detailed SmallCap Stocks List, Charts, Trends & More |
| Smallcap: Technical Analysis, Trends & YTD Performance | |
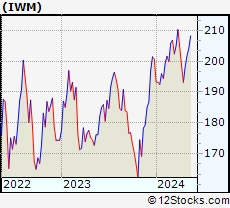
| SmallCap segment as represented by
IWM, an exchange-traded fund [ETF], holds basket of thousands of smallcap stocks from across all major sectors of the US stock market. The smallcap index (contains stocks like Riverbed & Sotheby's) is down by -0.37% and is currently underperforming the overall market by -6.93% year-to-date. Below is a quick view of technical charts and trends: | |
 IWM Weekly Chart |
|
| Long Term Trend: Very Good | |
| Medium Term Trend: Good | |
 IWM Daily Chart |
|
| Short Term Trend: Very Good | |
| Overall Trend Score: 88 | |
| YTD Performance: -0.37% | |
| **Trend Scores & Views Are Only For Educational Purposes And Not For Investing | |
| 12Stocks.com: Top Performing Small Cap Index Stocks | ||||||||||||||||||||||||||||||||||||||||||||||||
 The top performing Small Cap Index stocks year to date are
Now, more recently, over last week, the top performing Small Cap Index stocks on the move are


|
||||||||||||||||||||||||||||||||||||||||||||||||
| 12Stocks.com: Investing in Smallcap Index using Exchange Traded Funds | |
|
The following table shows list of key exchange traded funds (ETF) that
help investors track Smallcap index. The following list also includes leveraged ETF funds that track twice or thrice the daily returns of Smallcap indices. Short or inverse ETF funds move in the opposite direction to the index they track and are useful during market pullbacks or during bear markets. Quick View: Move mouse or cursor over ETF symbol (ticker) to view short-term technical chart and over ETF name to view long term chart. Click on ticker or stock name for detailed view. Click on to add stock symbol to your watchlist and to view watchlist. |
12Stocks.com List of ETFs that track Smallcap Index
| Ticker | ETF Name | Watchlist | Recent Price | Smart Investing & Trading Score | Change % | Week % | Year-to-date % |
| IWM | iShares Russell 2000 | | 199.96 | 88 | 0.79 | 0.79 | -0.37% |
| IJR | iShares Core S&P Small-Cap | | 106.41 | 93 | 0.72 | 0.72 | -1.7% |
| VTWO | Vanguard Russell 2000 ETF | | 80.78 | 88 | 0.70 | 0.7 | -0.39% |
| IWN | iShares Russell 2000 Value | | 152.05 | 93 | 0.60 | 0.6 | -2.11% |
| IWO | iShares Russell 2000 Growth | | 255.74 | 78 | 1.05 | 1.05 | 1.4% |
| IJS | iShares S&P Small-Cap 600 Value | | 97.95 | 70 | 0.78 | 0.78 | -4.97% |
| IJT | iShares S&P Small-Cap 600 Growth | | 126.96 | 88 | 0.69 | 0.69 | 1.45% |
| XSLV | PowerShares S&P SmallCap Low Volatil ETF | | 42.87 | 80 | 0.35 | 0.35 | -2.9% |
| SMLV | SPDR SSGA US Small Cap Low Volatil ETF | | 107.77 | 68 | 0.23 | 0.23 | -4.22% |
| SAA | ProShares Ultra SmallCap600 | | 23.27 | 88 | 1.00 | 1 | -6.73% |
| SBB | ProShares Short SmallCap600 | | 16.28 | 8 | -0.64 | -0.64 | 2.2% |
| SDD | ProShares UltraShort SmallCap600 | | 19.09 | 15 | -1.34 | -1.34 | 3.6% |
| 12Stocks.com: Charts, Trends, Fundamental Data and Performances of SmallCap Stocks | |
|
We now take in-depth look at all SmallCap stocks including charts, multi-period performances and overall trends (as measured by Smart Investing & Trading Score). One can sort SmallCap stocks (click link to choose) by Daily, Weekly and by Year-to-Date performances. Also, one can sort by size of the company or by market capitalization. |
| Select Your Default Chart Type: | |||||
| |||||
| Click on stock symbol or name for detailed view. Click on to add stock symbol to your watchlist and to view watchlist. Quick View: Move mouse or cursor over "Daily" to quickly view daily technical stock chart and over "Weekly" to view weekly technical stock chart. | |||||

 | EBTC Enterprise Bancorp, Inc. |
| Sector: Financials | |
| SubSector: Savings & Loans | |
| MarketCap: 304.53 Millions | |
| Recent Price: 24.80 Smart Investing & Trading Score: 57 | |
| Day Percent Change: -0.40% Day Change: -0.10 | |
| Week Change: -0.4% Year-to-date Change: -23.1% | |
| EBTC Links: Profile News Message Board | |
| Charts:- Daily , Weekly | |
| Add EBTC to Watchlist: View: Get Complete EBTC Trend Analysis ➞ | |
 | LQDA Liquidia Technologies, Inc. |
| Sector: Health Care | |
| SubSector: Biotechnology | |
| MarketCap: 80.4785 Millions | |
| Recent Price: 12.48 Smart Investing & Trading Score: 17 | |
| Day Percent Change: -0.40% Day Change: -0.05 | |
| Week Change: -0.4% Year-to-date Change: 3.7% | |
| LQDA Links: Profile News Message Board | |
| Charts:- Daily , Weekly | |
| Add LQDA to Watchlist: View: Get Complete LQDA Trend Analysis ➞ | |
 | PCT PureCycle Technologies, Inc. |
| Sector: Industrials | |
| SubSector: Pollution & Treatment Controls | |
| MarketCap: 1610 Millions | |
| Recent Price: 4.96 Smart Investing & Trading Score: 54 | |
| Day Percent Change: -0.40% Day Change: -0.02 | |
| Week Change: -0.4% Year-to-date Change: 22.3% | |
| PCT Links: Profile News Message Board | |
| Charts:- Daily , Weekly | |
| Add PCT to Watchlist: View: Get Complete PCT Trend Analysis ➞ | |
 | NR Newpark Resources, Inc. |
| Sector: Energy | |
| SubSector: Oil & Gas Equipment & Services | |
| MarketCap: 109.261 Millions | |
| Recent Price: 7.24 Smart Investing & Trading Score: 51 | |
| Day Percent Change: -0.41% Day Change: -0.03 | |
| Week Change: -0.41% Year-to-date Change: 9.0% | |
| NR Links: Profile News Message Board | |
| Charts:- Daily , Weekly | |
| Add NR to Watchlist: View: Get Complete NR Trend Analysis ➞ | |
 | ACMR ACM Research, Inc. |
| Sector: Technology | |
| SubSector: Semiconductor Equipment & Materials | |
| MarketCap: 438.718 Millions | |
| Recent Price: 26.93 Smart Investing & Trading Score: 41 | |
| Day Percent Change: -0.41% Day Change: -0.11 | |
| Week Change: -0.41% Year-to-date Change: 37.8% | |
| ACMR Links: Profile News Message Board | |
| Charts:- Daily , Weekly | |
| Add ACMR to Watchlist: View: Get Complete ACMR Trend Analysis ➞ | |
 | IMAX IMAX Corporation |
| Sector: Services & Goods | |
| SubSector: Entertainment - Diversified | |
| MarketCap: 874.237 Millions | |
| Recent Price: 17.08 Smart Investing & Trading Score: 63 | |
| Day Percent Change: -0.41% Day Change: -0.07 | |
| Week Change: -0.41% Year-to-date Change: 13.7% | |
| IMAX Links: Profile News Message Board | |
| Charts:- Daily , Weekly | |
| Add IMAX to Watchlist: View: Get Complete IMAX Trend Analysis ➞ | |
 | GENC Gencor Industries, Inc. |
| Sector: Industrials | |
| SubSector: Farm & Construction Machinery | |
| MarketCap: 147.607 Millions | |
| Recent Price: 16.90 Smart Investing & Trading Score: 68 | |
| Day Percent Change: -0.41% Day Change: -0.07 | |
| Week Change: -0.41% Year-to-date Change: 4.7% | |
| GENC Links: Profile News Message Board | |
| Charts:- Daily , Weekly | |
| Add GENC to Watchlist: View: Get Complete GENC Trend Analysis ➞ | |
 | TSQ Townsquare Media, Inc. |
| Sector: Services & Goods | |
| SubSector: Broadcasting - Radio | |
| MarketCap: 101.795 Millions | |
| Recent Price: 12.19 Smart Investing & Trading Score: 75 | |
| Day Percent Change: -0.41% Day Change: -0.05 | |
| Week Change: -0.41% Year-to-date Change: 15.4% | |
| TSQ Links: Profile News Message Board | |
| Charts:- Daily , Weekly | |
| Add TSQ to Watchlist: View: Get Complete TSQ Trend Analysis ➞ | |
 | FMBH First Mid Bancshares, Inc. |
| Sector: Financials | |
| SubSector: Regional - Midwest Banks | |
| MarketCap: 373.27 Millions | |
| Recent Price: 31.38 Smart Investing & Trading Score: 60 | |
| Day Percent Change: -0.41% Day Change: -0.13 | |
| Week Change: -0.41% Year-to-date Change: -9.5% | |
| FMBH Links: Profile News Message Board | |
| Charts:- Daily , Weekly | |
| Add FMBH to Watchlist: View: Get Complete FMBH Trend Analysis ➞ | |
 | TGAN Transphorm, Inc. |
| Sector: Technology | |
| SubSector: Semiconductor Equipment & Materials | |
| MarketCap: 194 Millions | |
| Recent Price: 4.84 Smart Investing & Trading Score: 28 | |
| Day Percent Change: -0.41% Day Change: -0.02 | |
| Week Change: -0.41% Year-to-date Change: 32.1% | |
| TGAN Links: Profile News Message Board | |
| Charts:- Daily , Weekly | |
| Add TGAN to Watchlist: View: Get Complete TGAN Trend Analysis ➞ | |
 | GLDD Great Lakes Dredge & Dock Corporation |
| Sector: Industrials | |
| SubSector: Heavy Construction | |
| MarketCap: 619.095 Millions | |
| Recent Price: 7.11 Smart Investing & Trading Score: 10 | |
| Day Percent Change: -0.42% Day Change: -0.03 | |
| Week Change: -0.42% Year-to-date Change: -7.4% | |
| GLDD Links: Profile News Message Board | |
| Charts:- Daily , Weekly | |
| Add GLDD to Watchlist: View: Get Complete GLDD Trend Analysis ➞ | |
 | NBHC National Bank Holdings Corporation |
| Sector: Financials | |
| SubSector: Regional - Midwest Banks | |
| MarketCap: 766.87 Millions | |
| Recent Price: 33.36 Smart Investing & Trading Score: 32 | |
| Day Percent Change: -0.42% Day Change: -0.14 | |
| Week Change: -0.42% Year-to-date Change: -10.3% | |
| NBHC Links: Profile News Message Board | |
| Charts:- Daily , Weekly | |
| Add NBHC to Watchlist: View: Get Complete NBHC Trend Analysis ➞ | |
 | NN NextNav Inc. |
| Sector: Technology | |
| SubSector: Software - Infrastructure | |
| MarketCap: 314 Millions | |
| Recent Price: 9.38 Smart Investing & Trading Score: 66 | |
| Day Percent Change: -0.42% Day Change: -0.04 | |
| Week Change: -0.42% Year-to-date Change: 110.8% | |
| NN Links: Profile News Message Board | |
| Charts:- Daily , Weekly | |
| Add NN to Watchlist: View: Get Complete NN Trend Analysis ➞ | |
 | THFF First Financial Corporation |
| Sector: Financials | |
| SubSector: Regional - Midwest Banks | |
| MarketCap: 433.07 Millions | |
| Recent Price: 36.70 Smart Investing & Trading Score: 55 | |
| Day Percent Change: -0.43% Day Change: -0.16 | |
| Week Change: -0.43% Year-to-date Change: -14.7% | |
| THFF Links: Profile News Message Board | |
| Charts:- Daily , Weekly | |
| Add THFF to Watchlist: View: Get Complete THFF Trend Analysis ➞ | |
 | HCI HCI Group, Inc. |
| Sector: Financials | |
| SubSector: Property & Casualty Insurance | |
| MarketCap: 297.412 Millions | |
| Recent Price: 114.51 Smart Investing & Trading Score: 85 | |
| Day Percent Change: -0.43% Day Change: -0.49 | |
| Week Change: -0.43% Year-to-date Change: 31.0% | |
| HCI Links: Profile News Message Board | |
| Charts:- Daily , Weekly | |
| Add HCI to Watchlist: View: Get Complete HCI Trend Analysis ➞ | |
 | JBT John Bean Technologies Corporation |
| Sector: Industrials | |
| SubSector: Diversified Machinery | |
| MarketCap: 2197.36 Millions | |
| Recent Price: 90.40 Smart Investing & Trading Score: 25 | |
| Day Percent Change: -0.44% Day Change: -0.40 | |
| Week Change: -0.44% Year-to-date Change: -9.1% | |
| JBT Links: Profile News Message Board | |
| Charts:- Daily , Weekly | |
| Add JBT to Watchlist: View: Get Complete JBT Trend Analysis ➞ | |
 | RDVT Red Violet, Inc. |
| Sector: Technology | |
| SubSector: Application Software | |
| MarketCap: 215.162 Millions | |
| Recent Price: 16.91 Smart Investing & Trading Score: 18 | |
| Day Percent Change: -0.44% Day Change: -0.07 | |
| Week Change: -0.44% Year-to-date Change: -15.3% | |
| RDVT Links: Profile News Message Board | |
| Charts:- Daily , Weekly | |
| Add RDVT to Watchlist: View: Get Complete RDVT Trend Analysis ➞ | |
 | RGR Sturm, Ruger & Company, Inc. |
| Sector: Industrials | |
| SubSector: Aerospace/Defense Products & Services | |
| MarketCap: 752 Millions | |
| Recent Price: 46.26 Smart Investing & Trading Score: 83 | |
| Day Percent Change: -0.45% Day Change: -0.21 | |
| Week Change: -0.45% Year-to-date Change: 1.8% | |
| RGR Links: Profile News Message Board | |
| Charts:- Daily , Weekly | |
| Add RGR to Watchlist: View: Get Complete RGR Trend Analysis ➞ | |
 | BIPC Brookfield Infrastructure Corporation |
| Sector: Utilities | |
| SubSector: Utilities Regulated Gas | |
| MarketCap: 31197 Millions | |
| Recent Price: 31.16 Smart Investing & Trading Score: 45 | |
| Day Percent Change: -0.45% Day Change: -0.14 | |
| Week Change: -0.45% Year-to-date Change: -11.7% | |
| BIPC Links: Profile News Message Board | |
| Charts:- Daily , Weekly | |
| Add BIPC to Watchlist: View: Get Complete BIPC Trend Analysis ➞ | |
 | NNI Nelnet, Inc. |
| Sector: Financials | |
| SubSector: Credit Services | |
| MarketCap: 1664.38 Millions | |
| Recent Price: 94.38 Smart Investing & Trading Score: 75 | |
| Day Percent Change: -0.46% Day Change: -0.44 | |
| Week Change: -0.46% Year-to-date Change: 7.0% | |
| NNI Links: Profile News Message Board | |
| Charts:- Daily , Weekly | |
| Add NNI to Watchlist: View: Get Complete NNI Trend Analysis ➞ | |
 | PRAA PRA Group, Inc. |
| Sector: Services & Goods | |
| SubSector: Business Services | |
| MarketCap: 1290.32 Millions | |
| Recent Price: 24.00 Smart Investing & Trading Score: 60 | |
| Day Percent Change: -0.46% Day Change: -0.11 | |
| Week Change: -0.46% Year-to-date Change: -8.4% | |
| PRAA Links: Profile News Message Board | |
| Charts:- Daily , Weekly | |
| Add PRAA to Watchlist: View: Get Complete PRAA Trend Analysis ➞ | |
 | FPI Farmland Partners Inc. |
| Sector: Financials | |
| SubSector: REIT - Diversified | |
| MarketCap: 182.653 Millions | |
| Recent Price: 10.79 Smart Investing & Trading Score: 62 | |
| Day Percent Change: -0.46% Day Change: -0.05 | |
| Week Change: -0.46% Year-to-date Change: -13.5% | |
| FPI Links: Profile News Message Board | |
| Charts:- Daily , Weekly | |
| Add FPI to Watchlist: View: Get Complete FPI Trend Analysis ➞ | |
 | ADUS Addus HomeCare Corporation |
| Sector: Health Care | |
| SubSector: Home Health Care | |
| MarketCap: 994.795 Millions | |
| Recent Price: 94.10 Smart Investing & Trading Score: 53 | |
| Day Percent Change: -0.47% Day Change: -0.44 | |
| Week Change: -0.47% Year-to-date Change: 1.4% | |
| ADUS Links: Profile News Message Board | |
| Charts:- Daily , Weekly | |
| Add ADUS to Watchlist: View: Get Complete ADUS Trend Analysis ➞ | |
 | COOK Traeger, Inc. |
| Sector: Services & Goods | |
| SubSector: Furnishings, Fixtures & Appliances | |
| MarketCap: 524 Millions | |
| Recent Price: 2.11 Smart Investing & Trading Score: 10 | |
| Day Percent Change: -0.47% Day Change: -0.01 | |
| Week Change: -0.47% Year-to-date Change: -25.3% | |
| COOK Links: Profile News Message Board | |
| Charts:- Daily , Weekly | |
| Add COOK to Watchlist: View: Get Complete COOK Trend Analysis ➞ | |
 | AESI Atlas Energy Solutions Inc. |
| Sector: Energy | |
| SubSector: Oil & Gas Equipment & Services | |
| MarketCap: 947 Millions | |
| Recent Price: 23.32 Smart Investing & Trading Score: 51 | |
| Day Percent Change: -0.47% Day Change: -0.11 | |
| Week Change: -0.47% Year-to-date Change: 36.2% | |
| AESI Links: Profile News Message Board | |
| Charts:- Daily , Weekly | |
| Add AESI to Watchlist: View: Get Complete AESI Trend Analysis ➞ | |
| Too many stocks? View smallcap stocks filtered by marketcap & sector |
| Marketcap: All SmallCap Stocks (default-no microcap), Large, Mid-Range, Small & MicroCap |
| Sector: Tech, Finance, Energy, Staples, Retail, Industrial, Materials, Utilities & Medical |
|
Best Stocks Today 12Stocks.com |
© 2024 12Stocks.com Terms & Conditions Privacy Contact Us
All Information Provided Only For Education And Not To Be Used For Investing or Trading. See Terms & Conditions


One More Thing ... Get Best Stocks Delivered Daily!
Never Ever Miss A Move With Our Top Ten Stocks Lists
Find Best Stocks In Any Market - Bull or Bear Market
Take A Peek At Our Top Ten Stocks Lists: Daily, Weekly, Year-to-Date & Top Trends
Find Best Stocks In Any Market - Bull or Bear Market
Take A Peek At Our Top Ten Stocks Lists: Daily, Weekly, Year-to-Date & Top Trends
Smallcap Stocks With Best Up Trends [0-bearish to 100-bullish]: Bakkt [100], Deciphera [100], Phibro Animal[100], Heartland Financial[100], PTC [100], Sight Sciences[100], Richardson Electronics[100], Fulton Financial[100], Cullinan Oncology[100], TPI Composites[100], Lands [100]
Best Smallcap Stocks Year-to-Date:
CareMax [572.16%], Janux [422.57%], Bakkt [346.64%], Viking [305.75%], Longboard [248.45%], Alpine Immune[239.81%], Super Micro[213.31%], Avidity Biosciences[173.17%], Arcutis Bio[170.43%], Vera [167.34%], Cullinan Oncology[166.41%] Best Smallcap Stocks This Week:
Deciphera [71.95%], Vaxxinity [35.33%], Phibro Animal[31.89%], Zevia PBC[20.94%], Velo3D [19.97%], Janux [18.32%], Acrivon [18.09%], MultiPlan [15.53%], Heartland Financial[15.24%], Codexis [14.29%], Eyenovia [13.66%] Best Smallcap Stocks Daily:
Bakkt [2391.87%], Deciphera [71.95%], Vaxxinity [35.33%], Phibro Animal[31.89%], Zevia PBC[20.94%], Velo3D [19.97%], Janux [18.32%], Acrivon [18.09%], MultiPlan [15.53%], Heartland Financial[15.24%], Codexis [14.29%]