
 Login Sign Up


| |||||
 |  | ||||

| 12Stocks.com Market Intelligence |
Best SmallCap Stocks
|
| In a hurry? Small Cap Stock Lists: Performance Trends Table, Stock Charts
Sort Small Cap stocks: Daily, Weekly, Year-to-Date, Market Cap & Trends. Filter Small Cap stocks list by sector: Show all, Tech, Finance, Energy, Staples, Retail, Industrial, Materials, Utilities and HealthCare Filter Small Cap stocks list by size: All Large Medium Small and MicroCap |
| 12Stocks.com Small Cap Stocks Performances & Trends Daily | |||||||||
|
|  The overall Smart Investing & Trading Score is 44 (0-bearish to 100-bullish) which puts Small Cap index in short term neutral trend. The Smart Investing & Trading Score from previous trading session is 58 and hence a deterioration of trend.
| ||||||||
Here are the Smart Investing & Trading Scores of the most requested small cap stocks at 12Stocks.com (click stock name for detailed review):
|


| 12Stocks.com: Investing in Smallcap Index with Stocks | |
|
The following table helps investors and traders sort through current performance and trends (as measured by Smart Investing & Trading Score) of various
stocks in the Smallcap Index. Quick View: Move mouse or cursor over stock symbol (ticker) to view short-term technical chart and over stock name to view long term chart. Click on  to add stock symbol to your watchlist and to add stock symbol to your watchlist and  to view watchlist. Click on any ticker or stock name for detailed market intelligence report for that stock. to view watchlist. Click on any ticker or stock name for detailed market intelligence report for that stock. |
12Stocks.com Performance of Stocks in Smallcap Index
| Ticker | Stock Name | Watchlist | Category | Recent Price | Smart Investing & Trading Score | Change % | Weekly Change% |
| ABG | Asbury Automotive |   | Services & Goods | 217.12 | 66 | -2.00% | 0.93% |
| RC | Ready Capital | | Financials | 8.70 | 35 | -1.36% | 0.93% |
| WEAV | Weave | | Technology | 10.91 | 25 | -0.27% | 0.93% |
| WABC | Westamerica Ban | | Financials | 47.21 | 73 | -1.36% | 0.92% |
| EXPI | eXp World | | Financials | 9.95 | 57 | -3.77% | 0.91% |
| SSTI | ShotSpotter | | Technology | 13.45 | 28 | -0.07% | 0.90% |
| THFF | First Financial | | Financials | 36.94 | 47 | -0.81% | 0.90% |
| HI | Hillenbrand | | Industrials | 48.45 | 83 | -1.02% | 0.90% |
| CEIX | CONSOL Energy | | Materials | 84.83 | 32 | 1.68% | 0.90% |
| ATLO | Ames National | | Financials | 19.32 | 52 | -0.05% | 0.89% |
| QNST | QuinStreet | | Technology | 16.95 | 83 | -3.97% | 0.89% |
| GSBC | Great Southern | | Financials | 52.91 | 93 | -1.40% | 0.88% |
| OFLX | Omega Flex | | Industrials | 67.59 | 42 | 0.13% | 0.88% |
| EPM | Evolution | | Energy | 5.78 | 61 | 0.52% | 0.87% |
| TYRA | Tyra Biosciences | | Health Care | 15.11 | 58 | -5.53% | 0.87% |
| ALCO | Alico | | Consumer Staples | 28.24 | 47 | 0.79% | 0.86% |
| YORW | York Water | | Utilities | 35.37 | 60 | -0.45% | 0.86% |
| WTTR | Select Energy | | Industrials | 9.42 | 61 | 0.64% | 0.86% |
| AFCG | AFC Gamma | | Financials | 11.75 | 68 | -0.47% | 0.86% |
| KRT | Karat Packaging | | Services & Goods | 27.06 | 51 | 0.37% | 0.86% |
| UFPT | UFP | | Consumer Staples | 209.65 | 56 | -2.21% | 0.83% |
| BH | Biglari | | Services & Goods | 201.36 | 76 | 0.58% | 0.82% |
| PAYO | Payoneer Global | | Technology | 4.93 | 93 | -2.38% | 0.82% |
| CBZ | CBIZ | | Services & Goods | 75.53 | 83 | -3.57% | 0.81% |
| FSLY | Fastly | | Technology | 12.40 | 30 | -3.35% | 0.81% |


| Too many stocks? View smallcap stocks filtered by marketcap & sector |
| Marketcap: All SmallCap Stocks (default-no microcap), Large, Mid-Range, Small |
| Smallcap Sector: Tech, Finance, Energy, Staples, Retail, Industrial, Materials, & Medical |
|
Get the most comprehensive stock market coverage daily at 12Stocks.com ➞ Best Stocks Today ➞ Best Stocks Weekly ➞ Best Stocks Year-to-Date ➞ Best Stocks Trends ➞  Best Stocks Today 12Stocks.com Best Nasdaq Stocks ➞ Best S&P 500 Stocks ➞ Best Tech Stocks ➞ Best Biotech Stocks ➞ |
| Detailed Overview of SmallCap Stocks |
| SmallCap Technical Overview, Leaders & Laggards, Top SmallCap ETF Funds & Detailed SmallCap Stocks List, Charts, Trends & More |
| Smallcap: Technical Analysis, Trends & YTD Performance | |
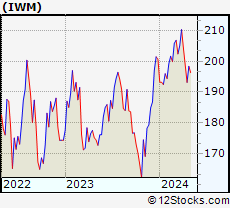
| SmallCap segment as represented by
IWM, an exchange-traded fund [ETF], holds basket of thousands of smallcap stocks from across all major sectors of the US stock market. The smallcap index (contains stocks like Riverbed & Sotheby's) is down by -2.11% and is currently underperforming the overall market by -7.27% year-to-date. Below is a quick view of technical charts and trends: | |
 IWM Weekly Chart |
|
| Long Term Trend: Good | |
| Medium Term Trend: Not Good | |
 IWM Daily Chart |
|
| Short Term Trend: Very Good | |
| Overall Trend Score: 44 | |
| YTD Performance: -2.11% | |
| **Trend Scores & Views Are Only For Educational Purposes And Not For Investing | |
| 12Stocks.com: Top Performing Small Cap Index Stocks | ||||||||||||||||||||||||||||||||||||||||||||||||
 The top performing Small Cap Index stocks year to date are
Now, more recently, over last week, the top performing Small Cap Index stocks on the move are


|
||||||||||||||||||||||||||||||||||||||||||||||||
| 12Stocks.com: Investing in Smallcap Index using Exchange Traded Funds | |
|
The following table shows list of key exchange traded funds (ETF) that
help investors track Smallcap index. The following list also includes leveraged ETF funds that track twice or thrice the daily returns of Smallcap indices. Short or inverse ETF funds move in the opposite direction to the index they track and are useful during market pullbacks or during bear markets. Quick View: Move mouse or cursor over ETF symbol (ticker) to view short-term technical chart and over ETF name to view long term chart. Click on ticker or stock name for detailed view. Click on to add stock symbol to your watchlist and to view watchlist. |
12Stocks.com List of ETFs that track Smallcap Index
| Ticker | ETF Name | Watchlist | Recent Price | Smart Investing & Trading Score | Change % | Week % | Year-to-date % |
| IWM | iShares Russell 2000 | | 196.48 | 44 | -0.61 | 1.73 | -2.11% |
| IJR | iShares Core S&P Small-Cap | | 104.86 | 78 | -0.80 | 1.59 | -3.13% |
| VTWO | Vanguard Russell 2000 ETF | | 79.45 | 63 | -0.60 | 1.75 | -2.03% |
| IWN | iShares Russell 2000 Value | | 150.18 | 68 | -0.73 | 1.62 | -3.32% |
| IWO | iShares Russell 2000 Growth | | 249.86 | 51 | -0.56 | 1.86 | -0.94% |
| IJS | iShares S&P Small-Cap 600 Value | | 96.69 | 60 | -1.04 | 1.13 | -6.19% |
| IJT | iShares S&P Small-Cap 600 Growth | | 125.06 | 63 | -0.25 | 2.33 | -0.06% |
| XSLV | PowerShares S&P SmallCap Low Volatil ETF | | 42.54 | 73 | -0.93 | 0.85 | -3.65% |
| SDD | ProShares UltraShort SmallCap600 | | 19.58 | 42 | 0.46 | -3.74 | 6.26% |
| SBB | ProShares Short SmallCap600 | | 16.50 | 40 | 0.79 | -2.02 | 3.58% |
| SMLV | SPDR SSGA US Small Cap Low Volatil ETF | | 107.33 | 73 | -1.01 | 1.17 | -4.61% |
| SAA | ProShares Ultra SmallCap600 | | 22.66 | 58 | -1.52 | 3.94 | -9.18% |
| 12Stocks.com: Charts, Trends, Fundamental Data and Performances of SmallCap Stocks | |
|
We now take in-depth look at all SmallCap stocks including charts, multi-period performances and overall trends (as measured by Smart Investing & Trading Score). One can sort SmallCap stocks (click link to choose) by Daily, Weekly and by Year-to-Date performances. Also, one can sort by size of the company or by market capitalization. |
| Select Your Default Chart Type: | |||||
| |||||
| Click on stock symbol or name for detailed view. Click on to add stock symbol to your watchlist and to view watchlist. Quick View: Move mouse or cursor over "Daily" to quickly view daily technical stock chart and over "Weekly" to view weekly technical stock chart. | |||||

 | ABG Asbury Automotive Group, Inc. |
| Sector: Services & Goods | |
| SubSector: Auto Dealerships | |
| MarketCap: 1203.21 Millions | |
| Recent Price: 217.12 Smart Investing & Trading Score: 66 | |
| Day Percent Change: -2.00% Day Change: -4.42 | |
| Week Change: 0.93% Year-to-date Change: -3.5% | |
| ABG Links: Profile News Message Board | |
| Charts:- Daily , Weekly | |
| Add ABG to Watchlist: View: Get Complete ABG Trend Analysis ➞ | |
 | RC Ready Capital Corporation |
| Sector: Financials | |
| SubSector: Mortgage Investment | |
| MarketCap: 358.039 Millions | |
| Recent Price: 8.70 Smart Investing & Trading Score: 35 | |
| Day Percent Change: -1.36% Day Change: -0.12 | |
| Week Change: 0.93% Year-to-date Change: -15.1% | |
| RC Links: Profile News Message Board | |
| Charts:- Daily , Weekly | |
| Add RC to Watchlist: View: Get Complete RC Trend Analysis ➞ | |
 | WEAV Weave Communications, Inc. |
| Sector: Technology | |
| SubSector: Software - Application | |
| MarketCap: 740 Millions | |
| Recent Price: 10.91 Smart Investing & Trading Score: 25 | |
| Day Percent Change: -0.27% Day Change: -0.03 | |
| Week Change: 0.93% Year-to-date Change: -6.1% | |
| WEAV Links: Profile News Message Board | |
| Charts:- Daily , Weekly | |
| Add WEAV to Watchlist: View: Get Complete WEAV Trend Analysis ➞ | |
 | WABC Westamerica Bancorporation |
| Sector: Financials | |
| SubSector: Regional - Pacific Banks | |
| MarketCap: 1557.69 Millions | |
| Recent Price: 47.21 Smart Investing & Trading Score: 73 | |
| Day Percent Change: -1.36% Day Change: -0.65 | |
| Week Change: 0.92% Year-to-date Change: -16.3% | |
| WABC Links: Profile News Message Board | |
| Charts:- Daily , Weekly | |
| Add WABC to Watchlist: View: Get Complete WABC Trend Analysis ➞ | |
 | EXPI eXp World Holdings, Inc. |
| Sector: Financials | |
| SubSector: Property Management | |
| MarketCap: 448.042 Millions | |
| Recent Price: 9.95 Smart Investing & Trading Score: 57 | |
| Day Percent Change: -3.77% Day Change: -0.39 | |
| Week Change: 0.91% Year-to-date Change: -35.9% | |
| EXPI Links: Profile News Message Board | |
| Charts:- Daily , Weekly | |
| Add EXPI to Watchlist: View: Get Complete EXPI Trend Analysis ➞ | |
 | SSTI ShotSpotter, Inc. |
| Sector: Technology | |
| SubSector: Application Software | |
| MarketCap: 353.062 Millions | |
| Recent Price: 13.45 Smart Investing & Trading Score: 28 | |
| Day Percent Change: -0.07% Day Change: -0.01 | |
| Week Change: 0.9% Year-to-date Change: -47.3% | |
| SSTI Links: Profile News Message Board | |
| Charts:- Daily , Weekly | |
| Add SSTI to Watchlist: View: Get Complete SSTI Trend Analysis ➞ | |
 | THFF First Financial Corporation |
| Sector: Financials | |
| SubSector: Regional - Midwest Banks | |
| MarketCap: 433.07 Millions | |
| Recent Price: 36.94 Smart Investing & Trading Score: 47 | |
| Day Percent Change: -0.81% Day Change: -0.30 | |
| Week Change: 0.9% Year-to-date Change: -14.2% | |
| THFF Links: Profile News Message Board | |
| Charts:- Daily , Weekly | |
| Add THFF to Watchlist: View: Get Complete THFF Trend Analysis ➞ | |
 | HI Hillenbrand, Inc. |
| Sector: Industrials | |
| SubSector: Diversified Machinery | |
| MarketCap: 1389.86 Millions | |
| Recent Price: 48.45 Smart Investing & Trading Score: 83 | |
| Day Percent Change: -1.02% Day Change: -0.50 | |
| Week Change: 0.9% Year-to-date Change: 1.3% | |
| HI Links: Profile News Message Board | |
| Charts:- Daily , Weekly | |
| Add HI to Watchlist: View: Get Complete HI Trend Analysis ➞ | |
 | CEIX CONSOL Energy Inc. |
| Sector: Materials | |
| SubSector: Industrial Metals & Minerals | |
| MarketCap: 196.81 Millions | |
| Recent Price: 84.83 Smart Investing & Trading Score: 32 | |
| Day Percent Change: 1.68% Day Change: 1.40 | |
| Week Change: 0.9% Year-to-date Change: -15.6% | |
| CEIX Links: Profile News Message Board | |
| Charts:- Daily , Weekly | |
| Add CEIX to Watchlist: View: Get Complete CEIX Trend Analysis ➞ | |
 | ATLO Ames National Corporation |
| Sector: Financials | |
| SubSector: Regional - Northeast Banks | |
| MarketCap: 195.999 Millions | |
| Recent Price: 19.32 Smart Investing & Trading Score: 52 | |
| Day Percent Change: -0.05% Day Change: -0.01 | |
| Week Change: 0.89% Year-to-date Change: -9.5% | |
| ATLO Links: Profile News Message Board | |
| Charts:- Daily , Weekly | |
| Add ATLO to Watchlist: View: Get Complete ATLO Trend Analysis ➞ | |
 | QNST QuinStreet, Inc. |
| Sector: Technology | |
| SubSector: Internet Software & Services | |
| MarketCap: 411.791 Millions | |
| Recent Price: 16.95 Smart Investing & Trading Score: 83 | |
| Day Percent Change: -3.97% Day Change: -0.70 | |
| Week Change: 0.89% Year-to-date Change: 32.2% | |
| QNST Links: Profile News Message Board | |
| Charts:- Daily , Weekly | |
| Add QNST to Watchlist: View: Get Complete QNST Trend Analysis ➞ | |
 | GSBC Great Southern Bancorp, Inc. |
| Sector: Financials | |
| SubSector: Regional - Southwest Banks | |
| MarketCap: 524.765 Millions | |
| Recent Price: 52.91 Smart Investing & Trading Score: 93 | |
| Day Percent Change: -1.40% Day Change: -0.75 | |
| Week Change: 0.88% Year-to-date Change: -10.9% | |
| GSBC Links: Profile News Message Board | |
| Charts:- Daily , Weekly | |
| Add GSBC to Watchlist: View: Get Complete GSBC Trend Analysis ➞ | |
 | OFLX Omega Flex, Inc. |
| Sector: Industrials | |
| SubSector: Industrial Equipment & Components | |
| MarketCap: 590.609 Millions | |
| Recent Price: 67.59 Smart Investing & Trading Score: 42 | |
| Day Percent Change: 0.13% Day Change: 0.09 | |
| Week Change: 0.88% Year-to-date Change: -4.1% | |
| OFLX Links: Profile News Message Board | |
| Charts:- Daily , Weekly | |
| Add OFLX to Watchlist: View: Get Complete OFLX Trend Analysis ➞ | |
 | EPM Evolution Petroleum Corporation |
| Sector: Energy | |
| SubSector: Independent Oil & Gas | |
| MarketCap: 98.0593 Millions | |
| Recent Price: 5.78 Smart Investing & Trading Score: 61 | |
| Day Percent Change: 0.52% Day Change: 0.03 | |
| Week Change: 0.87% Year-to-date Change: -0.5% | |
| EPM Links: Profile News Message Board | |
| Charts:- Daily , Weekly | |
| Add EPM to Watchlist: View: Get Complete EPM Trend Analysis ➞ | |
 | TYRA Tyra Biosciences, Inc. |
| Sector: Health Care | |
| SubSector: Biotechnology | |
| MarketCap: 732 Millions | |
| Recent Price: 15.11 Smart Investing & Trading Score: 58 | |
| Day Percent Change: -5.53% Day Change: -0.88 | |
| Week Change: 0.87% Year-to-date Change: 13.4% | |
| TYRA Links: Profile News Message Board | |
| Charts:- Daily , Weekly | |
| Add TYRA to Watchlist: View: Get Complete TYRA Trend Analysis ➞ | |
 | ALCO Alico, Inc. |
| Sector: Consumer Staples | |
| SubSector: Farm Products | |
| MarketCap: 221.187 Millions | |
| Recent Price: 28.24 Smart Investing & Trading Score: 47 | |
| Day Percent Change: 0.79% Day Change: 0.22 | |
| Week Change: 0.86% Year-to-date Change: -2.9% | |
| ALCO Links: Profile News Message Board | |
| Charts:- Daily , Weekly | |
| Add ALCO to Watchlist: View: Get Complete ALCO Trend Analysis ➞ | |
 | YORW The York Water Company |
| Sector: Utilities | |
| SubSector: Water Utilities | |
| MarketCap: 539.502 Millions | |
| Recent Price: 35.37 Smart Investing & Trading Score: 60 | |
| Day Percent Change: -0.45% Day Change: -0.16 | |
| Week Change: 0.86% Year-to-date Change: -8.4% | |
| YORW Links: Profile News Message Board | |
| Charts:- Daily , Weekly | |
| Add YORW to Watchlist: View: Get Complete YORW Trend Analysis ➞ | |
 | WTTR Select Energy Services, Inc. |
| Sector: Industrials | |
| SubSector: Pollution & Treatment Controls | |
| MarketCap: 347.075 Millions | |
| Recent Price: 9.42 Smart Investing & Trading Score: 61 | |
| Day Percent Change: 0.64% Day Change: 0.06 | |
| Week Change: 0.86% Year-to-date Change: 24.1% | |
| WTTR Links: Profile News Message Board | |
| Charts:- Daily , Weekly | |
| Add WTTR to Watchlist: View: Get Complete WTTR Trend Analysis ➞ | |
 | AFCG AFC Gamma, Inc. |
| Sector: Financials | |
| SubSector: REIT - Specialty | |
| MarketCap: 269 Millions | |
| Recent Price: 11.75 Smart Investing & Trading Score: 68 | |
| Day Percent Change: -0.47% Day Change: -0.05 | |
| Week Change: 0.86% Year-to-date Change: -2.5% | |
| AFCG Links: Profile News Message Board | |
| Charts:- Daily , Weekly | |
| Add AFCG to Watchlist: View: Get Complete AFCG Trend Analysis ➞ | |
 | KRT Karat Packaging Inc. |
| Sector: Services & Goods | |
| SubSector: Packaging & Containers | |
| MarketCap: 357 Millions | |
| Recent Price: 27.06 Smart Investing & Trading Score: 51 | |
| Day Percent Change: 0.37% Day Change: 0.10 | |
| Week Change: 0.86% Year-to-date Change: 8.6% | |
| KRT Links: Profile News Message Board | |
| Charts:- Daily , Weekly | |
| Add KRT to Watchlist: View: Get Complete KRT Trend Analysis ➞ | |
 | UFPT UFP Technologies, Inc. |
| Sector: Consumer Staples | |
| SubSector: Packaging & Containers | |
| MarketCap: 284.053 Millions | |
| Recent Price: 209.65 Smart Investing & Trading Score: 56 | |
| Day Percent Change: -2.21% Day Change: -4.73 | |
| Week Change: 0.83% Year-to-date Change: 21.9% | |
| UFPT Links: Profile News Message Board | |
| Charts:- Daily , Weekly | |
| Add UFPT to Watchlist: View: Get Complete UFPT Trend Analysis ➞ | |
 | BH Biglari Holdings Inc. |
| Sector: Services & Goods | |
| SubSector: Restaurants | |
| MarketCap: 149.07 Millions | |
| Recent Price: 201.36 Smart Investing & Trading Score: 76 | |
| Day Percent Change: 0.58% Day Change: 1.17 | |
| Week Change: 0.82% Year-to-date Change: 22.1% | |
| BH Links: Profile News Message Board | |
| Charts:- Daily , Weekly | |
| Add BH to Watchlist: View: Get Complete BH Trend Analysis ➞ | |
 | PAYO Payoneer Global Inc. |
| Sector: Technology | |
| SubSector: Software - Infrastructure | |
| MarketCap: 1710 Millions | |
| Recent Price: 4.93 Smart Investing & Trading Score: 93 | |
| Day Percent Change: -2.38% Day Change: -0.12 | |
| Week Change: 0.82% Year-to-date Change: -6.8% | |
| PAYO Links: Profile News Message Board | |
| Charts:- Daily , Weekly | |
| Add PAYO to Watchlist: View: Get Complete PAYO Trend Analysis ➞ | |
 | CBZ CBIZ, Inc. |
| Sector: Services & Goods | |
| SubSector: Business Services | |
| MarketCap: 1121.32 Millions | |
| Recent Price: 75.53 Smart Investing & Trading Score: 83 | |
| Day Percent Change: -3.57% Day Change: -2.80 | |
| Week Change: 0.81% Year-to-date Change: 20.7% | |
| CBZ Links: Profile News Message Board | |
| Charts:- Daily , Weekly | |
| Add CBZ to Watchlist: View: Get Complete CBZ Trend Analysis ➞ | |
 | FSLY Fastly, Inc. |
| Sector: Technology | |
| SubSector: Application Software | |
| MarketCap: 1973.72 Millions | |
| Recent Price: 12.40 Smart Investing & Trading Score: 30 | |
| Day Percent Change: -3.35% Day Change: -0.43 | |
| Week Change: 0.81% Year-to-date Change: -30.3% | |
| FSLY Links: Profile News Message Board | |
| Charts:- Daily , Weekly | |
| Add FSLY to Watchlist: View: Get Complete FSLY Trend Analysis ➞ | |
| Too many stocks? View smallcap stocks filtered by marketcap & sector |
| Marketcap: All SmallCap Stocks (default-no microcap), Large, Mid-Range, Small & MicroCap |
| Sector: Tech, Finance, Energy, Staples, Retail, Industrial, Materials, Utilities & Medical |
|
Best Stocks Today 12Stocks.com |
© 2024 12Stocks.com Terms & Conditions Privacy Contact Us
All Information Provided Only For Education And Not To Be Used For Investing or Trading. See Terms & Conditions


One More Thing ... Get Best Stocks Delivered Daily!
Never Ever Miss A Move With Our Top Ten Stocks Lists
Find Best Stocks In Any Market - Bull or Bear Market
Take A Peek At Our Top Ten Stocks Lists: Daily, Weekly, Year-to-Date & Top Trends
Find Best Stocks In Any Market - Bull or Bear Market
Take A Peek At Our Top Ten Stocks Lists: Daily, Weekly, Year-to-Date & Top Trends
Smallcap Stocks With Best Up Trends [0-bearish to 100-bullish]: B. Riley[100], Central Pacific[100], California Water[100], Cricut [100], Carpenter [100], Haemonetics [100], Sanmina [100], Trustmark [100], Comstock Resources[100], EchoStar [100], Mueller Industries[100]
Best Smallcap Stocks Year-to-Date:
CareMax [490.72%], Janux [338.34%], Viking [270.02%], Alpine Immune[239.52%], Longboard [218%], Super Micro[177%], Arcutis Bio[166.56%], Avidity Biosciences[159.79%], Vera [149.94%], Hippo [128.87%], Stoke [122.15%] Best Smallcap Stocks This Week:
Matterport [168.97%], B. Riley[73.54%], Impinj [33.73%], ProKidney [32.84%], Seres [32.65%], Riot Blockchain[32.64%], Ribbon [25.58%], Cullinan Oncology[22.92%], P.A.M. Transportation[22.85%], NuScale Power[21.44%], Hibbett Sports[21.03%] Best Smallcap Stocks Daily:
Impinj [28.65%], P.A.M. Transportation[17.95%], B. Riley[16.61%], Strategic Education[16.28%], OptiNose [14.56%], JELD-WEN Holding[11.54%], Sonic Automotive[10.86%], Intevac [10.54%], SiTime [8.84%], Noodles & [8.08%], ProKidney [7.75%]